US ECONOMICS
EMPLOYMENT
DoL. BLS. January 10, 2020. THE EMPLOYMENT SITUATION -- DECEMBER 2019
Total nonfarm payroll employment rose by 145,000 in December, and the unemployment
rate was unchanged at 3.5 percent, the U.S. Bureau of Labor Statistics reported
today. Notable job gains occurred in retail trade and health care, while mining
lost jobs.
This news release presents statistics from two monthly surveys. The household survey
measures labor force status, including unemployment, by demographic characteristics.
The establishment survey measures nonfarm employment, hours, and earnings by industry.
For more information about the concepts and statistical methodology used in these
two surveys, see the Technical Note.
Household Survey Data
In December, the unemployment rate held at 3.5 percent, and the number of unemployed
persons was unchanged at 5.8 million. A year earlier, the jobless rate was 3.9 percent,
and the number of unemployed persons was 6.3 million. (See table A-1.)
Among the major worker groups, the unemployment rates for adult men (3.1 percent), adult
women (3.2 percent), teenagers (12.6 percent), Whites (3.2 percent), Blacks (5.9 percent),
Asians (2.5 percent), and Hispanics (4.2 percent) showed little or no change in December.
(See tables A-1, A-2, and A-3.)
The number of long-term unemployed (those jobless for 27 weeks or more), at 1.2 million,
was unchanged in December and accounted for 20.5 percent of the unemployed. (See table
A-12.)
The labor force participation rate was unchanged at 63.2 percent in December. The
employment-population ratio was 61.0 percent for the fourth consecutive month but was
up by 0.4 percentage point over the year. (See table A-1.)
The number of persons employed part time for economic reasons, at 4.1 million, changed
little in December but was down by 507,000 over the year. These individuals, who would
have preferred full-time employment, were working part time because their hours had been
reduced or they were unable to find full-time jobs. (See table A-8.)
In December, 1.2 million persons were marginally attached to the labor force, down by
310,000 from a year earlier. (Data are not seasonally adjusted.) These individuals were
not in the labor force, wanted and were available for work, and had looked for a job
sometime in the prior 12 months. They were not counted as unemployed because they had
not searched for work in the 4 weeks preceding the survey. (See table A-16.)
Among the marginally attached, there were 277,000 discouraged workers in December, down
by 98,000 from a year earlier. (Data are not seasonally adjusted.) Discouraged workers
are persons not currently looking for work because they believe no jobs are available for
them. The remaining 969,000 persons marginally attached to the labor force in December
had not searched for work for reasons such as school attendance or family responsibilities.
(See table A-16.)
Establishment Survey Data
Total nonfarm payroll employment increased by 145,000 in December. Notable job gains
occurred in retail trade and health care, while mining lost jobs. In 2019, payroll
employment rose by 2.1 million, down from a gain of 2.7 million in 2018. (See table B-1.)
In December, retail trade added 41,000 jobs. Employment increased in clothing and
accessories stores (+33,000) and in building material and garden supply stores (+7,000);
both industries showed employment declines in the prior month. Employment in retail trade
changed little, on net, in both 2019 and 2018 (+9,000 and +14,000, respectively).
Employment in health care increased by 28,000 in December. Ambulatory health care services
and hospitals added jobs over the month (+23,000 and +9,000, respectively). Health care
added 399,000 jobs in 2019, compared with an increase of 350,000 in 2018.
Employment in leisure and hospitality continued to trend up in December (+40,000). The
industry added 388,000 jobs in 2019, similar to the increase in 2018 (+359,000).
Mining employment declined by 8,000 in December. In 2019, employment in mining declined
by 24,000, after rising by 63,000 in 2018.
Construction employment changed little in December (+20,000). Employment in the industry
rose by 151,000 in 2019, about half of the 2018 gain of 307,000.
In December, employment in professional and business services showed little change
(+10,000). The industry added 397,000 jobs in 2019, down from an increase of 561,000
jobs in 2018.
Employment in transportation and warehousing changed little in December (-10,000).
Employment in the industry increased by 57,000 in 2019, about one-fourth of the 2018
gain of 216,000.
Manufacturing employment was little changed in December (-12,000). Employment in the
industry changed little in 2019 (+46,000), after increasing in 2018 (+264,000).
In December, employment showed little change in other major industries, including wholesale
trade, information, financial activities, and government.
In December, average hourly earnings for all employees on private nonfarm payrolls rose
by 3 cents to $28.32. Over the last 12 months, average hourly earnings have increased by
2.9 percent. In December, average hourly earnings of private-sector production and
nonsupervisory employees, at $23.79, were little changed (+2 cents). (See tables B-3 and
B-8.)
The average workweek for all employees on private nonfarm payrolls was unchanged at 34.3
hours in December. In manufacturing, the average workweek and overtime remained at 40.5
hours and 3.2 hours, respectively. The average workweek of private-sector production and
nonsupervisory employees held at 33.5 hours. (See tables B-2 and B-7.)
The change in total nonfarm payroll employment for October was revised down by 4,000 from
+156,000 to +152,000, and the change for November was revised down by 10,000 from +266,000
to +256,000. With these revisions, employment gains in October and November combined were
14,000 lower than previously reported. (Monthly revisions result from additional reports
received from businesses and government agencies since the last published estimates and
from the recalculation of seasonal factors.) After revisions, job gains have averaged
184,000 over the last 3 months.
FULL DOCUMENT: https://www.bls.gov/news.release/pdf/empsit.pdf
GDP
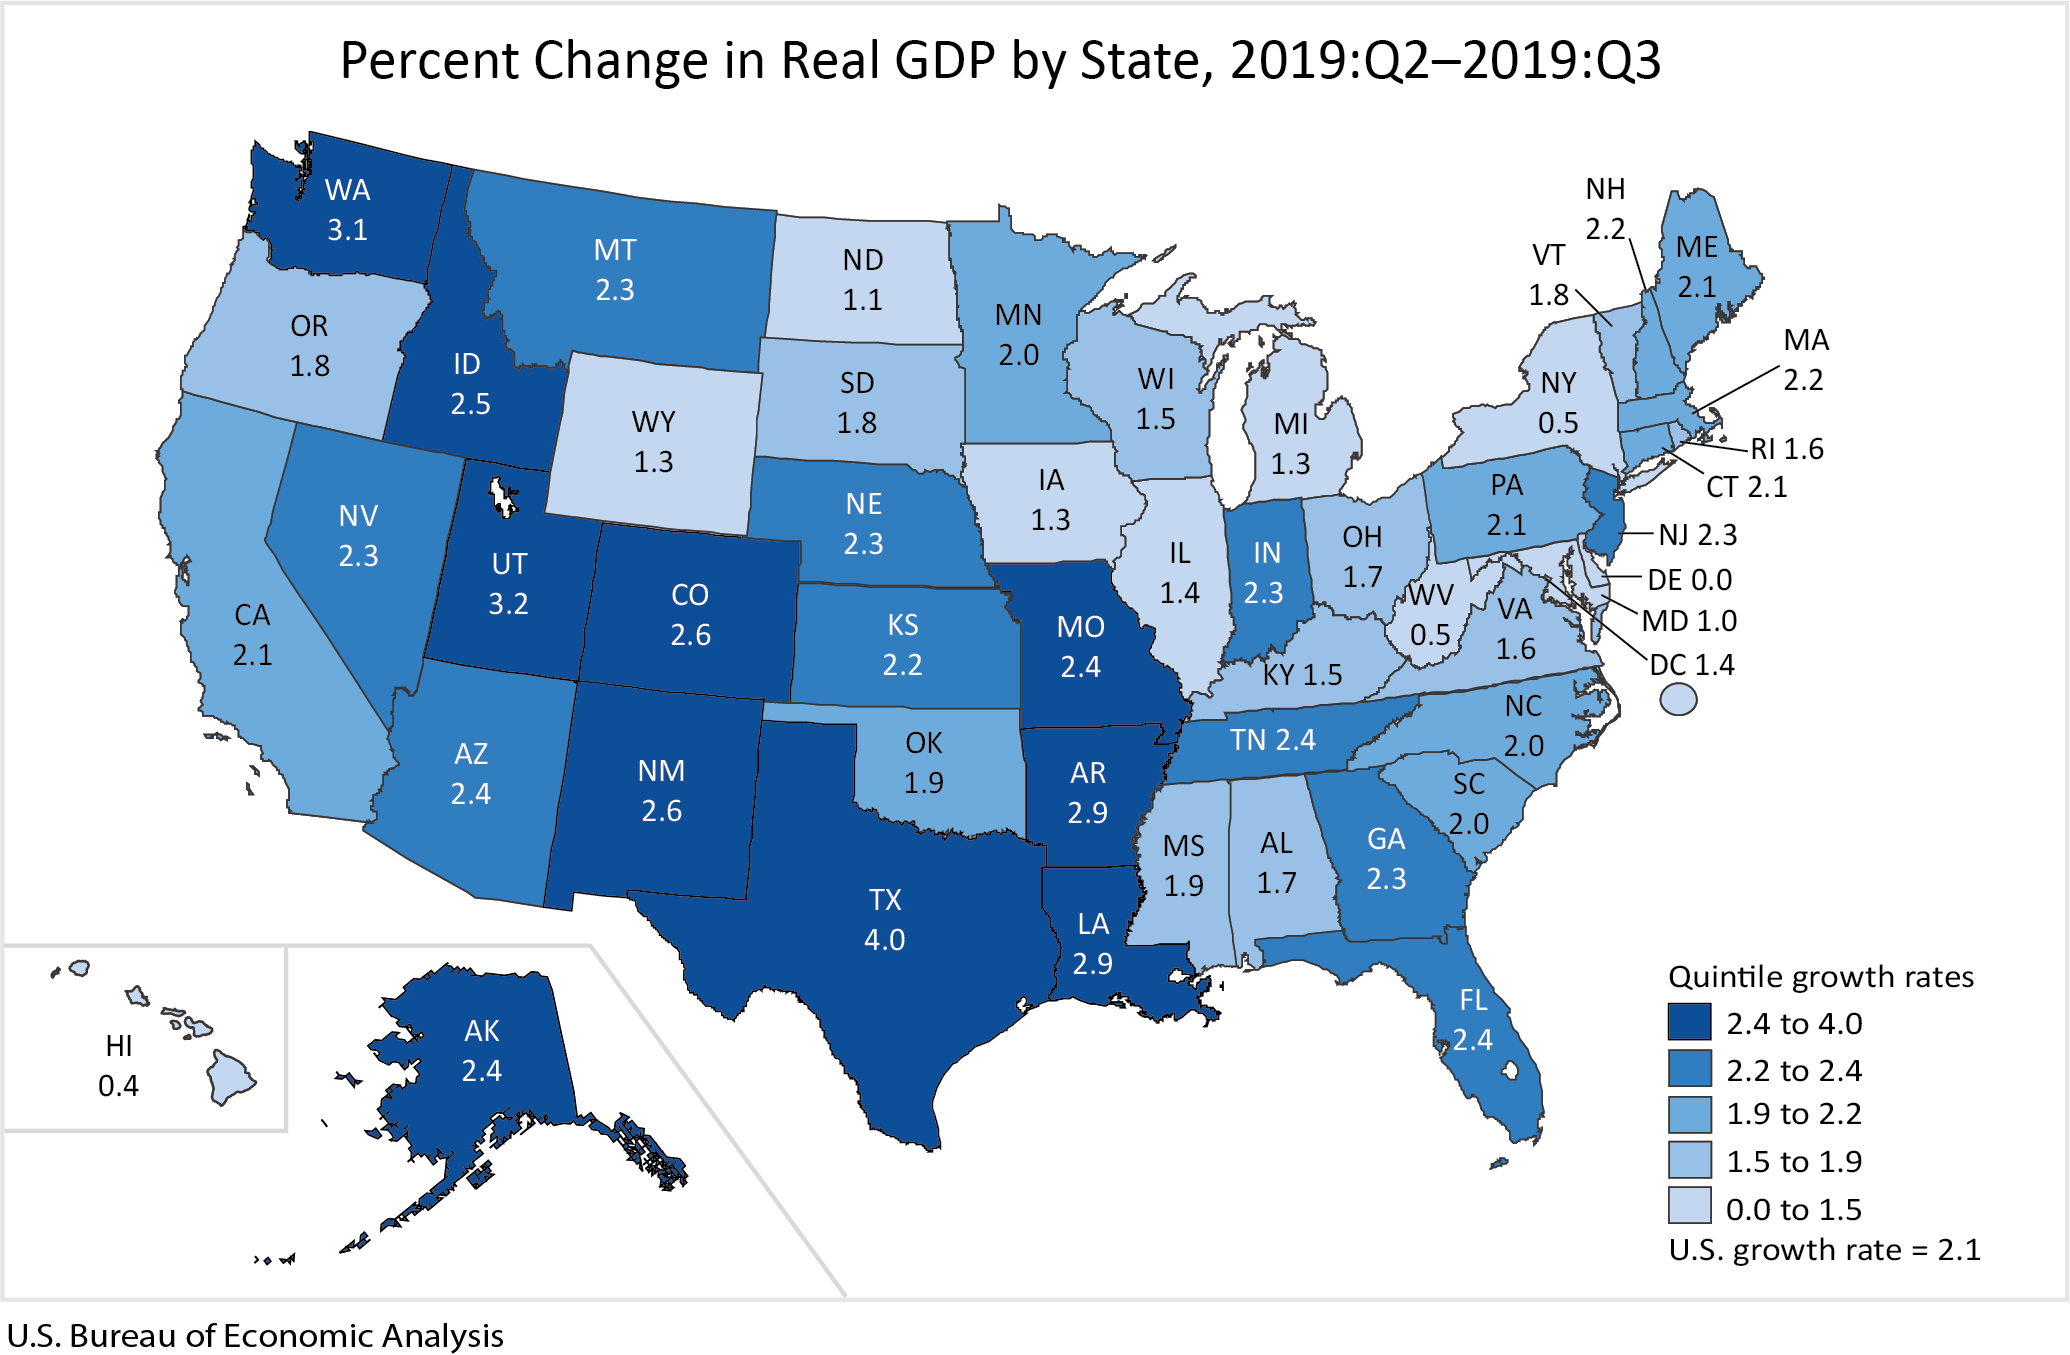
DoC. BEA. January 10, 2020. Gross Domestic Product by State, Third Quarter 2019. Texas Was the Fastest Growing State in the Third Quarter
Real gross domestic product (GDP) increased in 49 states and the District of Columbia in the third quarter of 2019, according to statistics released today by the U.S. Bureau of Economic Analysis. The percent change in real GDP in the third quarter ranged from 4.0 percent in Texas to 0.0 percent in Delaware (table 1).
Nondurable goods manufacturing; retail trade; and professional, scientific, and technical services were the leading contributors to the increase in real GDP nationally (table 2).
- Nondurable goods manufacturing increased 10.1 percent for the nation and contributed to growth in all 50 states. This industry was the leading contributor to growth in Texas, the fastest growing state (GDP by Industry table 1).
- Retail trade increased 8.2 percent for the nation and contributed to growth in all 50 states and the District of Columbia.
- Professional, scientific, and technical services increased 5.6 percent for the nation and contributed to growth in all 50 states and the District of Columbia.
In contrast, finance and insurance decreased 5.3 percent for the nation, subtracting from growth in all 50 states and the District of Columbia. This industry was the leading contributor to slow growth in New York and in Delaware–the slowest growing state.
CUBA
U.S. Department of State. 01/10/2020. United States Further Restricts Air Travel to Cuba. Michael R. Pompeo, Secretary of State
Today, at my request, the U.S. Department of Transportation (DOT) suspended until further notice all public charter flights between the United States and Cuban destinations other than Havana’s José Martí International Airport. Nine Cuban airports currently receiving U.S. public charter flights will be affected. Public charter flight operators will have a 60-day wind-down period to discontinue all affected flights. Also, at my request, DOT will impose an appropriate cap on the number of permitted public charter flights to José Martí International Airport. DOT will issue an order in the near future proposing procedures for implementing the cap.
Today’s action will prevent the Cuban regime from benefitting from expanded charter service in the wake of the October 25, 2019, action suspending scheduled commercial air service to Cuba’s airports other than Havana. Today’s action will further restrict the Cuban regime’s ability to obtain revenue, which it uses to finance its ongoing repression of the Cuban people and its unconscionable support for dictator Nicolas Maduro in Venezuela. In suspending public charter flights to these nine Cuban airports, the United States further impedes the Cuban regime from gaining access to hard currency from U.S. travelers.
CANADA
U.S. Department of State. 01/10/2020. Secretary Pompeo’s Call with Canadian Foreign Minister Champagne
The below is attributable to Spokesperson Morgan Ortagus:
Secretary of State Michael R. Pompeo spoke today with Canadian Foreign Minister François‑Philippe Champagne. Secretary Pompeo and Foreign Minister Champagne discussed the crash of Ukraine International Airlines flight PS752. The Secretary extended his deepest condolences to the families and friends of the victims, and offered U.S. support for full cooperation with any investigation. The Secretary and Foreign Minister also spoke about the Iranian regime’s continued aggressive and destabilizing actions in the region and steps to contain it, specifically, the opportunity for an expanded NATO force in Iraq and appropriate burden sharing. Secretary Pompeo also explained the United States’ interest in the March 20 election of Organization of American States leadership, specifically the re-election of Secretary General Luis Almagro, who has effectively restored the role of the Organization of American States as the key regional organization to address the central challenges in the hemisphere.
IT / CYBERSECURITY
U.S. Department of State. 01/09/2020. Senior State Department Official On State Department 2019 Successes on Cybersecurity and 5G Issues. Washington, D.C.
MODERATOR: Okay, as we continue our series of 2019 retrospectives and looking forward to 2020, we’ve brought in one of our leaders from the Economics Bureau. here will talk to you. He’ll start with some opening comments and then take some questions. And all right, sir, take it away.
SENIOR STATE DEPARTMENT OFFICIAL: Great. Thanks for that introduction. Happy New Year, everyone. Thanks for coming today. So I lead the part of the State Department that’s responsible for our international engagement on cyber security and digital economy matters. The State Department leads the United States’ efforts to promote an open, interoperable, reliable, and secure cyberspace and to see technology deployed around the world, including 5G technology, that’s secure and reliable.
As we see now, roughly half the world’s population now will be connected to the internet. We’re looking forward to seeing the next the 3 billion people connected after that. But from that, even that amount of deployment we’ve seen, and we’ve obviously gained tremendously in the form of economic growth, trillions of dollars are generated a year just because we’re able to have greater efficiencies; greater sharing of data, information; improved supply chains from the internet in the ecosystem internationally that we have.
Of course, with those great opportunities come great challenges as well. Inherently cyberspace is borderless, therefore actions taken by one country in one part of the world can instantaneously affect others in other parts of the world, therefore we must have cooperation and coordination in cyberspace. We must use diplomatic tools to ensure that we are coordinated with partners, allies, and other friends to bring them along, and then also talk to competitors and adversaries about activities in cyberspace to ensure stability in cyberspace and to promote and prevent – promote successful outcomes that prevent cyber incidents from happening that could otherwise disrupt the commerce that we see throughout cyberspace.
One of the most significant accomplishments we had this year on the cooperation front was in late September during the High-Level Week at the UN General Assembly. Deputy Secretary Sullivan led a ministerial engagement where we had 26 other countries join in signing a joint statement about our united views on stability in cyberspace, committing to hold – first of all, committing to norms of responsible state behavior in cyberspace, responsible state behavior, and committing to hold nations that act contrary to those norms accountable for transgressions against these norms of responsible state behavior.
But for more than a decade we have been working – the United States and other governments have been working – the United Nations developed roughly 12 norms of responsible state behavior. And so the golden rule of those norms is that one nation should not attack another nation’s critical infrastructure that is providing services to the public. We saw actions that went against that in recent years, including in 2018 in the form of Russia’s launch of the Not Petya attack which disabled critical infrastructure around the world, as well as North Korea’s actions with the WannaCry ransomware attack that disrupted critical services to the public as well.
So we’ve promoted those norms. We’ve also been involved following the National Cyber Strategy, which was released in September of 2018. Over the last year of implementing, we’ve been the interagency lead for implementing our national cyber deterrent strategy. That is where we are marshalling additional tools – that is, consequences – that are timely, costly, and consequential enough to convince adversaries that they should not use irresponsible cyber tools to achieve their ends in cyberspace.
We know that our key competitors and adversaries in cyberspace see cyber as an asymmetric tool to achieve their ends. They will use cyber to achieve their political, economic, and even military ends in cyberspace, so we must be vigilant in how we respond to those. And it’s important that we continue to develop global consensus around responsible state behavior in cyberspace.
My office is also in charge of leading our efforts to work with our partners and allies and others to educate them about risks from the fifth generation of wireless technology, or 5G. We talked about the great opportunities that’s going to provide because it’s going to be the underpinning of all of our future critical infrastructure and provide tremendous amounts of data that can be used for artificial intelligence and enable a whole new set of services and activities online.
But of course, when we have that much connectivity, the disruption of it or the amount of data, sensitive personal data and corporate data is – can be put at risk in those networks. That’s why we think that we need to only have the most trusted of vendors providing 5G equipment – that is, the software and hardware – for those networks.
Over the last year, we’ve worked very closely with European countries in particular because they’re one of the first to move out on 5G. We had the European Union’s risk assessment come out in early October that noted a number of the concerns that we’ve been sharing with them, which include that because of the nature of 5G there will be a whole new expanded software attack surface area because it’s much more software dependent, and that countries need to focus on the risk of influence of a third country over vendors for those networks.
We’ve pointed to countries like China that have a national intelligence law that require a company to take actions when required to by the intelligence and security services and to do so secretly. So that kind of influence has been highlighted in the risk assessment in the EU, and it was further buttressed by a EU Council conclusions that came out on December 3rd that also acknowledged that they need to look at the legal and policy frameworks that govern a company that will be a vendor for 5G.
So we’ve had tremendous progress in that. There will be now a set of security recommendations, a toolbox they call it in the EU, coming out likely this month or in the next couple months from the EU. So in the next year we’re going to be focused very much on helping European countries implement these security measures.
Security for 5G is not just about the technical cyber measures that can include encryption, the architecture of the network, the configuration. It also focuses on what we call the non-technical measures; that is, the ability to trust a vendor in the network. It’s inherently possible for a vendor in the supply chain to insert malicious code in the many millions of lines of code and it not be discovered through any kind of technical means along the way, therefore you must have trust in the network. We’ve seen the Europeans recognize that and we’ve seen governments around the world start to recognize that concern. So we’ve made a lot of progress in that area.
The third thing I wanted to highlight was the State Department is also the lead for many of the international communications standards bodies that we engage in around the world. This last year was the World Radiocommunications congress – Conference in Sharm el-Sheikh, Egypt, which was important because that’s what they call their spectrum conference. As a result of that conference, which ended in November, we identified 17 gigahertz of millimeter-wave spectrum, which will be very important for 5G deployments. That – the spectrum that was identified for 5G there aligns with the Federal Communications Commission 5G FAST Plan. That means that we will have consistent efforts around the globe to have the same bands used for 5G that allow interoperability of equipment and an increase in the scale of equipment that’s all using the same bands. That was an important outcome for us and for the continued deployment of 5G in the United States.
I guess the last thing, or fourth thing, I should – I wanted to mention too was that Secretary Pompeo announced in the summer of 2018 that we were going to start a Digital Connectivity and Cybersecurity Partnership, which is a way of us providing assistance to countries around the world to help them deploy sustainable models for digital infrastructure to increase their connectivity, and to do so in ways that are open, secure, and consistent with democratic values.
In the last year we’ve now announced over $51 million in – through – in 2019 for this Digital Connectivity and Cybersecurity Partnership in just the Indo-Pacific region. That was our initial focus. And just in December we announced $10 million that we’re going to deploy into Latin America. So that program will continue into the next year, in 2020, and we’re looking forward to seeing successes in the form of additional training for countries and those countries coming along with seeing our model for an open and interoperable internet.
So with that, I’d love to take any questions you have.
MODERATOR: Matt.
QUESTION: Yeah. Hi, thanks. Over the last two weeks or so there’s been – there have been a lot of reports of an uptick in Iranian cyber attacks, harassment, that kind of thing. I’m wondering if that squares with what you’ve seen and if there’s any way of you – if you guys are tracking a surge in this, particularly after the Soleimani strike.
SENIOR STATE DEPARTMENT OFFICIAL: Well, what I can say is we know that for some time that Iran has been one of the most malicious actors out there. They’ve attacked our critical infrastructure in the past – our banks in 2012, and in 2016 and 2017 they executed data deletion operations against the Saudis and against private infrastructure in Saudi Arabia. So we’re very concerned about Iran’s capabilities and activities. I can’t specifically comment, unfortunately, on the tracking. That would be classified here related to Iran – Iran’s cyber activities.
QUESTION: Can I follow up?
MODERATOR: Go ahead.
QUESTION: I was going to say, can you elaborate at all if you’ve given any guidance to the diplomatic facilities or any State Department entities about stepping up their cyber security after what’s gone on with Iran?
SENIOR STATE DEPARTMENT OFFICIAL: I don’t think we’ve publicly said anything about that. Our Diplomatic Security Bureau is in charge of putting out advisories internally to our posts, and so I’d defer – refer you to them on that point. I would say that, as you probably know, the Department of Homeland Security has put out advisories related to this, to the Iranian threat, and we’ve talked to private – the private sector in the United States about being vigilant, and that’s the same message we send internationally as well. Unfortunately, I don’t have anything new other than what’s already been put out.
MODERATOR: Is that it? Carol.
QUESTION: Yeah. How vulnerable do you judge the U.S. being to the risk of Iran breaking into the infrastructure, and how would you – how would you compare Iran’s capabilities with that of China and North Korea and Russia?
SENIOR STATE DEPARTMENT OFFICIAL: Well, our Director of National Intelligence has put Iran on par with the other three countries as far as relative risk and their ability to intrude into industrial control systems of – into physical infrastructure. I don’t want to sort of characterize any more than that about our vulnerabilities as we are always reminding the private sector and individuals they need to be vigilant about the threats that they face from both criminals and other actors as well as the more sophisticated nation-state actors.
QUESTION: Well, is, say – is it a bigger threat to the infrastructure than, say, financial institutions, or can you talk generally about it without being specific, naming companies or networks?
SENIOR STATE DEPARTMENT OFFICIAL: Sorry, I can’t go into the specific. The Department of Homeland Security is in charge of sort of identifying that, and they’re – what they want to say publicly is what we would defer to as far as the threat to the United States and threat to sort of global infrastructure. I don’t want to step on their messaging.
QUESTION: Okay. Scale of 1 to 10, how big is the threat?
SENIOR STATE DEPARTMENT OFFICIAL: I’m not going to answer a hypothetical.
MODERATOR: Next? Nike.
QUESTION: Yes, hi. Thank you so much for coming to talk to us. So VOA broadcasts to many countries in Asia and in Africa. Many of them are eager to develop economies with high-tech communications. What did you – what does the U.S. say to these countries who are eager to develop their 5G networks and who see the most attractive equipment and financial packages are all Chinese? How many years back would – if they resist the offer by Huawei, how many years back would that set their 5G development?
SENIOR STATE DEPARTMENT OFFICIAL: Listen, zero is the answer to that question. I will say Huawei has had a global campaign of propaganda that’s been joined forces with – by the Chinese Ministry of Foreign Affairs to convince people that they will be set back if they do not use Huawei technology. That is absolutely false. Nokia, Eriksson, and Samsung are worldwide right now deploying 5G networks.
Just yesterday, Nokia announced that it signed over 60 commercial deployments. These aren’t just trials. These aren’t inflated numbers. They have more than 60 commercial deployments around the world. They’re already in numerous networks around the world, in their 4 – 3G and 4G networks. Turning to 5G, those three radio access network providers all can supply these countries.
And we would say to those countries it’s really important that you come into any contractual relationship with any company, but especially one of these Chinese companies, with complete awareness about the debt burden that you’ll be asked to take on in the long term, about the preconditions that can apply to that, about the ways that your data might be used or exfiltrated in the future, about the governance of the internet, about the policies that will be pushed forward.
We know that China has pushed forward models that have said we should limit access to the internet in the form of who’s allowed to be on it, what kind of content is on – content filters are applied to the internet, and as well as using it for things like assigning social credit scores and the policies that have been adopted through a surveillance network in the Xinjiang province in China. We think that countries should be very much aware that if they do business with a company like Huawei they are setting themselves up to be part of these types of governance models that are not consistent with probably the best interest of their public or with democratic values.
QUESTION: Do you see most Southeast Asian countries or Africa countries on board with the U.S. on this security warning?
SENIOR STATE DEPARTMENT OFFICIAL: So we’re seeing a greater recognition that they need to look at the supply chain and look at the factors that one needs to consider in the form of whether or not you can trust the vendor themselves and the ability of the vendor to influence the hardware, the software updates, and that technology. That’s been acknowledged by numerous countries now.
The deployments of 5G, especially in Southeast Asia and in Africa and other places in the developing world, are just starting. It’s going to play out over a period of years. So it’s too early to judge, I think, to say that whether or not they’ve adopted, if you will, a U.S. model. Really what we’re trying to have a discussion about is an awareness of the security issues. It’s not just cyber security. It’s an understanding that the supply chain inherently sets you up to be vulnerable because those trusted partners are already on the inside, and they have almost complete ability to update software and introduce changes to ways that the hardware and software operates over time.
So that understanding about the increased risk, I don’t think anyone was even talking about in 2018. I think through our efforts – if I may say – are why that now there’s a global discussion about the security of the supply chain.
MODERATOR: David.
QUESTION: On this 5G issue, it seems like in a lot of countries, in Africa and also in Europe, that your warnings about how China can coopt that system have fallen on deaf ears and a lot of countries are proceeding with plans to work with Huawei on building out their 5G networks. Can you speak a little bit to your frustration, if there is any, that they seem to be ignoring these demands from the U.S.? And what are you doing to counter that?
SENIOR STATE DEPARTMENT OFFICIAL: So I think that we’re hearing a lot of acknowledgment of the concerns we’d been raising and we’re hearing countries say they understand that. As I mentioned earlier, the European Union has put these specific concerns into their risk assessment, into the council conclusions. We anticipate seeing even more in the toolbox of security (inaudible) in the early part of this year.
We’ve also seen a number of country – a number of telecom operators quietly go with Ericsson, Nokia, and Samsung, and rest assured that Huawei was in their bidding at the same time. They’re probably even offering a lower price. We don’t know exactly, but that – there are a number of operators that are quietly doing this. It is really this Huawei-generated propaganda campaign out there that highlights every Huawei win as if it was a – the only thing that’s happening in the marketplace.
And I would just point out that a lot of these contracts are not yet executed on. They might sign something, but it does not actually lead to actual deployment of networks. Many countries are waiting for these European Union council – sorry – European Union security recommendations before they move out on deployment of the infrastructure.
And the other thing we talk to companies – countries about is it very important that they, at the end of the day, are responsible for their citizens’ wellbeing. It is a national security decision. It is not one that they should cede to the private companies, the telecom operators who do not have a full understanding of all the national security interests that are at stake and that which we talk to them about in our many bilateral engagements.
QUESTION: Thank you. To follow up on Nick’s question, in Europe we spoke about the progress with the EU as a global institution. Which other countries of concern where the discussions are still difficult on Huawei and the 5G?
SENIOR STATE DEPARTMENT OFFICIAL: Oh sorry, I just missed the very end.
QUESTION: Which are the countries of main concern, whether discussions in Europe are more difficult on Huawei?
SENIOR STATE DEPARTMENT OFFICIAL: Well, there’s discussions going on in many countries in Europe. I mean, I’m just reflecting what you can read in the press any day, and that’s in Germany there’s a lot of discussion going on about – they announced a toolkit that many of us consider to be inadequate, that suggested that just having some testing would be able to identify whether or not a vendor had a potential to introduce vulnerability. The testing will never find these vulnerabilities injected into millions of lines of code. So there’s a lot of debate going on in numerous countries in Europe at this time.
But we have seen operators in, for example, Norway already go with Ericsson or Nokia. We’ve seen many, as I said, go quietly and select a trusted vendor.
MODERATOR: Cool. Joel.
QUESTION: Thanks for doing this. I want to just go back to what you were saying about educating countries in governance models. Do you think that China will use their 5G deployments overseas to expand their own surveillance into – or perhaps this social credit score that you mentioned. Would there be – would China use overseas 5G networks to have a – to build out a global social credit score program?
SENIOR STATE DEPARTMENT OFFICIAL: We can’t say for sure what they will do. I think that’s in part because 5G is in a nascent stage. We don’t know all the data that people put into this network. There’s obviously a potential for much more personal data. We’ve seen, of course, how China has used surveillance through connected devices, including technology provided by Huawei to surveil its own citizens. It’s hard to say what would be done abroad.
We do know that the company has no choice but to follow the mandate of the Chinese Communist Party. They have – the company has no ability to stop that, because they don’t have a rule of law system and they don’t have an independent judiciary. So the real concern is all the potential things that could happen.
I can’t say, sitting here now, that I’m certain that this or that will be established. But there’s tremendous risk, especially for people who care about human rights and uses of data, to put yourself in a situation where a major part of your infrastructure, which you cannot replace easily, will be governed by a system that is not transparent and does not follow the rule of law.
MODERATOR: Alex.
QUESTION: Sorry I missed this, if you already addressed it, but I just wanted to ask for sort of a 5G-focused readout on the Pompeo-Raab meeting today. Did Pompeo press him on that issue? What was the reaction?
SENIOR STATE DEPARTMENT OFFICIAL: I haven’t seen anything on it yet.
QUESTION: And in terms of when the UK decision might come, have you heard – gotten any sort of sense of when we might find out?
SENIOR STATE DEPARTMENT OFFICIAL: I hear it’s soon.
QUESTION: One last one. I think Senator Cotton introduced a bill that would basically restrict countries that receive – that use Huawei in their 5G networks from receiving U.S. intelligence. And I just wondered if you would support that bill, if you think that should be passed.
SENIOR STATE DEPARTMENT OFFICIAL: Well, I can’t comment on that bill. We haven’t formed an interagency opinion on that. But I would also point out that – I think everyone knows, may know – that the National Defense Authorization Act contain a provision that requires the Intelligence Community to assess the cybersecurity quality of the infrastructure of any partner that they’re going to engage into agreement with.
And that follows into the general scope of what we’ve been sharing with countries, not as a threat to them, but to say that because of the sensitive information that we share with countries on a daily basis, because of the very robust information-sharing relationships that we have, operational relationships, we don’t want to see those degraded by the fact that we cannot share information in the same expeditious manner that we do today, by finding new channels or having to reassess how we do that. So we don’t want to end up in a position where we’re reassessing our information-sharing capabilities. So that’s why we in part ask them to ensure that they are going to trusted vendors.
QUESTION: Can I just ask a follow-up on that? Is the presence of a Huawei network, like in a country like the UK, automatically a deal breaker in terms of being able to share this kind of sensitive intelligence that you share with them now? I mean, it – just by Huawei being present, does that automatically mean that the network has some vulnerability that would let it —
SENIOR STATE DEPARTMENT OFFICIAL: We’re not ready to sort of say what – how we will respond, or how we might have to respond. We will have to do a reassessment is what we would say of any part of a network has Huawei or a untrusted vendor. There’s others that could be out there that we would consider untrusted. What we want is trusted suppliers, how we know – we know how they do their software upgrades; we know who’s responsible for the hardware and the software technology.
With NATO partners especially, we talk about the need to have good troop mobilization. We do not want to provide potential adversaries access to all the kind of data that proliferates around people’s daily activities that they would gain insight into what we’re doing because they also are the vendor for the telecom network.
So there’s a number of concerns that we sort of lay out there for our partners to make sure they’re aware of as they’re making these decisions, but we haven’t decided how exactly we would have to respond. But we would have to do some kind of reassessment.
QUESTION: So you’re pretty confident that the Scandinavians and the South Koreans aren’t going to become evil? It sounds that way. I mean, why do you have so much confidence in Ericsson, Nokia, and Samsung, that they’re not going to flip into a Huawei?
SENIOR STATE DEPARTMENT OFFICIAL: Yeah. Well, in part they’re publicly traded companies, so they respond to a board of directors. They appear to Western legal systems.
QUESTION: Now.
SENIOR STATE DEPARTMENT OFFICIAL: Yeah. If – Matt, if there were to be a change in the country, in the company, yeah, then you might have to reassess.
QUESTION: Well, why aren’t there any American companies out there in this?
SENIOR STATE DEPARTMENT OFFICIAL: So we’re talking about this —
QUESTION: Or are we not trusted either?
SENIOR STATE DEPARTMENT OFFICIAL: We talk about this radio access network, which is only a small – so Cisco is a major provider, Qualcomm is a major provider for other parts of the network. And on – we’re on the cusp of a change in the whole market where I think we’re going to see less lock-in to these five major providers in the world, and disaggregation where they – different components can be bought from different providers, and won’t be locked in.
QUESTION: Well, does that mean that you could possibly, if in Nick’s scenario, someone – a country goes with Huawei, that that – the vulnerability could be watered down by bringing in other companies, if there is this disaggregation so that you could basically minimize – even if Huawei is there, you could minimize the – or is that just some —
SENIOR STATE DEPARTMENT OFFICIAL: So our interagency experts’ assessment is that any smart components that belong to Huawei are a risk that’s too high to have, given what’s going to ride on these networks, given that there’ll be telemedicine, that there’ll be autonomous vehicles. I will say that as far as I can tell, the way that China develops their technology is to have a closed ecosystem that Huawei would just as soon have everything provided by Huawei chips and be totally politically integrated. And in part they subsidize all parts of that, too. The government subsidizes companies there. They have an unfair set of practices that make it cheaper. So I think it’s highly unlikely that even assuming that kind of hypothetical that they would ever be using Western components.
QUESTION: Okay. Last thing. We had a briefing – I think it was the week before Christmas, right – that touched on this Russian effort at the UN, and you were guys were trying to stop it, but it didn’t have much hope of success, for a new cybercrime thing. And in fact, it went ahead and it passed. And so there’s this commission that it set up that’s supposed to report back by I think it was August.
SENIOR STATE DEPARTMENT OFFICIAL: Yeah, I think that’s right. Yeah.
QUESTION: Now that you’ve failed to stop it, what are the options to now prevent this commission from producing something that is then accepted by —
SENIOR STATE DEPARTMENT OFFICIAL: Yeah. What we really need to ensure is that that mechanism not be a conduit or a pretext for Russia to further have entrenched their view that there should be controls on content and controls on access to information. So we were going to – we’re going to participate in that process.
QUESTION: So you are? Okay.
SENIOR STATE DEPARTMENT OFFICIAL: We will have to participate because we don’t want to let that outcome happen. We were opposed to it passing because we think it’s entirely redundant. More than 60 countries have signed onto the Budapest Cybercrime Convention of 2004. But I don’t – we can’t just stand by while this —
QUESTION: But given the vote that created the commission, what – do you think that you have a realistic shot at doing what you’re saying, preventing this commission from coming out with a recommendation for a new treaty that has these problematic Russian elements in it?
SENIOR STATE DEPARTMENT OFFICIAL: I think so. I think the people around the world don’t want to see their access to information limited. They don’t want to see their access to the internet limited. I think that is a distinct minority view that thugs like to have, and I think there’s a lot more good-natured people than thugs.
QUESTION: So who will be the engaged – who, you?
SENIOR STATE DEPARTMENT OFFICIAL: It’ll be some part of – INL also works on this issue at the State Department.
QUESTION: Thanks.
MODERATOR: All right. Sarah, anything?
QUESTION: My question was asked.
MODERATOR: Okay. Anybody else? All right. Last one.
QUESTION: Sorry. The provision you mentioned of the NDAA, I know that was only signed into law December 20th, so it hasn’t been that long, but is it coming up? Is it something that U.S. officials are using in conversations with UK officials to say – to kind of shot across the bow, look, this is something that we can take into account as you guys make your decision on whether to integrate Huawei into your 5G?
SENIOR STATE DEPARTMENT OFFICIAL: First of all, it’s too early I think to respond that quickly to a legislative item. But also I’d say that we’re having very close conversations, very vigorous conversations, with the United Kingdom right now. So I don’t want to characterize what exactly is being said.
MODERATOR: All right. Thanks, everybody.
QUESTION: Thanks a lot.
________________
ECONOMIA BRASILEIRA / BRAZIL ECONOMICS
INFLAÇÃO
IBGE. 10/01/2020. Em dezembro, IPCA foi de 1,15% e acumulou alta de 4,31% em 2019
O Índice Nacional de Preços ao Consumidor Amplo (IPCA) de dezembro subiu 1,15%, enquanto, em novembro, havia registrado 0,51%. Este foi o maior resultado para um mês de dezembro desde 2002, quando o IPCA ficou em 2,10%. Em dezembro de 2018, a taxa foi de 0,15%. No ano, o IPCA acumulou variação de 4,31%, 0,56 p.p. acima dos 3,75% registrados em 2018.
| Período | TAXA |
|---|---|
| Dezembro de 2019 | 1,15% |
| Novembro de 2019 | 0,51% |
| Dezembro de 2018 | 0,15% |
| Acumulado no ano / 12 meses | 4,31% |
O grupo Alimentação e bebidas apresentou a maior variação, 3,38%, e o maior impacto, 0,83 ponto percentual (p.p.) entre os nove grupos de produtos e serviços pesquisados. Outros seis grupos também registraram alta em dezembro, com destaque para os Transportes (1,54%) e as Despesas pessoais (0,92%). No lado das quedas, a maior contribuição negativa veio da Habitação (-0,13 p.p.), cuja variação no índice do mês foi de -0,82%. Os demais grupos ficaram entre a queda de 0,48% nos Artigos de residência e a alta de 0,66% em Comunicação.
| IPCA - Variação e Impacto por grupos - mensal | ||||
|---|---|---|---|---|
| Grupo | Variação (%) | Impacto (p.p.) | ||
| Novembro | Dezembro | Novembro | Dezembro | |
| Índice Geral | 0,51 | 1,15 | 0,51 | 1,15 |
| Alimentação e Bebidas | 0,72 | 3,38 | 0,18 | 0,83 |
| Habitação | 0,71 | -0,82 | 0,11 | -0,13 |
| Artigos de Residência | -0,36 | -0,48 | -0,01 | -0,02 |
| Vestuário | 0,35 | 0,00 | 0,02 | 0,00 |
| Transportes | 0,30 | 1,54 | 0,05 | 0,28 |
| Saúde e Cuidados Pessoais | 0,21 | 0,42 | 0,03 | 0,05 |
| Despesas Pessoais | 1,24 | 0,92 | 0,13 | 0,10 |
| Educação | 0,08 | 0,20 | 0,00 | 0,01 |
| Comunicação | -0,02 | 0,66 | 0,00 | 0,03 |
| Fonte: IBGE, Diretoria de Pesquisas, Coordenação de Índices de Preços | ||||
Após a aceleração registrada na passagem de outubro (0,05%) para novembro (0,72%), o grupo Alimentação e bebidas registrou alta de 3,38% em dezembro, maior variação mensal desde dezembro de 2002, quando o índice do grupo foi de 3,91%. Esse resultado foi particularmente afetado pelo comportamento dos preços das carnes (18,06%), que contribuíram com o maior impacto individual no IPCA de dezembro (0,52 p.p.). Os preços do frango inteiro (5,08%) e dos pescados (2,37%) também subiram, assim como os de outros gêneros alimentícios, como o feijão-carioca (23,35%) e o tomate (21,69%). No lado das quedas, destacam-se a cebola (-8,76%) e o pão francês (-0,68%), ambos com contribuição de -0,01 p.p.
A alimentação fora do domicílio (1,04%) também acelerou em relação ao mês anterior (0,21%), influenciada pelas altas da refeição (1,31%) e do lanche (0,94%).
Já o resultado do grupo dos Transportes (1,54%) é explicado pela alta dos combustíveis (3,57%), com destaque para a gasolina (3,36%) e o etanol (5,50%). À exceção do município de São Luís (-0,53%), todas as regiões pesquisadas apresentaram variação positiva nos preços da gasolina, que foram desde o 1,78% da região metropolitana de Salvador até os 5,71% do município de Aracaju.
Ainda em Transportes, as passagens aéreas, que já haviam subido 4,35% no mês anterior, registraram alta de 15,62% em dezembro, contribuindo com 0,07 p.p. no índice do mês. No item ônibus interestadual (3,28%), destaca-se o reajuste médio de 14,00% no valor das passagens em Salvador (7,30%), a partir de 5 de dezembro. Já no ônibus intermunicipal (0,25%), houve reajuste médio de 4,00% no valor das passagens em Belém (4,42%), com vigência a partir de novembro e apropriado no índice desde dezembro.
O grupo Despesas pessoais (0,92%) ainda foi influenciado pela alta dos jogos de azar (12,88%), com o reajuste nas apostas lotéricas, desde 10 de novembro.
A queda em Habitação (-0,82%) deve-se ao item energia elétrica (-4,24%), com recuo decorrente da mudança de bandeira tarifária. Em novembro, vigorava a bandeira vermelha patamar 1, com acréscimo de R$ 4,169 a cada 100 quilowatts-hora consumidos. Em dezembro, passou a vigorar a bandeira amarela, com custo de R$ 1,343 para cada 100 quilowatts-hora. Além disso, houve também reduções tarifárias em duas regiões: em Porto Alegre (-7,56%), a redução foi de 6,00% em uma das concessionárias pesquisadas, a partir de 22 de novembro; já em Rio Branco (-3,81%), as tarifas foram reduzidas em 4,67%, a partir de 13 de dezembro.
Ainda em Habitação, o resultado do item taxa de água e esgoto (0,26%) se deve aos reajustes de 18,00% em Belém (8,42%), vigente desde 14 de dezembro, e de 3,43% em Curitiba (1,46%), em vigor desde 11 de novembro. No que concerne ao gás de botijão (0,08%), vale ressaltar que a Petrobras anunciou um reajuste de 5,00% no preço do botijão de 13 kg, nas refinarias, a partir do dia 27 de dezembro.
Quanto aos índices regionais, a maior variação ficou com a região metropolitana de Belém (1,78%), principalmente por conta da alta nos preços das carnes (15,23%). Já o menor resultado foi registrado no município de Rio Branco (0,60%), influenciado pela queda do item energia elétrica (-3,81%) e, também, por uma alta menor nos preços das carnes (7,67%) na comparação com as demais regiões pesquisadas.
| IPCA - Variação por regiões - mensal e acumulada em 12 meses | ||||
|---|---|---|---|---|
| Região | Peso Regional (%) | Variação (%) | Variação Acumulada (%) | |
| Novembro | Dezembro | Ano | ||
| Belém | 4,23 | 0,93 | 1,78 | 5,51 |
| Brasília | 2,80 | 0,38 | 1,62 | 3,76 |
| São Luís | 1,87 | 1,05 | 1,47 | 4,28 |
| Goiânia | 3,59 | 0,70 | 1,40 | 4,37 |
| Curitiba | 7,79 | 0,61 | 1,35 | 3,99 |
| Campo Grande | 1,51 | 0,65 | 1,32 | 4,65 |
| Fortaleza | 2,91 | 0,22 | 1,28 | 5,01 |
| Salvador | 6,12 | 0,23 | 1,26 | 3,93 |
| Rio de Janeiro | 12,06 | 0,17 | 1,19 | 4,05 |
| Porto Alegre | 8,40 | 0,47 | 1,15 | 4,08 |
| Aracaju | 0,79 | 0,14 | 1,09 | 4,11 |
| Belo Horizonte | 10,86 | 0,46 | 1,05 | 4,20 |
| Recife | 4,20 | 0,14 | 0,96 | 3,71 |
| São Paulo | 30,67 | 0,70 | 0,93 | 4,60 |
| Vitória | 1,78 | 0,39 | 0,85 | 3,29 |
| Rio Branco | 0,42 | 0,72 | 0,60 | 3,82 |
| Brasil | 100,00 | 0,51 | 1,15 | 4,31 |
O IPCA é calculado pelo IBGE desde 1980, se refere às famílias com rendimento monetário de 01 a 40 salários mínimos, qualquer que seja a fonte, e abrange dez regiões metropolitanas do país, além dos municípios de Goiânia, Campo Grande, Rio Branco, São Luís, Aracaju e de Brasília.
Para o cálculo do índice do mês, foram comparados os preços coletados no período de 28 de novembro a 27 de dezembro de 2019 (referência) com os preços vigentes no período de 29 de outubro a 27 de novembro de 2019 (base).
Em dezembro, INPC sobe 1,22% e acumula 4,48% em 2019
O Índice Nacional de Preços ao Consumidor (INPC) de dezembro subiu 1,22%, contra 0,54% em novembro. Este resultado foi o maior para um mês de dezembro desde 2002, quando o índice foi de 2,70%. Em dezembro de 2018, a taxa foi de 0,14%.
Os produtos alimentícios subiram 3,66% em dezembro enquanto, no mês anterior, haviam registrado 0,78%. O agrupamento dos não alimentícios, por sua vez, apresentou variação de 0,17%, enquanto, em novembro, a taxa havia sido de 0,44%.
Quanto aos índices regionais, o município de Rio Branco (0,61%) apresentou o menor resultado, em função da queda do item energia elétrica (-4,12%) e, também, de uma alta menor nas carnes (7,59%), na comparação com as demais áreas de abrangência da pesquisa. Já o maior resultado foi registrado na região metropolitana de Belém (1,90%), influenciado, em grande medida, pela alta nos preços das carnes (14,45%).
| INPC - Variação por regiões - mensal e acumulada em 12 meses | ||||
|---|---|---|---|---|
| Região | Peso Regional (%) | Variação (%) | Variação Acumulada (%) | |
| Novembro | Dezembro | Ano | ||
| Belém | 6,44 | 0,96 | 1,90 | 5,76 |
| São Luís | 3,11 | 1,05 | 1,82 | 4,45 |
| Goiânia | 4,15 | 0,84 | 1,62 | 4,90 |
| Curitiba | 7,29 | 0,64 | 1,49 | 4,31 |
| Campo Grande | 1,64 | 0,72 | 1,38 | 4,76 |
| Brasília | 1,88 | 0,41 | 1,36 | 3,52 |
| Fortaleza | 5,42 | 0,34 | 1,29 | 4,96 |
| Salvador | 8,75 | 0,21 | 1,23 | 3,85 |
| Rio de Janeiro | 9,51 | 0,09 | 1,15 | 4,07 |
| Porto Alegre | 7,38 | 0,41 | 1,14 | 4,11 |
| Belo Horizonte | 10,60 | 0,42 | 1,08 | 4,45 |
| Aracaju | 1,29 | 0,17 | 1,07 | 4,13 |
| São Paulo | 24,24 | 0,83 | 1,02 | 4,89 |
| Recife | 5,88 | 0,09 | 0,97 | 3,59 |
| Vitória | 1,83 | 0,37 | 0,67 | 3,63 |
| Rio Branco | 0,59 | 0,78 | 0,61 | 3,74 |
| Brasil | 100,00 | 0,54 | 1,22 | 4,48 |
Para o cálculo do índice do mês, foram comparados os preços coletados no período de 28 de novembro a 27 de dezembro de 2019 (referência) com os preços vigentes no período de 29 de outubro a 27 de novembro de 2019 (base).
O INPC é calculado pelo IBGE desde 1979, se refere às famílias com rendimento monetário de 01 a 05 salários mínimos, sendo o chefe assalariado, e abrange dez regiões metropolitanas do país, além dos municípios de Goiânia, Campo Grande, Rio Branco, São Luís, Aracaju e Brasília.
Em 2019, IPCA teve alta acumulada de 4,31%
O IPCA fechou 2019 com variação de 4,31%, 0,56 p.p. acima dos 3,75% de 2018.
| IPCA - Mês, trimestre e ano | |||
|---|---|---|---|
| Mês | Variação (%) | ||
| Mês | Trimestre | Ano | |
| Janeiro | 0,32 | 0,32 | |
| Fevereiro | 0,43 | 0,75 | |
| Março | 0,75 | 1,51 | 1,51 |
| Abril | 0,57 | 2,09 | |
| Maio | 0,13 | 2,22 | |
| Junho | 0,01 | 0,71 | 2,23 |
| Julho | 0,19 | 2,42 | |
| Agosto | 0,11 | 2,54 | |
| Setembro | -0,04 | 0,26 | 2,49 |
| Outubro | 0,10 | 2,60 | |
| Novembro | 0,51 | 3,12 | |
| Dezembro | 1,15 | 1,77 | 4,31 |
O resultado de 2019 foi influenciado, principalmente, pelo grupo Alimentação e bebidas, que apresentou alta de 6,37% e impacto de 1,57 p.p. no acumulado do ano. A seguir, vieram os Transportes (3,57%) e Saúde e cuidados pessoais (5,41%), com impactos de 0,66 p.p. e 0,65 p.p., respectivamente. O único grupo a apresentar variação (-0,36%) e impacto (-0,01 p.p.) negativos foi Artigos de residência. A tabela a seguir mostra o resultado de todos os grupos de produtos e serviços.
| IPCA - Variação acumulada e impacto por grupos - 2019 e 2018 | ||||
|---|---|---|---|---|
| Grupo | Variação (%) | Impacto (p.p.) | ||
| 2018 | 2019 | 2018 | 2019 | |
| Índice Geral | 3,75 | 4,31 | 3,75 | 4,31 |
| Alimentação e Bebidas | 4,04 | 6,37 | 0,99 | 1,57 |
| Habitação | 4,72 | 3,90 | 0,74 | 0,62 |
| Artigos de Residência | 3,74 | -0,36 | 0,15 | -0,01 |
| Vestuário | 0,61 | 0,74 | 0,04 | 0,04 |
| Transportes | 4,19 | 3,57 | 0,76 | 0,66 |
| Saúde e Cuidados Pessoais | 3,95 | 5,41 | 0,48 | 0,65 |
| Despesas Pessoais | 2,98 | 4,67 | 0,33 | 0,51 |
| Educação | 5,32 | 4,75 | 0,26 | 0,23 |
| Comunicação | -0,09 | 1,07 | 0,00 | 0,04 |
| Fonte: IBGE, Diretoria de Pesquisas, Coordenação de Índices de Preços | ||||
No grupo Alimentação e bebidas (6,37%), houve aceleração dos preços nos três primeiros meses do ano (0,90% em janeiro, 0,78% em fevereiro e 1,37% em março) e, novamente, nos dois últimos meses de 2019 (0,72% em novembro e 3,38% em dezembro). Mas os fatores que levaram a essa aceleração são distintos.
No começo do ano, os aumentos mais intensos foram nos preços de alguns cereais, como o feijão-carioca, que acumulou alta de 105,00% no primeiro trimestre; já em novembro e dezembro, o destaque ficou com as carnes, cuja variação acumulada no ano foi de 32,40%, com a maior parte do aumento nos preços concentrada no último bimestre (27,61%).
| IPCA - Alimentação - Principais altas em 2019 | |||
|---|---|---|---|
| Item | 2018 | 2019 | |
| Variação (%) | Variação (%) | Impacto (p.p.) | |
| Carnes | 2,25 | 32,40 | 0,86 |
| Refeição fora | 2,38 | 3,14 | 0,16 |
| Lanche fora | 4,35 | 6,04 | 0,13 |
| Feijão-carioca | 4,55 | 55,99 | 0,09 |
| Frutas | 14,10 | 7,25 | 0,07 |
| Frango inteiro | 4,08 | 12,21 | 0,06 |
| Frango em pedaços | 6,44 | 15,26 | 0,06 |
| Leite longa vida | 8,43 | 6,05 | 0,05 |
| Carnes industrializadas | 0,35 | 5,24 | 0,04 |
| Ovos | -4,03 | 14,73 | 0,03 |
| Alho | -10,81 | 33,50 | 0,03 |
| Óleo de soja | -0,51 | 8,81 | 0,02 |
| Fonte: IBGE, Diretoria de Pesquisas, Coordenação de Índices de Preços | |||
Alguns itens, por outro lado, apresentaram queda de preços no acumulado do ano:
| IPCA - Alimentação - Principais quedas em 2019 | |||
|---|---|---|---|
| Item | 2018 | 2019 | |
| Variação (%) | Variação (%) | Impacto (p.p.) | |
| Tomate | 71,76 | -30,45 | -0,10 |
| Café moído | -8,22 | -7,39 | -0,03 |
| Farinha de mandioca | -13,26 | -12,17 | -0,02 |
| Cebola | 36,71 | -9,22 | -0,01 |
| Chocolate em barra e bombom | -1,49 | -7,46 | -0,01 |
| Leite em pó | 4,10 | -3,50 | -0,01 |
| Cenoura | 12,59 | -14,01 | -0,01 |
| Queijo | 4,17 | -1,25 | -0,01 |
| Fonte: IBGE, Diretoria de Pesquisas, Coordenação de Índices de Preços | |||
Nos Transportes (3,57%), as maiores contribuições vieram do ônibus urbano (6,64%) e da gasolina (4,03%), ambos com 0,18 p.p. Todas as áreas tiveram alta desse combustível, que foram desde 1,74% de Rio Branco até 8,58% em São Luís.
Em Saúde e cuidados pessoais (5,41%), o destaque ficou, mais uma vez, com o item plano de saúde (8,24%), que contribuiu com 0,34 p.p. no resultado do ano. A Agência Nacional de Saúde Suplementar (ANS) autorizou, em 2019, um reajuste de até 7,35% nas mensalidades dos planos de saúde individuais.
No grupo Habitação (3,90%), o maior impacto (0,19 p.p.) veio da energia elétrica, que acumulou alta de 5,00% em 2019, embora tenha recuado em quatro meses do ano.
As oscilações se deram principalmente devido à mudança de bandeira tarifária. Desde novembro, vigoram novos valores das bandeiras amarela (R$ 1,343), vermelha patamar 1 (R$ 4,169) e vermelha patamar 2 (R$ 6,243), a cada 100 quilowatts-hora consumidos.
| IPCA - Energia elétrica - bandeiras tarifárias mês a mês | |||
|---|---|---|---|
| Mês | Variação Mensal | Bandeira tarifária | Cobrança adicional a cada 100 kwh consumido |
| Janeiro | -0,13% | Verde | - |
| Fevereiro | 1,14% | Verde | - |
| Março | 0,04% | Verde | - |
| Abril | 0,10% | Verde | - |
| Maio | 2,18% | Amarela | R$ 1,50 |
| Junho | -1,11% | Verde | - |
| Julho | 4,48% | Amarela | R$ 1,50 |
| Agosto | 3,85% | Vermelha 1 | R$ 4,00 |
| Setembro | 0,00% | Vermelha 1 | R$ 4,00 |
| Outubro | -3,22% | Amarela | R$ 1,50 |
| Novembro | 2,15% | Vermelha 1 | R$ 4,169 |
| Dezembro | -4,24% | Amarela | R$ 1,343 |
| Fonte: IBGE, Diretoria de Pesquisas, Coordenação de Índices de Preços | |||
A variação negativa de Artigos de residência (-0,36%) em 2019 ocorreu em função da queda nos preços dos itens de tv, som e informática (-4,41%) e mobiliário (-1,21%).
Nos demais grupos, destacam-se: a alta das joias (11,66%) em Vestuário (0,74%); dos jogos de azar (40,36%) em Despesas pessoais (4,67%); cursos regulares (4,97%) em Educação (4,75%) e dos planos de telefone celular (1,89%) em Comunicação (1,07%).
Regionalmente, Belém (5,51%) teve a maior alta, influenciada pela alta no preço das carnes (35,11%), que contribuíram com 1,78 p.p. no resultado da área. A menor taxa ficou com a região metropolitana de Vitória (3,29%), com a queda da energia elétrica (-6,09%), a maior para esse subitem entre as áreas pesquisadas.
| IPCA - Regiões - 2019 e 2018 | |||
|---|---|---|---|
| Região | Peso Regional (%) | Variação anual (%) | |
| 2018 | 2019 | ||
| Belém | 6,12 | 3,00 | 5,51 |
| Fortaleza | 10,86 | 2,90 | 5,01 |
| Campo Grande | 8,40 | 2,98 | 4,65 |
| São Paulo | 4,20 | 3,68 | 4,60 |
| Goiânia | 30,67 | 3,14 | 4,37 |
| São Luís | 3,59 | 2,65 | 4,28 |
| Belo Horizonte | 1,87 | 4,00 | 4,20 |
| Aracaju | 2,80 | 2,64 | 4,11 |
| Porto Alegre | 4,23 | 4,62 | 4,08 |
| Rio de Janeiro | 0,42 | 4,30 | 4,05 |
| Curitiba | 12,06 | 3,38 | 3,99 |
| Salvador | 1,78 | 4,04 | 3,93 |
| Rio Branco | 1,51 | 3,44 | 3,82 |
| Brasília | 0,79 | 3,06 | 3,76 |
| Recife | 2,91 | 2,84 | 3,71 |
| Vitória | 7,79 | 4,19 | 3,29 |
| Brasil | 100,00 | 3,75 | 4,31 |
| Fonte: IBGE, Diretoria de Pesquisas, Coordenação de Índices de Preços | |||
INPC acumula alta de 4,48% em 2019
O INPC encerrou 2019 com variação acumulada de 4,48%, acima dos 3,43% de 2018 em 1,05 p.p. Os alimentícios subiram 6,84%, e os não alimentícios, 3,48%. Em 2018, o grupo Alimentação e bebidas havia tido alta de 3,82% e, os não alimentícios, de 3,25%.
| INPC - Variação acumulada e impacto por grupos - 2019 e 2018 | ||||
|---|---|---|---|---|
| Grupo | Variação (%) | Impacto (p.p.) | ||
| 2018 | 2019 | 2018 | 2019 | |
| Índice Geral | 3,43 | 4,48 | 3,43 | 4,48 |
| Alimentação e Bebidas | 3,82 | 6,84 | 1,15 | 2,07 |
| Habitação | 4,48 | 3,86 | 0,82 | 0,71 |
| Artigos de Residência | 3,36 | -0,60 | 0,16 | -0,03 |
| Vestuário | 0,64 | 0,51 | 0,05 | 0,04 |
| Transportes | 4,50 | 4,38 | 0,71 | 0,70 |
| Saúde e Cuidados Pessoais | 1,97 | 4,90 | 0,19 | 0,49 |
| Despesas Pessoais | 2,54 | 4,56 | 0,19 | 0,34 |
| Educação | 5,34 | 4,63 | 0,17 | 0,14 |
| Comunicação | -0,40 | 0,69 | -0,01 | 0,02 |
| Fonte: IBGE, Diretoria de Pesquisas, Coordenação de Índices de Preços | ||||
Quanto aos índices regionais, o maior foi o da região metropolitana de Belém (5,76%), onde as carnes subiram 34,73% e contribuíram com 2,07 p.p. no resultado geral da área. Já o menor índice foi registrado em Brasília (3,52%), em decorrência das quedas observadas nos preços do tomate (-34,28%) e do item energia elétrica (-2,79%). A seguir, são apresentados os índices acumulados por região pesquisada.
| INPC - Regiões - 2019 e 2018 | |||
|---|---|---|---|
| Região | Peso Regional (%) | Variação anual (%) | |
| 2018 | 2019 | ||
| Belém | 6,44 | 2,59 | 5,76 |
| Fortaleza | 5,42 | 2,69 | 4,96 |
| Goiânia | 4,15 | 2,88 | 4,90 |
| São Paulo | 24,24 | 3,54 | 4,89 |
| Campo Grande | 1,64 | 2,57 | 4,76 |
| São Luís* | 3,11 | 2,37 | 4,45 |
| Belo Horizonte | 10,60 | 3,63 | 4,45 |
| Curitiba | 7,29 | 3,33 | 4,31 |
| Aracaju* | 1,29 | 2,32 | 4,13 |
| Porto Alegre | 7,38 | 4,56 | 4,11 |
| Rio de Janeiro | 9,51 | 4,17 | 4,07 |
| Salvador | 8,75 | 3,70 | 3,85 |
| Rio Branco* | 0,59 | 3,73 | 3,74 |
| Vitória | 1,83 | 3,96 | 3,63 |
| Recife | 5,88 | 2,30 | 3,59 |
| Brasília | 1,88 | 2,24 | 3,52 |
| Brasil | 100,00 | 3,43 | 4,48 |
| Fonte: IBGE, Diretoria de Pesquisas, Coordenação de Índices de Preços | |||
Inflação fecha 2019 em 4,31% e ultrapassa centro da meta. Preços de alimentos e bebidas pesaram no bolso da população no ano passado
A inflação oficial, medida pelo Índice Nacional de Preços ao Consumidor Amplo (IPCA), fechou o ano de 2019 em 4,31%, divulgou hoje (10) o IBGE. A taxa ficou acima do centro meta de 4,25%, mas dentro do limite de variação de 1,5 ponto percentual para cima ou para baixo, definido pelo Conselho Monetário Nacional (CMN). Ou seja, a inflação poderia ficar entre 2,75% e 5,75%. Em 2018, o IPCA foi 3,75%.
Os preços do grupo alimentos e bebidas pesaram no bolso dos brasileiros no ano passado. A alta de 6,37% foi puxada, sobretudo, pelas carnes, cujos preços dispararam no mercado interno devido ao aumento das exportações para a China e à desvalorização do real.
“O destaque ficou com as carnes, cuja variação acumulada no ano foi de 32,40%, com a maior parte do aumento nos preços concentrada no último bimestre (27,61%). Pesou também a alta nos planos de saúde (8,24%), por conta do reajuste autorizado pela Agência Nacional de Saúde Suplementar (ANS). A alimentação fora do domicílio também influenciou o índice, em função do aumento das carnes”, disse o gerente do IPCA, Pedro Kislanov.
Dos nove grupos de despesa pesquisados, apenas artigos de residência tiveram deflação (-0,36%) em 2019. Os demais grupos apresentaram os seguintes índices de inflação: alimentação e bebidas (6,37%), habitação (3,9%), vestuário (0,74%), transportes (3,57%), saúde e cuidados pessoais (5,41%), despesas pessoais (4,67%), educação (4,75%) e comunicação (1,07%).
IPCA - Variação acumulada no ano (%)
Clique e arraste para zoom
Fonte: IBGE - Índice Nacional de Preços ao Consumidor Amplo
Já entre as regiões metropolitanas e capitais pesquisadas pelo IBGE, Belém acumulou maior inflação em 2019 (5,51%), também por conta da alta no preço das carnes. A região metropolitana da capital do Pará foi seguida por Fortaleza (5,01%), Campo Grande (4,65%), São Paulo (4,60%) e Goiânia (4,37%), todas acima da média nacional.
A menor taxa de inflação foi observada em Vitória (3,29%), influenciada pela queda na energia elétrica. Os outros menores índices foram registrados no Recife (3,71%), em Brasília (3,76%), Rio Branco (3,82%) e Salvador (3,93%).
Em dezembro, inflação foi a maior desde 2002
Os preços das carnes também puxaram a alta do IPCA em dezembro, que ficou em 1,15%, acima dos 0,51% registrados em novembro. Segundo Kislanov, foi o maior resultado para o mês de dezembro desde 2002, quando a inflação foi 2,10%.
“Outras altas foram observadas no mês, com destaque para os combustíveis (3,57%) e as passagens áreas, que subiram de 4,35% em novembro para 15,62% em dezembro. Os jogos de azar (12,88%) também impactaram a inflação de dezembro, em função do reajuste nos preços das apostas, vigente desde novembro”, disse o gerente do IPCA.
Calculado pelo IBGE desde 1980, o IPCA abrange famílias com rendimento de um a 40 salários mínimos, que vivem nas regiões metropolitanas de Belém, Fortaleza, Recife, Salvador, Belo Horizonte, Vitória, Rio de Janeiro, São Paulo, Curitiba, Porto Alegre, além do Distrito Federal e dos municípios de Goiânia e Campo Grande. O índice completou 40 anos este mês.
IPCA - Variação mensal (%)
Clique e arraste para zoom
Fonte: IBGE - Índice Nacional de Preços ao Consumidor Amplo
INPC fica acima do IPCA
O IBGE também divulgou hoje (10) que o Índice Nacional de Preços ao Consumidor (INPC), usado como referência para os reajustes salariais, encerrou 2019 com alta de 4,48%, acima dos 3,43% de 2018. Em dezembro, o índice, calculado com base no rendimento das famílias que ganham de um a cinco salários mínimos, variou 1,22%. Foi o maior resultado para o mês desde 2002, quando registrou 2,70%.
DOCUMENTO: https://agenciadenoticias.ibge.gov.br/agencia-sala-de-imprensa/2013-agencia-de-noticias/releases/26619-em-dezembro-ipca-foi-de-1-15-e-acumulou-alta-de-4-31-em-2019
FGV. IBRE. 10/01/20. Índices Gerais de Preços. IPC-3i. IPC-3i avança no quarto trimestre de 2019
O Índice de Preços ao Consumidor da Terceira Idade (IPC-3i), que mede a variação da cesta de consumo de famílias majoritariamente compostas por indivíduos com mais de 60 anos de idade, registrou no quarto trimestre de 2019, variação de 1,19%. Em 12 meses, o IPC-3i acumula alta de 4,18%. Com este resultado, a variação do indicador ficou acima da taxa acumulada pelo IPC-BR, que foi de 4,11%, no mesmo período.
Na passagem do terceiro trimestre de 2019 para o quarto trimestre de 2019, a taxa do IPC-3i registrou acréscimo de 0,71 ponto percentual, passando de 0,48% para 1,19%. Cinco das oito classes de despesa componentes do índice registraram acréscimo em suas taxas de variação. A principal contribuição partiu do grupo Alimentação, cuja taxa passou de -1,76% para 3,11%. O item que mais influenciou o comportamento desta classe de despesa foi carnes bovinas, que variou de 26,03 no quarto trimestre, ante 1,89%, no anterior.
Contribuíram também para o acréscimo da taxa do IPC-3i os grupos: Transportes (-0,37% para 2,47%), Despesas Diversas (0,34% para 6,73%), Educação, Leitura e Recreação (-0,34% para 1,29%) e Vestuário (-0,59% para 0,80%). Nestas classes de despesa, vale destacar o comportamento dos itens: gasolina (-2,58% para 5,69%), jogo lotérico (0,00% para 39,04%), passagem aérea (-10,75% para 11,93%) e roupas (-0,74% para 1,07%).
Em contrapartida, os grupos Habitação (2,14% para -0,66%), Comunicação (1,07% para 0,11%) e Saúde e Cuidados Pessoais (1,01% para 0,89%) apresentaram recuo em suas taxas de variação. Nestas classes de despesa, vale citar os itens: tarifa de eletricidade residencial (9,49% para -6,05%), tarifa de telefone residencial (1,73% para 0,05%) e medicamentos em geral (0,33% para -0,42%).
DOCUMENTO: https://portalibre.fgv.br/navegacao-superior/noticias/ipc-3i-avanca-no-quarto-trimestre-de-2019.htm
FGV. IBRE. 10/01/20. Índices Gerais de Preços. IGP-M Primeiro Decêndio. IGP-M varia 0,67% na 1ª prévia de janeiro
O Índice Geral de Preços - Mercado (IGP-M) variou 0,67% no primeiro decêndio de janeiro de 2020. No primeiro decêndio de dezembro, a taxa havia sido de 1,83%.
O Índice de Preços ao Produtor Amplo (IPA) variou 0,86% no primeiro decêndio de janeiro. No mesmo período do mês de dezembro, o índice havia subido 2,57%. Na análise por estágios de processamento, os preços dos Bens Finais subiram com menor intensidade, passando de 3,04% em dezembro para 1,59% em janeiro. A principal contribuição para este movimento partiu do subgrupo alimentos processados, cuja taxa passou de 6,49% para 4,08%. O índice correspondente aos Bens Intermediários passou de 0,27% no primeiro decêndio de dezembro para 1,04% no primeiro decêndio de janeiro. Esta alta foi influenciada pelo subgrupo combustíveis e lubrificantes para a produção, cuja taxa passou de 0,35% para 4,67%.
A taxa do índice referente as Matérias-Primas Brutas passou de 4,64% no primeiro decêndio de dezembro para -0,13% no primeiro decêndio de janeiro. Contribuíram para o recuo da taxa do grupo os seguintes itens: bovinos (21,23% para -5,63%), minério de ferro (3,91% para -0,51%) e soja (em grão) (2,68% para -1,00%). Em sentido oposto, vale citar cana-de-açúcar (-0,25% para 1,75%), aves (0,15% para 1,72%) e laranja (-3,49% para -0,99%).
O Índice de Preços ao Consumidor (IPC) variou 0,33% no primeiro decêndio de janeiro, após alta de 0,59% no mês anterior. Cinco das oito classes de despesa componentes do índice registraram decréscimo em suas taxas de variação, com destaque para o grupo Educação, Leitura e Recreação (0,67% para -0,94%). Nesta classe de despesa, vale mencionar o comportamento do item passagem aérea cuja taxa passou de 14,47% para -9,58%.
Também foram computados decréscimos nas taxas de variação dos grupos Alimentação (1,24% para 1,03%), Despesas Diversas (2,92% para 0,08%), Habitação (0,06% para -0,29%) e Comunicação (0,34% para 0,13%). Nestas classes de despesa, as maiores influências observadas partiram dos seguintes itens: carnes bovinas (10,35% para 3,29%), jogo lotérico (23,33% para 0,00%), tarifa de eletricidade residencial (0,29% para -1,69%) e mensalidade para internet (0,58% para 0,00%).
Em contrapartida, os grupos Transportes (0,42% para 1,12%), Saúde e Cuidados Pessoais (0,16% para 0,31%) e Vestuário (0,23% para 0,46%) apresentaram acréscimo em suas taxas de variação. Nesta classe de despesa, vale mencionar o comportamento dos itens: gasolina (1,30% para 3,29%), artigos de higiene e cuidado pessoal (-0,23% para 0,27%) e roupas (0,01% para 0,51%).
O Índice Nacional de Custo da Construção (INCC) subiu 0,20% no primeiro decêndio de janeiro, taxa superior a apurada no mês anterior, quando o índice havia caído 0,12%. Os três componentes do INCC registraram as seguintes taxas da variação na passagem do primeiro decêndio de dezembro para o primeiro decêndio de janeiro: Materiais e Equipamentos (-0,35% para 0,01%), Serviços (0,06% para 0,12%) e Mão de Obra (0,00% para 0,35%).
DOCUMENTO: https://portalibre.fgv.br/navegacao-superior/noticias/igp-m-varia-0-67-na-1-previa-de-janeiro.htm
CNI. 10/01/2020. Preços de bens e serviços controlados subiram mais do que a inflação nos últimos 20 anos. Estudo da CNI mostra que, no mesmo período, diminuíram os valores de produtos expostos à concorrência e que passaram por inovações tecnológicas. Preços de micromputadores caíram 66% e televisões, 57%
Os preços de produtos e serviços controlados, administrados ou considerados essenciais, como energia, transporte, educação, remédios, médicos, hospitais e combustíveis subiram muito mais do que a inflação nos últimos 20 anos. No mesmo período, os preços dos produtos expostos à concorrência e que passaram por inovações, como televisores e microcomputadores, tiveram fortes quedas. As informações estão na Nota Econômica 14, da Confederação Nacional da Indústria (CNI), que analisa a inflação brasileira nos últimos 20 anos, com base na evolução dos componentes do Índice de Preços ao Consumidor Amplo (IPCA).
“A intervenção estatal sobre os preços não foi capaz de controlar a inflação de bens ou serviços essenciais ao consumidor”, analisa a CNI. “Isso gerou grandes distorções em termos de distribuição de renda, dado que a parcela mais pobre da população aloca a totalidade de sua renda para os bens essenciais”, completa a Nota Econômica.
“Os dados confirmam que o mercado regula melhor os preços do que a intervenção do governo”, destaca o gerente-executivo de Política Econômica da CNI, Flávio Castelo Branco.
Conforme o estudo, de agosto de 1999 a março de 2019, a inflação subiu 240%. Neste período, a cesta de serviços médicos e hospitalares foi a que mais subiu e acumulou um aumento de 374%. Em seguida, com alta de 358%, aparece a energia elétrica e, em terceiro lugar, com aumento de 352%, o transporte público. A educação formal, com alta de 340%, ficou em quarto lugar.

SEM COMPETIÇÃO - “O processo de precificação desses bens e serviços ocorre em um contexto de falha de mercado, em que a relação entre a oferta e a demanda não se reflete inteiramente na formação de preços”, avalia a Nota Econômica. “São mercados fortemente controlados, seja por intervenções nos preços, ou por controle sobre a qualidade e o tipo de serviço prestado (serviços médicos e educação, principalmente), gerando um ambiente de competição imperfeita”, diz o estudo da CNI.
Enquanto isso, os valores dos televisores tiveram uma queda de 57% e os dos microcomputadores diminuíram 66% nos últimos 20 anos. “Os bens manufaturados que passaram por processo de inovação tecnológica, que geraram ganhos de eficiência produtiva e são expostos ao comércio internacional e competição de mercado, apresentantam forte queda de preço real e, em alguns casos, nominal”, afirma o estudo.
Outros produtos industrializados, como os celulares, que subiram 132%, e os automóveis, cuja alta foi de 44% nos últimos 20 anos, tiveram aumentos inferiores à inflação do período. Na avaliação da CNI, a perda de valor dos produtos industrializados reduziu a receita da indústria brasileira, pois os preços de alguns insumos, como energia, transporte público e combustíveis, subiram muito mais que a inflação, elevando os custos de produção.
CONSTRUÇÃO CIVIL
IBGE. 10/01/2020. Índice Nacional da Construção Civil varia 0,22% em dezembro e fecha 2019 em 4,03%
O Índice Nacional da Construção Civil (Sinapi) teve variação de 0,22% em dezembro, ficando com a mesma taxa verificada em dezembro de 2018 e 0,11 ponto percentual (p.p.) acima da taxa de novembro (0,11%). Assim, o índice fechou 2019 em 4,03%, ficando 0,38 ponto percentual abaixo da taxa de 2018 (4,41%). Em dezembro de 2018, o índice havia sido 4,41%.
O custo nacional da construção, por metro quadrado, que em novembro ficou em R$ 1156,31, passou para R$ 1158,81, sendo R$ 605,54 relativos aos materiais e R$ 553,17 à mão de obra.
A parcela dos materiais apresentou queda de 0,13%, com uma diferença de 0,30 ponto percentual em relação ao mês anterior (0,17%). Quando comparado com dezembro de 2018, com variação de 0,45%, a taxa mostrou queda de 0,58 ponto percentual.
Já o valor da mão de obra apresentou alta (0,59%), influenciado pelas altas observadas nos estados do Piauí e Minas Gerais, decorrentes de acordos coletivos. Esta taxa mostrou-se bem acima ao ser comparada com o resultado de dezembro de 2018 (-0,02%), quando se mostrou próxima da estabilidade.
O resultado acumulado no ano de 2019 registrou alta de 4,54% nos materiais, enquanto a parcela do custo referente aos gastos com mão de obra atingiu 3,47%. Em 2018, a parcela dos materiais fechou em 6,30% e a mão de obra, em 2,45%.
Sudeste tem a maior variação mensal e Sul tem a maior alta no acumulado do ano
A elevação na parcela da mão de obra de Minas Gerais, decorrente de acordo coletivo, levou o Sudeste a apresentar a maior variação regional em dezembro: 0,31%. Mas as regiões Nordeste (0,20%), Centro-Oeste (0,19%), Norte (0,17%) e Sul (0,02%) também tiveram altas. No acumulado do ano, o Sul registrou a maior taxa (5,64%), seguido pelo Sudeste (4,39%). Quanto aos custos da construção, os valores, em dezembro, por metro quadrado, foram: R$ 1169,45 (Norte); R$ 1067,68 (Nordeste); R$ 1208,86 (Sudeste); R$ 1222,66 (Sul) e R$ 1165,74 (Centro-Oeste). Entre os estados, o Piauí ficou com a maior taxa para o último mês do ano, 1,11%, influenciada pela alta de 3,86% da parcela da mão de obra, também decorrente de acordo coletivo das categorias profissionais.
Sinapi - Dezembro/2019 COM desoneração da folha de pagamento de empresas do setor
| ÁREAS GEOGRÁFICAS | CUSTOS MÉDIOS | NÚMEROS ÍNDICES | VARIAÇÕES PERCENTUAIS | ||
|---|---|---|---|---|---|
| R$/m2 | JUN/94=100 | MENSAL | NO ANO | 12 MESES | |
| BRASIL | 1158,81 | 579,96 | 0,22 | 4,03 | 4,03 |
| REGIÃO NORTE | 1169,45 | 582,72 | 0,17 | 4,22 | 4,22 |
| Rondônia | 1221,65 | 681,17 | 0,11 | 5,80 | 5,80 |
| Acre | 1287,76 | 683,51 | 0,58 | 4,37 | 4,37 |
| Amazonas | 1145,08 | 560,69 | 0,30 | 5,61 | 5,61 |
| Roraima | 1224,35 | 508,46 | 0,29 | 4,26 | 4,26 |
| Pará | 1155,05 | 553,68 | 0,06 | 3,77 | 3,77 |
| Amapá | 1132,01 | 549,91 | 0,20 | 3,99 | 3,99 |
| Tocantins | 1176,24 | 618,38 | 0,03 | 1,27 | 1,27 |
| REGIÃO NORDESTE | 1067,68 | 576,73 | 0,20 | 2,92 | 2,92 |
| Maranhão | 1115,34 | 587,57 | 0,08 | 4,47 | 4,47 |
| Piauí | 1101,61 | 732,09 | 1,11 | 4,41 | 4,41 |
| Ceará | 1066,04 | 615,76 | 0,40 | 2,96 | 2,96 |
| Rio Grande do Norte | 1040,49 | 524,49 | 0,07 | 1,54 | 1,54 |
| Paraíba | 1101,57 | 609,26 | 0,33 | 1,53 | 1,53 |
| Pernambuco | 1035,54 | 553,72 | 0,03 | 2,17 | 2,17 |
| Alagoas | 1044,39 | 521,85 | 0,06 | 2,17 | 2,17 |
| Sergipe | 987,88 | 524,95 | 0,29 | 1,91 | 1,91 |
| Bahia | 1067,63 | 565,16 | 0,10 | 3,18 | 3,18 |
| REGIÃO SUDESTE | 1208,86 | 578,84 | 0,31 | 4,39 | 4,39 |
| Minas Gerais | 1111,84 | 611,83 | 0,68 | 6,73 | 6,73 |
| Espírito Santo | 1051,20 | 583,07 | 0,24 | 3,75 | 3,75 |
| Rio de Janeiro | 1288,96 | 587,39 | 0,07 | 5,22 | 5,22 |
| São Paulo | 1247,81 | 563,67 | 0,22 | 2,86 | 2,86 |
| REGIÃO SUL | 1222,66 | 584,71 | 0,02 | 5,64 | 5,64 |
| Paraná | 1190,38 | 569,23 | 0,04 | 5,17 | 5,17 |
| Santa Catarina | 1331,05 | 720,99 | 0,01 | 6,66 | 6,66 |
| Rio Grande do Sul | 1172,42 | 532,13 | 0,00 | 5,33 | 5,33 |
| REGIÃO CENTRO-OESTE | 1165,74 | 595,12 | 0,19 | 3,68 | 3,68 |
| Mato Grosso do Sul | 1117,72 | 525,69 | 0,22 | 2,31 | 2,31 |
| Mato Grosso | 1147,49 | 654,64 | 0,02 | 1,88 | 1,88 |
| Goiás | 1160,53 | 613,10 | 0,28 | 5,83 | 5,83 |
| Distrito Federal | 1230,36 | 543,39 | 0,26 | 4,09 | 4,09 |
| Fonte: IBGE, Diretoria de Pesquisas, Coordenação de Índices de Preços. | |||||
Sinapi - Dezembro/2019 SEM a desoneração da folha de pagamento de empresas do setor
| ÁREAS GEOGRÁFICAS | CUSTOS MÉDIOS | NÚMEROS ÍNDICES | VARIAÇÕES PERCENTUAIS | ||
|---|---|---|---|---|---|
| R$/m2 | JUN/94=100 | MENSAL | NO ANO | 12 MESES | |
| BRASIL | 1243,83 | 622,22 | 0,24 | 4,00 | 4,00 |
| REGIÃO NORTE | 1249,01 | 622,47 | 0,16 | 4,21 | 4,21 |
| Rondônia | 1305,44 | 727,86 | 0,07 | 6,00 | 6,00 |
| Acre | 1375,76 | 730,20 | 0,54 | 4,40 | 4,40 |
| Amazonas | 1223,79 | 599,41 | 0,28 | 5,53 | 5,53 |
| Roraima | 1315,54 | 546,25 | 0,27 | 4,09 | 4,09 |
| Pará | 1232,41 | 590,50 | 0,05 | 3,74 | 3,74 |
| Amapá | 1208,02 | 586,66 | 0,18 | 4,04 | 4,04 |
| Tocantins | 1256,06 | 660,63 | 0,00 | 1,23 | 1,23 |
| REGIÃO NORDESTE | 1141,86 | 616,84 | 0,21 | 2,99 | 2,99 |
| Maranhão | 1190,63 | 627,41 | 0,07 | 4,40 | 4,40 |
| Piauí | 1176,77 | 781,81 | 1,28 | 4,61 | 4,61 |
| Ceará | 1137,46 | 656,49 | 0,37 | 3,13 | 3,13 |
| Rio Grande do Norte | 1110,51 | 559,61 | 0,07 | 1,43 | 1,43 |
| Paraíba | 1174,93 | 649,73 | 0,36 | 1,49 | 1,49 |
| Pernambuco | 1108,62 | 592,60 | 0,03 | 2,22 | 2,22 |
| Alagoas | 1116,92 | 558,12 | 0,06 | 2,33 | 2,33 |
| Sergipe | 1057,59 | 562,10 | 0,27 | 2,01 | 2,01 |
| Bahia | 1145,15 | 605,69 | 0,09 | 3,17 | 3,17 |
| REGIÃO SUDESTE | 1302,06 | 622,97 | 0,37 | 4,22 | 4,22 |
| Minas Gerais | 1193,08 | 656,28 | 0,83 | 6,73 | 6,73 |
| Espírito Santo | 1129,09 | 626,34 | 0,22 | 3,83 | 3,83 |
| Rio de Janeiro | 1391,14 | 634,34 | 0,07 | 5,03 | 5,03 |
| São Paulo | 1345,84 | 607,86 | 0,25 | 2,65 | 2,65 |
| REGIÃO SUL | 1317,60 | 630,02 | 0,01 | 5,63 | 5,63 |
| Paraná | 1285,93 | 614,95 | 0,01 | 5,10 | 5,10 |
| Santa Catarina | 1438,20 | 779,03 | 0,01 | 6,61 | 6,61 |
| Rio Grande do Sul | 1254,53 | 569,47 | 0,00 | 5,44 | 5,44 |
| REGIÃO CENTRO-OESTE | 1245,82 | 635,96 | 0,18 | 3,69 | 3,69 |
| Mato Grosso do Sul | 1196,78 | 562,37 | 0,23 | 2,52 | 2,52 |
| Mato Grosso | 1226,80 | 699,79 | 0,02 | 1,68 | 1,68 |
| Goiás | 1239,63 | 654,29 | 0,26 | 5,90 | 5,90 |
| Distrito Federal | 1313,57 | 580,16 | 0,24 | 4,18 | 4,18 |
| Fonte: IBGE, Diretoria de Pesquisas, Coordenação de Índices de Preços. | |||||
Custos na construção civil encerram ano com alta de 4,03%. Custos no setor da construção civil cresceram 4,03% em 2019, resultado menor que no ano anterior
O Índice Nacional da Construção Civil (Sinapi), divulgado hoje (10) pelo IBGE, fechou 2019 com alta de 4,03%, ficando 0,38 ponto percentual abaixo da taxa de 2018, que havia sido de 4,41%. Esse indicador mede o custo nacional para o setor habitacional por metro quadrado, que passou para R$ 1.158,81, sendo R$ 605,54 relativos aos materiais e R$ 553,17 à mão de obra. No mês, em relação a novembro, a variação foi de 0,22%, a mesma registrada em dezembro de 2018.
Os materiais tiveram queda de preço (-0,13%) em relação ao mês anterior. Mas, no acumulado do ano de 2019, registraram alta, de 4,54%.
Já o valor da mão de obra teve alta em dezembro, de 0,59%. “Esse resultado foi influenciado por acordos coletivos de trabalho, que geraram elevações de custos nos estados do Piauí e Minas Gerais. Inclusive, essa taxa ficou bastante alta se comparada ao resultado de dezembro de 2018 (-0,02%)”, explica o pesquisador do IBGE, Augusto Oliveira, ressaltando, no entanto, que, no acumulado do ano, a alta foi menos elevada que a dos materiais (3,47%).
Todas as regiões tiveram altas em dezembro, sendo que o Sudeste foi onde o índice mais se elevou: 0,31%. Nas demais regiões, as taxas foram de 0,20% no Nordeste, 0,19% no Centro-Oeste, 0,17% no Norte e 0,02% no Sul. No acumulado do ano, porém, o Sul registrou a maior taxa (5,64%), seguido pelo Sudeste (4,39%). Entre os estados, o Piauí ficou com a maior taxa para o último mês do ano, 1,11%, influenciada pela alta de 3,86% nos custos da mão de obra.
Quanto aos custos da construção por região, os valores, em dezembro, por metro quadrado foram de R$ 1169,45 no Norte, R$ 1067,68 no Nordeste, R$ 1208,86 no Sudeste, R$ 1222,66 no Sul e R$ 1165,74 no Centro-Oeste.
DOCUMENTO: https://agenciadenoticias.ibge.gov.br/agencia-sala-de-imprensa/2013-agencia-de-noticias/releases/26623-indice-nacional-da-construcao-civil-varia-0-22-em-dezembro-e-fecha-2019-em-4-03
________________
LGCJ.: