US ECONOMICS
EU
U.S. Department of State. 10/01/2019. Secretary Michael R. Pompeo Travels to Italy to Discuss Transatlantic Partnership with Key Ally
Secretary Michael R. Pompeo will travel to Rome and Abruzzo, Italy, October 1-3, where he will meet with Italian President Sergio Mattarella, Prime Minister Giuseppe Conte, and Foreign Minister Luigi Di Maio to discuss the importance of Transatlantic unity and our strong and enduring bilateral relationship. The Secretary will also travel to his ancestral home in the Abruzzo region to meet with local leaders and to underscore the close personal ties between our two nations.
THE UNITED STATES AND ITALY ARE CLOSE PARTNERS AND ALLIES
- The United States looks forward to continuing the excellent cooperation between our two countries with the new Government of Italy, both as NATO Allies and long-standing economic partners.
- Our relationship is deep and enduring. The United States established diplomatic relations with the Kingdom of Italy in 1861 and reaffirmed them in 1946 when Italy became a republic. We have built a strong partnership based on common values and shared historical and familial bonds.
- More than 20 million Americans proudly claim Italian heritage – including the Secretary. Secretary Pompeo is the first Italian-American Secretary of State. His family is from the central, mountainous region of Abruzzo, which he will visit on this trip. Throughout our history, Italian-Americans have enriched the fabric of every aspect of American life.
- Italy and the United States share a commitment to the same values – democracy, freedom, free and fair trade, and the rule of law.
- Italy is a key NATO Ally, a leader and guarantor of security in the international community, and a reliable partner. Italy plays a crucial role in guaranteeing Transatlantic security, particularly in assuring NATO’s southern flank through its presence in Libya and around the world, in Iraq, Kosovo, Lebanon, and Afghanistan.
- Today’s global challenges underscore the importance of increased and sustained defense investment. We must have the capabilities and the readiness to deploy forces in a timely fashion to be prepared for the threats the Alliance faces, including those from the South. Modern capabilities and ready forces present a strong deterrent posture.
- President Trump and Prime Minister Conte announced the U.S.-Italy Strategic Dialogue in July 2018 to address threats to security and stabilization in the Mediterranean region.
- Italy is a welcoming host to U.S. military and civilian personnel and their families at five major military bases in Italy, with more than 50 sub-installations. In total, there are more than 30,000 U.S. troops, DOD civilians, and their family members living in Italy – the second largest number in Europe.
- Italy hosts the headquarters of the U.S. Navy’s 6th Fleet in Naples and NATO’s Joint Force Command Naples, in nearby Lago della Patria.
- The United States represents Italy’s largest non-EU export market, and our two-way trade in goods and services amounted to $99 billion last year. This trade, which ranges from consumer goods to agricultural and defense industry products, has spurred collaboration in fields outside the economic realm, including security and space technology.
- We have robust direct foreign investment in each other’s country. Italian direct investment in the United States totals $38.6 billion, leading to the creation of 78,200 jobs for Americans. U.S. direct investment in Italy totals $38.5 billion, leading to the creation of 223,500 jobs for Italians. U.S. tech giants in Italy are creating well-paying jobs and providing training for Italian workers.
- Italy is the second most popular destination for American study abroad students in the world after the United Kingdom, with more than 35,000 U.S. students studying in Italy each year. Italian students are also increasingly attracted to education exchange programs in the United States. Last year, nearly 6,000 Italians chose to study at a U.S. college or university.
- The U.S.-Italy Fulbright Commission was established in 1948 and celebrated its 70th anniversary in 2018. Since 1948, our two nations have worked together to promote mutual understanding and enhance scholarship through educational exchange.
- Each year, the Fulbright Commission awards grants to approximately 75-80 American and Italian students, scholars, and teaching assistants.
- Since its inception, approximately 14,000 Italian and American students, teachers, lecturers, and researchers have participated in the Fulbright international exchange program.
MACROECONOMICS
FED. October 01, 2019. Speech. Introductory Remarks. Vice Chair Richard H. Clarida. At "Nontraditional Data, Machine Learning, and Natural Language Processing in Macroeconomics," a research conference sponsored by the Federal Reserve Board, Washington, D.C.
Good morning, and welcome to the Federal Reserve Board's research conference "Nontraditional Data, Machine Learning, and Natural Language Processing in Macroeconomics." Here at the Fed, we are continually assessing the current state of the economy, updating our outlook for economic activity, and estimating the risks around that outlook. In this environment, we assess a broad array of government and private-sector data to determine what they imply for the achievement of the Fed's statutory goals of maximum employment and price stability. As a result, this conference and the range of topics on your agenda for today and tomorrow are highly relevant for us. More timely and accurate information sourced from nontraditional data and the use of new techniques should permit Board staff economists to make better estimates of the evolving news and what it implies for the economic outlook and allow policymakers to make better-informed decisions.
Over these next two days, you will hear about the use of new tools and nontraditional data sources and what they say for the assessment of inflation and the labor market; about the use of new methods for forecasting; and about extracting information from text and using textual analysis to evaluate regulatory complexity and understand central bank communications. You no doubt will have many conversations in this room and during breaks about the usefulness of big data and new techniques for macroeconomic analysis. I am pleased to see some former colleagues and important contributors to macroeconomics and measurement on your conference program, such as Erica Groshen; Ron Jarmin; Matthew Shapiro; Hal Varian; and David Wilcox, who recently left the Fed for other pastures.
I would also like to acknowledge the diversity this conference offers. This conference is interdisciplinary, bringing together people from many different fields of study—economists, computer scientists, and statisticians—as well as people from many different types of institutions, including universities, central bank research departments, statistical agencies, and the private sector. We all stand to benefit from work across disciplines, and the connections forged at conferences such as this one can be highly fruitful.
To a large extent, the use of nontraditional data, machine learning, and natural language processing in macroeconomics and for policy is only just in its infancy. In many cases, we are unsure of the efficacy or benefits of these approaches. Coordination between statistical agencies and policymaking institutions will help us achieve our shared goal—a better understanding of the economy. To this end, the discussions on the use of big data and new techniques for central banking and on the possibilities for cooperation between private companies and government agencies should be particularly helpful. Moreover, I strongly encourage you to continue your discussions after the conference ends and to seek opportunities for joint work so that we can further develop our understanding of big data and textual analysis.
Now I would like to invite the participants in the session on alternative data on inflation and the labor market to come to the podium. Welcome to the Federal Reserve, and I wish you a successful two days.
EMPLOYMENT
DoC. US CENSUS. OCTOBER 01, 2019. Manufacturing Among Top Five U.S. Employers
By ADAM GRUNDY
It’s no secret the manufacturing sector has a major impact on the U.S. economy. But just how big of an impact will be recognized on Manufacturing Day this week.
Manufacturing Day is held annually on the first Friday in October to showcase the contributions of this key economic sector but events are happening all week across the country.
To highlight modern manufacturing careers, companies and educational institutions are encouraged to open their doors to students, parents, teachers and community leaders.
The U.S. Census Bureau will join other agencies by posting important manufacturing content on the Manufacturing Day webpage beginning today and continuing throughout the week.
Manufacturing Jobs
The infographics below display the nation’s largest employers by sector and show that manufacturing ranks in the top five.

So how does manufacturing compare to other industries?
Using the average annual payroll per employee by sector within 2016 County Business Patterns, we see that the manufacturing sector has an average annual payroll by employee of $57,266.
In addition, the manufacturing sector employed 11.6 million workers in the United States in 2016
Where Manufacturing Jobs Are
The map below shows where the greatest concentration of manufacturing jobs are located.
Wisconsin, Indiana and Iowa had the highest percentage of manufacturing employment of working-age population.

These workers are not only highly skilled, but extremely well-educated. According to the Census Bureau’s 2016 Current Population Survey, 29.8% of manufacturing employees ages 25 and older had a bachelor’s degree or higher.
Manufacturing and Exports
How does manufacturing contribute to exports?
According to the Census Bureau’s Preliminary Profile of US Exporting Companies in 2017, nearly five in 10 U.S. exporting dollars come from manufacturers.

Quarterly Financial Report
The Quarterly Financial Report (QFR) provides quarterly statistics, such as sales and after-tax profits. It provides data on all manufacturing industries, for both nondurable and durable goods manufacturers.

M3 = Shipments, Inventories & Orders
Manufacturing-related economic indicators also include M3 (Manufacturers’ Shipments, Inventories & Orders), which provides an even more detailed picture of the manufacturing landscape in the United States.

Adam Grundy is a supervisory statistician in the Census Bureau’s Economic Management Division.
FULL DOCUMENT: https://census.gov/library/stories/2019/10/manufacturing-day-recognizing-manufacturing-impact-on-the-us-economy.html?utm_campaign=20191001msacos1ccstors&utm_medium=email&utm_source=govdelivery
US BANKING SYSTEM
FED. October 01, 2019. Speech. Advancing Our Understanding of Community Banking. Governor Michelle W. Bowman. At "Community Banking in the 21st Century" 2019 Community Banking Research and Policy Conference sponsored by the Federal Reserve System, the Conference of State Bank Supervisors, and the Federal Deposit Insurance Corporation, St. Louis, Missouri
It is a special honor for me to be part of this conference and its tradition of advancing our understanding of how banking shapes our economy and our communities.1 As a community banker, I sought out actionable research that I could leverage to better serve my customers and my community. As a state bank regulator, I conducted my own research to answer questions about issues affecting the banks my agency regulated. I also appreciated learning what researchers thought would provide better insight into the industry. Today I am honored to be here as the first person to serve on the Federal Reserve Board in the role that the Congress designated for someone with community banking or state supervisory experience. My work at the Board has given me an even greater appreciation for how creative, insightful research informs and shapes policy decisions that support our economy. But it also tells me there is still much to be learned and many additional areas that deserve more exploration.
More than 10 years on, as the entire banking industry continues to evolve post-crisis, I would like to share with you some of my thoughts and observations on the forces influencing the future of banking, and community banking in particular. I will also suggest some areas where policymakers could use the help of researchers, bankers, and state supervisors to better understand how community banking is changing and how we can better provide a path for the continued viability of this sector and its business model.
I hardly need to tell this audience that community banks play a vital role in the financial services industry and in the economy. From my perspective, the Federal Reserve supports community banks as a central component of a strong, resilient, and stable financial system. Our system is made more resilient through a broad and varied range of institutions serving different types of customers, with community banks providing access to credit and other financial services in towns and cities across America. With the support of community bankers, these investments are the building blocks of a strong community and help support a vibrant economy across the country—from here in the Midwest to the coasts on either side.
Research on community banking and the accessibility of financial services is incredibly important. Community bankers and policymakers want to better understand how technology, competition, regulation, and other factors are driving decision making, consolidation, and the other challenges and opportunities that are shaping community banking. Existing research provides us with some answers to these questions, but there are many gaps. The lack of a full understanding of these institutions, their functionality, and their needs may limit our ability to identify important areas of focus for research.
This is where I would like to ask for your expertise and assistance. We need to challenge ourselves to tackle some questions and issues that have not been fully explored by researchers. If you are a community banker, are involved in economic development or city or county management, or live in a community served by a community bank, your own experiences likely provide anecdotal evidence regarding the answers to these questions, but research can provide more comprehensive and systematic evidence, leading to more definitive answers. So I need your help. To begin, let's look at the questions.
Community banks provide a variety of benefits to their communities, but these benefits can be difficult to quantify and measure. Therefore, economists and policymakers would like to be able to define and understand the full economic effects of a community bank in an area that relies on it and identify the different channels by which a community bank finances spending, investment, economic development, and job creation. In addition, what happens to a community when a bank headquartered or chartered in that community is acquired by a financial institution located elsewhere? Can we calculate the cumulative contribution of community banks to U.S. investment, employment, and economic output? I hope that presentations at future community banking research conferences can help answer some of these questions and provide a stronger foundation for policy development.
Perhaps as a baseline for this discussion, we can start by looking at what has happened to the structure of the banking industry since the financial crisis. While community banks face considerable challenges, in general they have emerged from the last decade as strong competitors: On average, they have grown somewhat larger and have expanded their geographic footprints. In other words, we have a more resilient, stronger community banking sector, but one with fewer locally headquartered banks.
With that in mind, let's look at what leads me to these conclusions. As seen in figure 1, it is true that there are now many fewer small community banks—those with less than $250 million in assets—than there were in 2011.2 At the same time, the numbers of both large community banks and banks over $10 billion in assets (non-community banks) haven't changed much.
What do we find when we dig a little deeper? As shown in figure 2, very few small community banks failed or were liquidated in the past eight years—just over 100 banks, or 2 percent, of the total number in this size category as of 2011. About 2,800 banks, well over half of this original group, had no change in ownership and stayed below $250 million in assets. About 470 banks, or 10 percent of the initial number, had grown and are now above $250 million in assets.
And over this time, just over one-fourth of the smallest community banks, nearly 1,200 of them, were acquired by other banks. That is certainly a large number of acquisitions. But, again, let's look a little deeper. A fair share of those acquired banks—one in five—were acquired by another bank within the same holding company (figure 3). You could consider that more of a reorganization at the holding company level rather than an acquisition by a competitor. The remaining banks—20 percent of the smallest banks operating in 2011—were acquired by another financial institution. Seventeen of the acquisitions, about one and a half percent, were acquisitions of a small community bank by a credit union, while 14, just over one percent, involved a non-community bank acquirer with over $10 billion in assets. In other words, approximately four out of five of the small banks that were acquired during this period, or about 930 banks, were acquired by another community bank.3
To better understand what is happening with these institutions, we looked at several potential differences between small community banks that have been acquired and those that were not. Was it the smallest community banks, or those with the smallest markets, that were most likely to be acquired? It turns out that the key difference between these banks was not their geographic reach or their size, but rather their profitability. We find that small banks that were acquired by another institution were, on average, about the same size and geographic scope as other small banks but they were less profitable. This fact challenges the notion held by some that small scale or operating in a very limited geographic area is a disadvantage and it shows that many small, locally focused banks are performing well in a changing and challenging marketplace.
Bank regulators should understand how the evolving structure of community banking has affected customers and how regulations can be tailored to limit the extent to which consolidation is driven by unnecessary, ineffective, or excessive regulatory burden. Unfortunately, current research does not provide enough evidence to conclusively answer these questions. Earlier research has shown that technological change and the removal of regulatory restrictions on interstate banking in the 1980s and 1990s have played important roles in driving consolidation.4
We can gain more insight into the factors that underlie changes in community banking by asking community bankers. My former colleagues at the Conference of State Bank Supervisors (CSBS) have done that in their community bank survey and the companion "Five Questions for Five Bankers" interviews.5
Results of the 2019 survey will be revealed during the next session, but I don't think I am giving too much away to share that the factors mentioned as driving consolidation this year remain consistent with previous results. The 2018 survey shows that among banks indicating that they had received and seriously considered accepting an acquisition offer from another institution during the previous 12 months, a large majority say the cost of regulations or the lack of economies of scale at their current size are "important" or "very important" in their decision to consider the offer. About half mention succession issues. The survey did not ask which factor bankers consider most important, and there are many possible reasons a bank would consider selling. But it should not be surprising that the cost of regulation is cited as a leading factor by nearly 75 percent of these respondents.
What about those who made an offer to buy another bank during the past year? A majority, 8 out of 10, cite economies of scale as a factor in making an acquisition offer. Other common motivations include the desire to enter a new market, the ability to exploit underutilized potential at the target institution and the desire to expand within an existing market. I find these results very encouraging, reflecting an industry that believes in the future of community banking and is taking steps to invest in that future.
While it was not addressed in this part of the survey, it seems to me that the cost of regulation could have been a factor in making acquisition offers, possibly based on the theory that there could be efficiency gains by spreading fixed regulatory costs over a larger firm. It is possible these savings may have been a factor for the roughly 80 percent who cited "economies of scale." More detailed questions in future surveys could provide firmer evidence about the effect of regulatory costs on decisions related to consolidation.
The "Five Questions for Five Bankers" initiative provides many additional insights into the forces driving change in community banking. I find this initiative particularly valuable, because it is conducted by state banking commissioners who I know from my experience have deep insights into conditions in their states. Last year, 28 commissioners conducted structured interviews with a small number of community bankers in their states. The results show that bank consolidation is widely viewed as a trend that will continue into the future. Many bankers see that as a concern, but others see consolidation as an opportunity. Bankers from many states cited regulatory burden or compliance costs as major factors driving consolidation. Other frequently mentioned motives for consolidation were the costs of keeping up with technological change and the need to scale up in order to compete in a technology-focused landscape and with non-bank fintech firms in some service areas. Succession planning and finding employees were other common concerns, and bankers in a few states mentioned population decline in some rural areas as a significant issue driving the consolidation trend.
The Five Questions interviews provide a wealth of anecdotes about industry trends, and I would encourage researchers to consider utilizing the detailed interview approach in exploring the causes and effects of community bank consolidation.
It is important to point out that many of the changes to community banking through consolidation that I have described, in a general sense, are a natural and often desirable consequence of competition in a vibrant market economy. However, consolidation is less desirable when it limits access and choice for customers without other benefits, or when it is an unintended effect of government regulation and the cost of that regulation rather than a result of vigorous competition.
This isn't news to community bankers or to community banking researchers. It is not news to many people who live in small towns or urban areas who have lost access to community banks with deep roots in the community. And it is a major challenge for those who live in areas that lack access to service from any bank.
Acquiring banks need to consider that when you purchase a community bank and enter into a new market, along with the new customers and opportunities come a responsibility to be a part of and to support that community. That is why I believe it is critical that we work together to find ways to preserve the benefits provided to communities by well-managed, strong financial institutions that are deeply grounded in the areas they serve—including the communities that they expand or merge into.
Now let's consider how the changes I have described in the banking industry have affected the benefits provided to local communities across the United States. One might expect that the decline in the number of banks over the past few decades would mean communities would see fewer banks operating within the average local banking market. In fact, when viewing the data in a national perspective, the number of banks per local market has been quite stable over time in both urban and rural areas. There may be two factors that explain this outcome. First, many bank mergers combine firms that do not operate in the same local area, so they don't reduce the number of competitors in any market. Second, many banks continue to expand their geographic scope by opening branches in new markets, leading to an increase in the number of banks in those local areas that offsets the decline from bank mergers in the same market.
Of course, stability in the average number of banks across a large number of markets does not imply stability locally within each market. Many local markets have seen declines in the number of banks, while others have experienced increases. And even if the number of banks in a community does not change, there is a difference for customers and communities between a branch of a bank with numerous locations and the headquarters of a bank that is strongly rooted in a community. For example, does bank consolidation influence the availability of credit to local small businesses?
A number of studies have addressed this question and have yielded mixed results. The effect of a merger on small business lending depends on a number of factors, including the size of the merging banks, whether the acquirer is focused on small business lending, and the response of other local banks to the merger.6 Studies have also shown that the post-merger bank tends to be healthier than the target institution was before the merger, which could to lead to an increase in the availability of credit in the community.7 The bottom line is that some studies find small business lending goes up after mergers, and others find it goes down. Given the wide range of results, this is another topic where policymakers and the public would benefit from further research and analysis.
One very clear trend in the United States is a decline in the number of bank headquarters. Acquisitions have resulted in the conversion of many bank headquarters into new branches of the acquiring institution. Unfortunately, some evidence suggests that these conversions may adversely affect the local communities that are no longer home to a headquarters. The impacts extend well beyond the availability of credit. Bank executives and staff who serve on the local chamber of commerce or on the boards of local hospitals or nonprofits may move to the new headquarters location, creating a leadership void in their old hometown.
Unfortunately, community involvement like this is difficult to measure. We turned to Community Reinvestment Act (CRA) performance evaluations in the hope that they would offer some insights into local involvement by banks. Because certain institutions are subject to community development tests, their performance evaluations include information on the bank's qualifying loans, investments (including donations) and services, grants, and certain community service activities.8
Comparing performance evaluations from CRA exam reports before and after an acquisition can provide some limited, case-specific evidence on the potential consequences of the loss of a bank headquarters. Several examples from the past decade show that local donations and community service activity decline in communities that lost a bank headquarters following a merger. Pre-merger CRA evaluations detailed donations to organizations targeting initiatives such as child care, job training, homeless shelters, and scholarship programs for low- and moderate-income (LMI) individuals. Other notable activities included in-kind donations of real estate to Habitat for Humanity and monetary contributions to food pantries, Meals on Wheels, and Big Brothers Big Sisters of America. Bank officers and employees also donated significant time to community service including through financial education to LMI individuals, mentoring programs, and service on the boards of local housing development agencies. Many of these benefits were lost after a merger. The wealth of information that supervisors include in the CRA reports offers a unique look into the type of involvement that communities potentially stand to lose when headquarters move or are eliminated. More research into the effects of losing a bank headquarters could help determine whether these examples are isolated or a predictable result of consolidation.
In closing, let me return to the question of what we know and what we would like to know. We know that consolidation accelerated after the Congress removed barriers to interstate banking, and that it has proceeded more or less steadily since that time. We do not know if and to what extent other factors—such as achieving a desired level of economies of scale, for example—have been driving consolidation. We have recently seen a rising number of acquisitions by credit unions, and we do not fully understand the implications of this trend, which seems likely to continue to accelerate. We know that profitability is a more important factor in predicting acquisitions than bank size or geographic area, but more research on why some smaller banks are more profitable than others could be valuable. We know from the CSBS surveys that regulatory costs are motivating banks that are considering selling or merging, and we could learn more about what is motivating buyers.
Deeper and more creative research is certainly needed to understand how acquisitions affect many communities, small businesses, and consumers. One factor is the vital leadership and supporting role many small banks play in their communities. While that benefit may be hard to measure, I think it is essential that researchers try to do so. Communities need leaders and institutions that are deeply rooted in their cities, towns, and rural areas. Strong relationships and extensive experience are not easily replaced.
Finally, it is important that we understand why so few new banks have been created. Are asset thresholds too high? Are regulations too burdensome? Or have low interest rates meant that net interest rate margins are just too narrow? Understanding the lack of new bank formation is as important as understanding the extent of consolidation and competition.
I am sure you have noticed that I have given you more questions than answers today. That was one of my goals, because I am confident that as researchers you have the skills and creativity to focus on the best questions and find the most insightful answers. And when you do uncover new insights, my colleagues and I will always be eager to learn from and act on what you have found.
References
Avery, Robert B., and Katherine A. Samolyk (2004). "Bank Consolidation and Small Business Lending: The Role of Community Banks," Journal of Financial Services Research, vol. 25 (April), pp. 291–325.
Berger, Allen N., Rebecca S. Demsetz, and Philip E. Strahan (1999). "The Consolidation of the Financial Services Industry: Causes, Consequences, and Implications for the Future," Journal of Banking and Finance, vol. 23 (February), pp. 135–94.
Berger, Allen N., Anthony Saunders, Joseph M. Scalise, and Gregory F. Udell (1998). "The Effects of Bank Mergers and Acquisitions on Small Business Lending," Journal of Financial Economics, vol. 50 (November), pp. 187–229.
Focarelli, Dario, Fabio Panetta, and Carmelo Salleo (2002). "Why Do Banks Merge?" Journal of Money, Credit and Banking, vol. 34 (November), pp. 1047–66.
Jagtiani, Julapa, Ian Kotliar, and Raman Quinn Maingi (2016). "Community Bank Mergers and Their Impact on Small Business Lending," Journal of Financial Stability, vol. 27 (October), pp. 106–21.
Peek, Joe, and Eric S. Rosengren (1998). "Bank Consolidation and Small Business Lending: It's Not Just Bank Size That Matters," Journal of Banking and Finance, vol. 22 (August), pp. 799–819.
Notes
1. I would like to thank Robin Prager, John Kandrac, and Mark Wicks for their research and assistance in preparing this speech.
2. Assets are in constant 2018 dollars.
3. The pattern during the pre-crisis period is similar. The difference from the post-crisis period is that from the fourth quarter of 1998 to the third quarter of 2007, a larger share of the acquisitions involved an internal reorganization within a bank holding company. This period begins four years after the signing of the Riegle-Neal Interstate Banking and Branching Efficiency Act of 1994, which removed many restrictions on interstate banking.
4. See Berger, Demsetz, and Strahan (1999) and Focarelli, Panetta, and Salleo (2002).
5. A video on the results of the CSBS 2018 Survey of Community Banks is available on this conference's website at https://www.communitybanking.org/news; for more information on the survey, see the CSBS website at https://www.csbs.org.
6. For example, see Berger and others (1998), Peek and Rosengren (1998), and Avery and Samolyk (2004).
7. See Jagtiani, Kotliar, and Maingi (2016).
8. Under CRA, a small institution has assets of less than $321 million as of December 31 in both of the two prior calendar years. An intermediate small institution has at least $321 million in assets and less than $1.284 billion in assets under the same calendar rules. A large institution has greater than $1.284 billion in assets as of December 31 in both prior calendar years. Activities that qualify for community development tests must primarily focus on economic development, revitalization of low- and moderate-income (LMI) locales, affordable housing, and services that target to LMI individuals. Large and intermediate small banks are subject to review of their community development activities while some small banks voluntarily choose to have their community development activities reviewed.
FULL DOCUMENT: https://www.federalreserve.gov/newsevents/speech/files/bowman20191001a.pdf
________________
ORGANISMS
INTERNATIONAL TRADE
WTO. 10/01/2019. WTO lowers trade forecast as tensions unsettle global economy
Escalating trade tensions and a slowing global economy have led WTO economists to sharply downgrade their forecasts for trade growth in 2019 and 2020. World merchandise trade volumes are now expected to rise by only 1.2% in 2019, substantially slower than the 2.6% growth forecast in April. The projected increase in 2020 is now 2.7%, down from 3.0% previously. The economists caution that downside risks remain high and that the 2020 projection depends on a return to more normal trade relations.
- World merchandise trade volume is forecast to grow 1.2% in 2019. This is substantially below the 2.6% trade growth that had been projected in April.
- Trade volume growth should accelerate slightly to 2.7% in 2020 while global GDP growth holds steady at 2.3% (at market exchange rates), but this depends on an easing of trade tensions.
- Trade conflicts pose the biggest downside risk to the forecast but macroeconomic shocks and financial volatility are also potential triggers for a steeper downturn.
- Trade-related indicators signal a worrying trajectory for world trade based on global export orders and economic policy uncertainty.
- Export and import growth slowed across all regions and at all levels of development in the first half of 2019.
“The darkening outlook for trade is discouraging but not unexpected. Beyond their direct effects, trade conflicts heighten uncertainty, which is leading some businesses to delay the productivity-enhancing investments that are essential to raising living standards," said WTO Director-General Roberto Azevêdo. "Job creation may also be hampered as firms employ fewer workers to produce goods and services for export."
"Resolving trade disagreements would allow WTO members to avoid such costs," the WTO Director-General added. "The multilateral trading system remains the most important global forum for settling differences and providing solutions for the challenges of the 21st century global economy. Members should work together in a spirit of cooperation to reform the WTO and make it even stronger and more effective.”
The updated trade forecast is based on consensus estimates of world GDP growth of 2.3% at market exchange rates for both 2019 and 2020, down from 2.6% previously. Slowing economic growth is partly due to rising trade tensions but also reflects country-specific cyclical and structural factors, including the shifting monetary policy stance in developed economies and Brexit-related uncertainty in the European Union. Macroeconomic risks are firmly tilted to the downside.
Due to the high degree of uncertainty associated with trade forecasts under current conditions, the estimated growth rate for world trade in 2019 is placed within a range of 0.5% to 1.6%. Trade growth could fall below this range if trade tensions continue to build, or outperform it if they start to recede. The range of likely values is wider for 2020, ranging from 1.7% to 3.7%, with better outcomes depending on an easing of trade tensions.
Risks to the forecast are heavily weighted to the downside and dominated by trade policy. Further rounds of tariffs and retaliation could produce a destructive cycle of recrimination. Shifting monetary and fiscal policies could destabilize volatile financial markets. A sharper slowing of the global economy could produce an even bigger downturn in trade. Finally, a disorderly Brexit could have a significant regional impact, mostly confined to Europe.
Chart 1: World merchandise exports and imports by level of development, 2012Q1-2019Q2
Volume index, 2012Q1=100
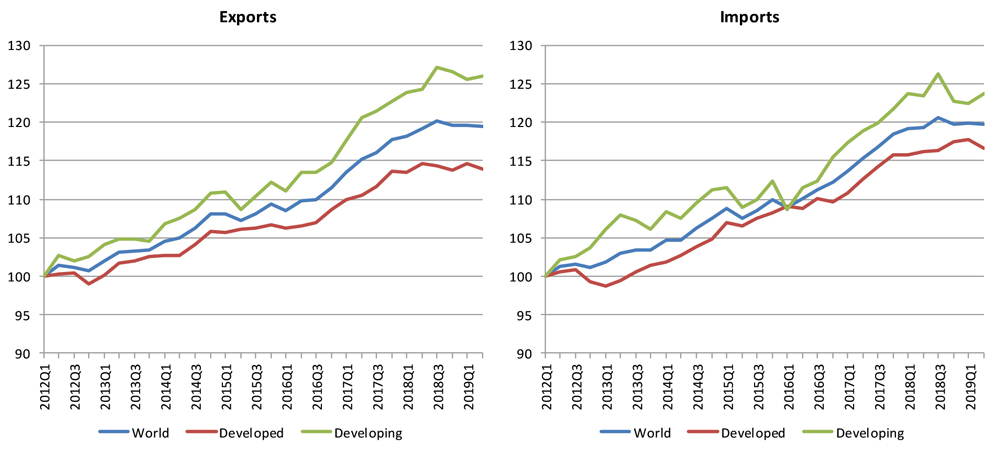
Source: WTO and UNCTAD.
Charts 1 and 2 show quarterly merchandise export and import volumes on a seasonally-adjusted basis by level of development and geographic region. In the first half of 2019, world merchandise trade was up 0.6% compared to the same period in the previous year. This marks a substantial slowdown compared to recent years. Exports of developed economies were up just 0.2% for the year-to-date, while those of developing economies were up 1.3%. On the import side, developed economies recorded year-on-year growth of 1.1% while developing countries declined by 0.4%. Growth rates based on quarterly data may differ slightly from calculations based on annual statistics, but they should be of similar magnitude.
Chart 2: Merchandise exports and imports by region, 2012Q1-2019Q2
Volume index, 2012Q1=100
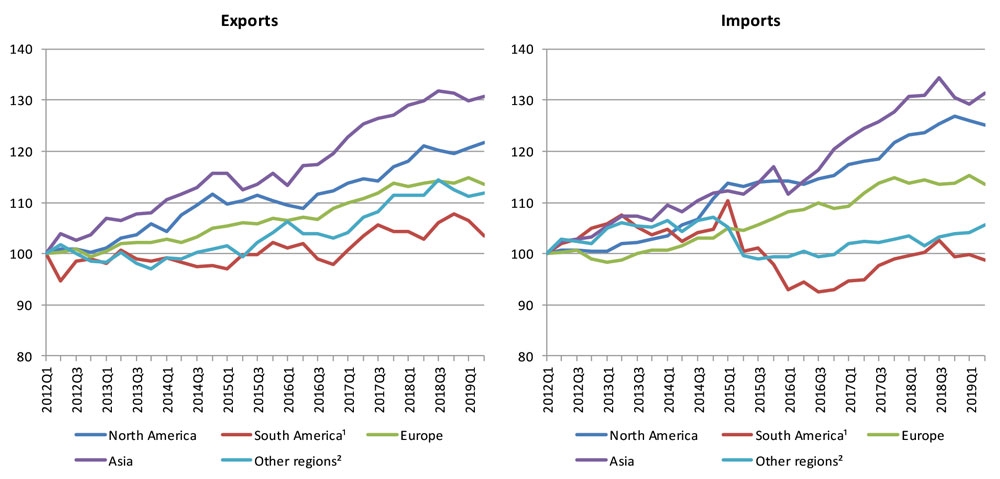
1 Refers to South and Central America and the Caribbean.
2 Other regions comprise Africa, Middle East and the Commonwealth of Independent States, including associate and former member States.
Source: WTO and UNCTAD.
All geographical regions recorded positive year-on-year export growth in the first half of 2019 despite a substantial weakening of global demand. North America had the fastest export growth of any region at 1.4%, followed by South America at 1.3%, Europe at 0.7%, Asia at 0.7%, and Other regions (comprising Africa, the Middle East and the Commonwealth of Independent States, including associate and former member States) at 0.1%.
North America recorded the fastest import growth of any single region at 1.8%, followed by Europe at 0.2%. Two regions registered declines (South America at -0.7% and Asia at -0.4%). Collectively, the imports of Other regions grew faster than those of North America, at 2.4%. Import demand has been particularly weak in Asia, weighing heavily on exporters of manufactured goods (e.g. Japan, Korea, and Germany). Exporters of natural resources have also seen demand for their products weaken, as evidenced by the 12% year-on-year decline in commodity prices in August.
There are no comprehensive statistics on services trade in volume terms due to the general unavailability of price data, but an approximate measure of services trade volume can be derived by adjusting nominal commercial services trade statistics to account for exchange rates and inflation. This index shows that, like merchandise trade, commercial services trade has plateaued recently (Chart 3).
Chart 3: World services trade activity index, 2015Q1 – 2019Q2
Index, 2015=100
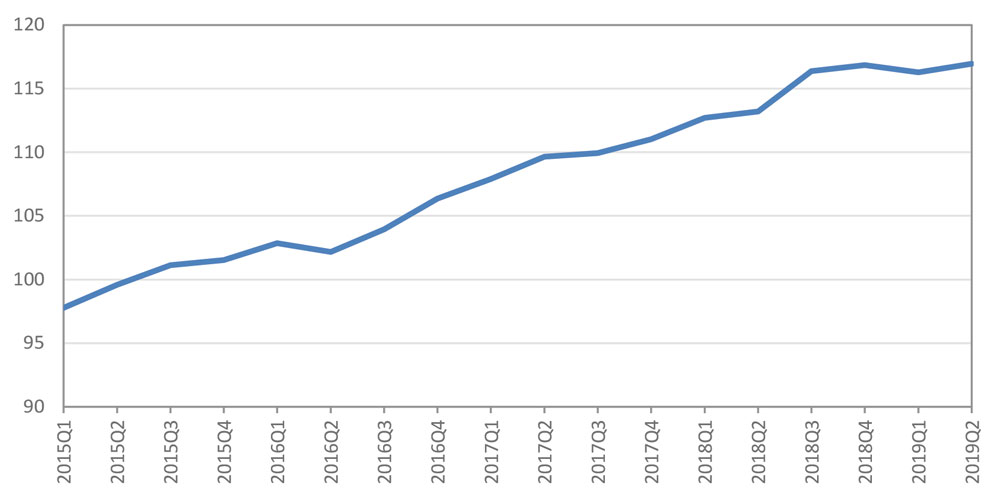
Source: WTO and UNCTAD, United States Federal Reserve, Bank for International Settlements and Secretariat calculations.
Monthly economic indicators provide some worrying clues about the current and future trajectory of world trade. An index of new export orders derived from purchasing managers' indices has fallen from 54.0 in January 2018 to 47.5 in August 2019, the weakest reading since October 2012 (Chart 4). Note that values below 50.0 signal contraction.
Chart 4: Global PMI new export orders index, Jan. 2010 – Aug. 2019
Index, base=50

Note: Values greater than 50 indicate expansion while values less than 50 denote contraction.
Source: IHS Markit.
A separate indicator based on the frequency of phrases in press reports captures aspects of monetary, fiscal and trade policy uncertainty (Chart 5). In 2019, the index has risen from 289 in January to 348 in August, its highest level ever. To the extent that economic uncertainty deters investment, it can have a disproportionately negative effect on trade since capital goods that make up investments tend to have high import content.
Chart 5: Global economic policy uncertainty, Jan. 2005 – Aug. 2019
(index, average 1997-2015=100)
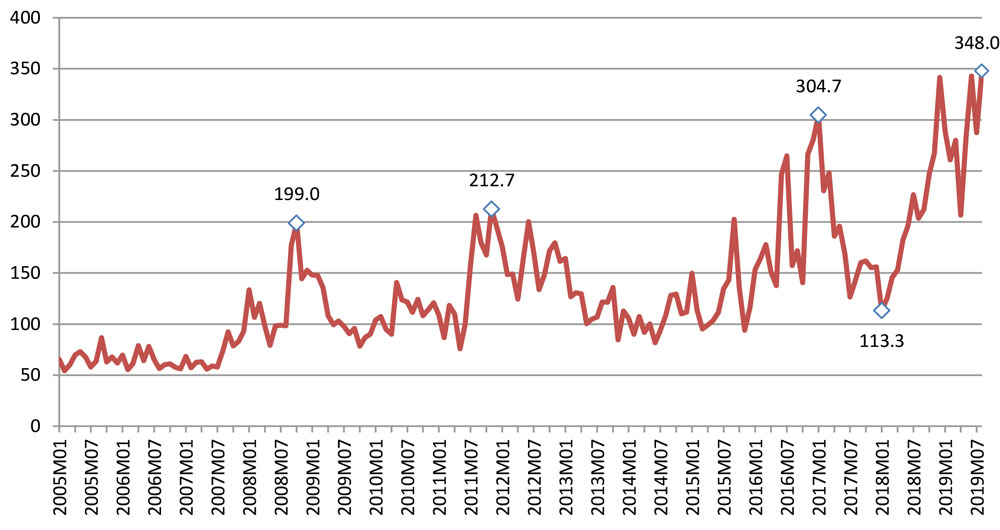
Source: PolicyUncertainty.com.
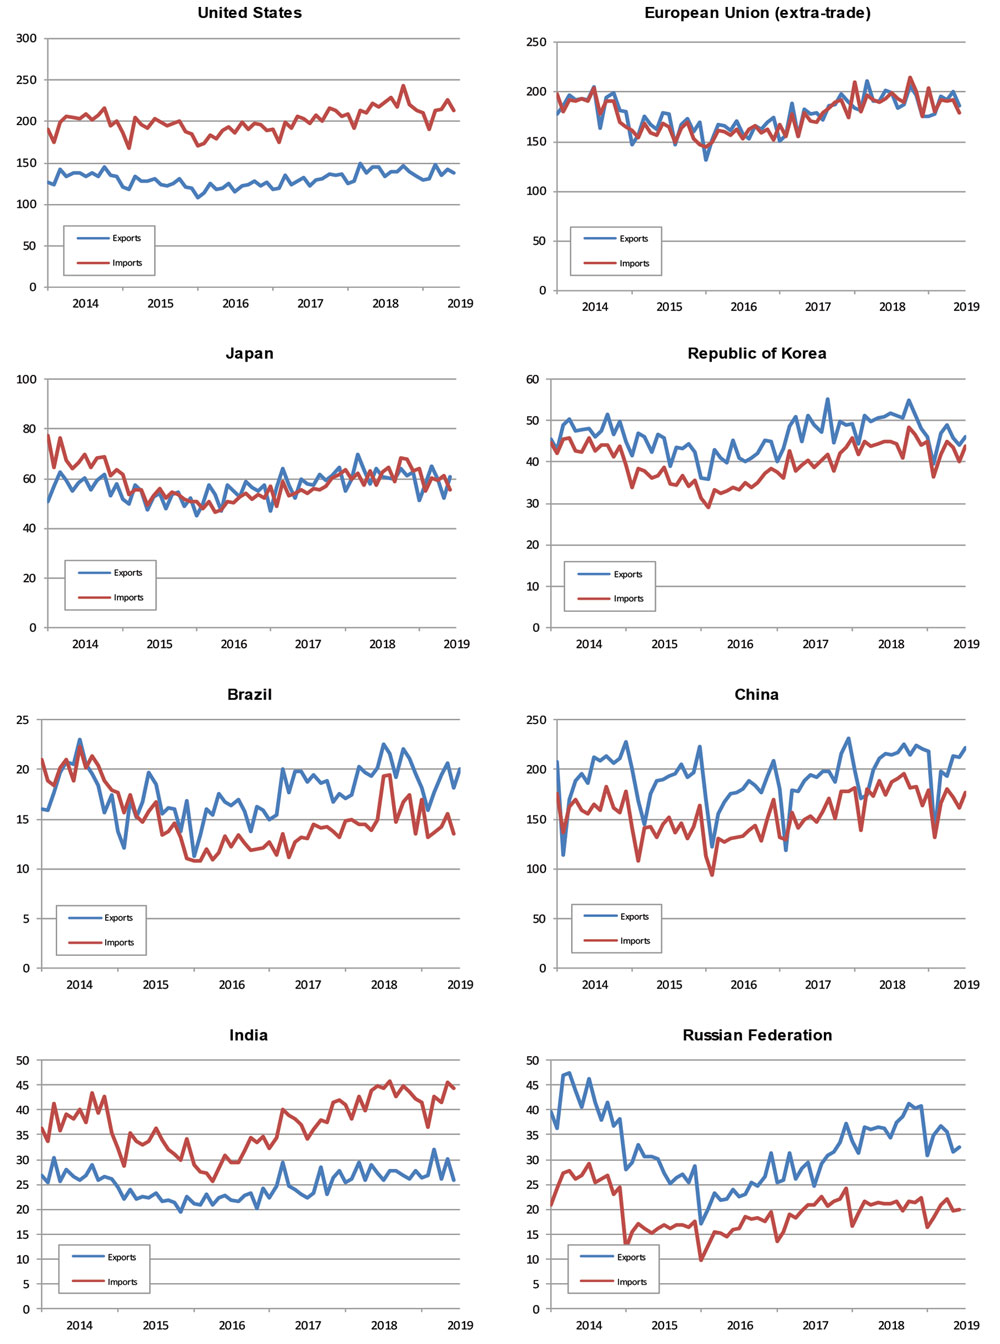
Monthly merchandise trade values in current US dollar terms are shown for selected economies in Chart 6 below. Some countries (e.g. the United States and China) may show signs of a turnaround while others (the Republic of Korea and Japan) provide no such indication. Nominal trade statistics are strongly influenced by prices and exchange rates, so these trends should be interpreted with caution.
If current GDP estimates are realised, the volume of world merchandise trade should increase by 1.2% in 2019 (Table 1), but this would require a degree of recovery in the second half of the year. Monetary easing in developed countries has not had a major impact to date but is likely to be felt toward the end of 2019 and into 2020. Other measures, including fiscal policies for surplus countries, are being undertaken to stem the current slowdown. These measures could provide some upside potential to the forecast, especially if outstanding trade disputes are resolved. However, the balance of risk remains on the downside, with trade disputes, financial volatility and geopolitical tensions providing potential triggers for a steeper downturn.
Table 1: Merchandise trade volume and real GDP, 2015-20201
Annual % change

1 Figures for 2019 and 2020 are projections.
2 Average of exports and imports.
3 Includes the Commonwealth of Independent States (CIS), including associate and former member States.
4 Refers to South and Central America and the Caribbean.
5 Other regions comprise Africa, Middle East and Commonwealth of Independent States (CIS).
Source: WTO and UNCTAD for trade, consensus estimates for GDP.
Chart 6: Merchandise exports and imports of selected economies, January 2014-July 2019
(Billion dollars)
Source: IMF International Financial Statistics, Global Trade Information Services GTA database, national statistics.
Chart 6: Merchandise exports and imports of selected economies, January 2014-July 2019
(Billion dollars)
FULL DOCUMENT: https://www.wto.org/english/news_e/pres19_e/pr840_e.htm
MONEY LAUNDERING
IMF. 01/01/2019. FINANCE & DEVELOPMENT, SEPTEMBER 2019, VOL. 56, NO. 3.
The Art of Money Laundering. The loosely regulated art market is rife with opportunities for washing illicit cash
Tom Mashberg
Matthew Green was raised in the heady world of fine arts, surrounded from boyhood by the works of Old Masters and Impressionists. His father, Richard, the owner of two of London’s most illustrious galleries, dealt in legendary names like Picasso, Constable, Chagall, and Brueghel. Matthew Green, 51, was preparing to take over the family business so his father could pursue new passions.
But in late 2017, US prosecutors say, Green fell in with the owners of a Mauritius-based investment company, Beaufort Securities, that engaged in fraud, stock manipulation, and money laundering. For Beaufort’s owners, duping investors into buying worthless securities was the easy part. The hard part was making the ill-gotten profit appear legitimate to regulators. Beaufort had done so in the past by depositing money under false names in offshore banks, then slipping it into the global banking system little by little. The company had also used the time-tested trick of buying real estate and quickly selling it off, often at a loss, to convert illegal proceeds into assets that could be accounted for as the fruit of a property deal.
Now, money launderers like Beaufort were searching for less obvious ways to scrub their cash, and Matthew Green knew how to trade in multimillion-dollar works of art. Approached in late 2017 by the Beaufort conspirators—one of whom was in fact an undercover US federal agent who had infiltrated Beaufort—Green allegedly said he would accept £6.7 million (about $9 million at the time) in what he knew to be the yield of securities fraud in exchange for a 1965 Picasso, Personnages. Green would draw up phony ownership papers saying the work had been sold, all the while keeping the Picasso stored away. Down the road he would pretend to buy it back from his coconspirators at a lower price, keeping 5 to 10 percent of the laundered cash for himself.
“Art is a very attractive vehicle to launder money,” says Peter D. Hardy, a former US prosecutor who now advises corporations and industries on compliance with anti-money-laundering requirements. “It can be hidden or smuggled, transactions often are private, and prices can be subjective and manipulated—and extremely high.”
After a slew of recent cases in the United States and Europe, the momentum toward a crackdown on illicit art and antiquities deals is growing. The legitimate art market is itself enormous—estimated at $67.4 billion worldwide at the end of 2018. According to the United Nations Office on Drugs and Crime, the underground art market, which includes thefts, fakes, illegal imports, and organized looting, may bring in as much as $6 billion annually. The portion attributed to money laundering and other financial crimes is in the $3 billion range.
For Green, dabbling in the dark art of money laundering has ended poorly. He has been indicted in the United States on six counts of attempted money laundering, and his gallery in the Mayfair district of London has been declared insolvent by British regulators. Although Green has not been identified as a fugitive, court records indicate that US prosecutors have disclosed his indictment and arrest warrant to law enforcement agencies in the United Kingdom, Hungary, Saint Vincent and the Grenadines, and Mauritius. He has also been ordered to surrender the Picasso.
The tactics used by Green and the others charged in the Picasso scheme remain easy to replicate, at least for now. Green was taking advantage of a regulatory loophole that US and European legislators are working hard to close. Unlike banks, life insurance companies, casinos, currency exchangers, and even precious-metals dealers, auction houses, and art sellers have no obligation to report large cash transactions to a governing authority. In fact, dealers can keep the names of buyers and sellers anonymous. And unlike US businesses that deal in large sums of money, they do not have to file so-called suspicious activity reports with the US Treasury Department if they have doubts about the origins of the money they are being paid.
Bill in Congress
Under the Illicit Art and Antiquities Trafficking Prevention Act under consideration in Congress, the US government would require “dealers in art and antiquities” to establish anti-money-laundering programs, keep records of cash purchases, and report suspicious activity and transactions exceeding $10,000 to federal regulators. In addition, the art industry would be required to look into a client’s background and examine purchases and sales for evidence that the money might be tainted.
In the European Union, under its Fifth Anti-Money Laundering Directive, art businesses would be obliged to augment efforts to vet customers and to discern “as far as reasonably possible” the purpose of all large, unusually complex, or secretive transactions.
In the view of many art dealers, the legal changes in both the United States and the European Union would strip the vendors of a major selling point—the ability to offer anonymity to clients and preserve the opacity of the art market. In years past, when the fine arts market was seen as a more genteel pursuit, there was no real inclination by the authorities to police it as strenuously as the banking or brokerage trades. All that has changed in the past decade or so because of the enormous amounts of money pouring into art collecting and the growing focus on stymieing the clandestine trafficking in looted and smuggled artifacts from war-torn nations.
Law enforcement officials and even some art merchants now say that excessive secrecy has become a drawback because more and more money launderers have discovered that the art market can be used as an easy conduit. As noted by the FBI and Interpol, “in comparison with other trade sectors, the art market faces a higher risk of exposure to dubious financial practices” because “the volume of legally questionable transactions is noticeably higher than in other global markets.”
The indictment filed against Matthew Green and his confederates even recounts a conversation, tape-recorded by an undercover agent, in which Green allegedly crows that “the art trade is the only market that is this unregulated.” A client “could even buy the art under a false name with no repercussions,” Green is quoted as saying.
“More cases involving artwork and money laundering undoubtedly would be uncovered by law enforcement if art and antiquities dealers were added to the list of businesses legally liable for reporting suspect payments,” says Rick St. Hilaire, a former US prosecutor and an expert on art and antiquities law. “For now, it’s wide open.”
Supporters of expanded regulation say all they want is for the trade in fine art, cultural property, and ancient artifacts to be subjected to the same financial regulations that banks and other industries face.
“The art market is an ideal playing ground for money laundering,” says Thomas Christ, a board member of the Basel Institute on Governance, a Swiss nonprofit that has proposed anti-money-laundering standards for art market operators. He added, “We have to ask for clear transparency, where you got the money from and where it is going.”
The industry objects
Not surprisingly, the art industry is fighting the regulations. Some sectors are asserting that examples of actual money laundering via the art trade are rare or exaggerated by law enforcement agencies eager to generate sensational headlines. Others, like the International Confederation of Art and Antique Dealers Associations, say the reporting requirements are too burdensome for smaller players in the art market.
At a conference on money laundering last year, James McAndrew, a former Department of Homeland Security special agent who now lobbies on behalf of dealers and collectors, said that “there has not been an art dealer or collector convicted for laundering money through art. The idea that auctions are nefarious or evil is outrageous because it hasn’t been proven.” Peter Tompa, director of the Global Heritage Alliance, which supports coin dealers and the bullion industry, warned that many in the trade would exit the market because the new standards would be too costly to adopt.
And the Committee for Cultural Policy, which represents large and small art dealers and buyers in the United States, said that “it is not practical to use art to launder money, especially antiques and antiquities, because art sells slowly, and buyers are usually collectors,” not criminals seeking a quick deal to “legitimize” dubious money.
But advocates say the stratospheric valuations placed on artworks by even second-tier artists leave them no choice but to impose constraints on a vulnerable industry at a time when drug kingpins, oil oligarchs, and assorted kleptocrats are desperate to turn their dirty money into a clean or fungible asset. For now, the momentum is with them, and there are enough money laundering prosecutions to justify those concerns.
A 2014 case known as U.S. v. Ronald Belciano et al., for example, involved both the distribution of marijuana and a conspiracy to launder the profits using artwork. Police seized over $4 million in cash and confiscated approximately 125 pounds of marijuana and 33 paintings worth more than $619,000 from a storage warehouse in Pennsylvania. Prosecutors said the drug dealers had accepted the artworks in lieu of cash after being promised that they could sell them back for laundered money once the art dealers had buried the transactions in their books. In 2015, Belciano was sentenced to five years in prison.
In another high-profile case, a Brazilian financier was accused of embezzling millions from his bank and trying to launder the money by acquiring expensive art, including Jean-Michel Basquiat’s Hannibal (1981). According to federal prosecutors in New York, the financier, Edemar Cid Ferreira, tried to smuggle the Basquiat and about 90 other high-value works of art into the United States using papers that declared the value of each object at $100. Even though he was convicted and sentenced to 21 years in 2006, appeals and complexities in the legal system meant the United States could not repatriate the works to Brazil until 2017.
And small-scale scams occur every day. Indian officials, for example, say antiquities looted from remote temples and tombs are used as a means of currency exchange. The items are shipped to dealers in Hong Kong SAR or Bangkok—often falsely listed in manifests as replicas worth a few rupees. Collectors and traders are standing by to pay thousands of dollars for the relics, which come with fake documents attesting to their legal purchase. The dealers keep a share of the take and filter the rest of the money back to crime rings in India through unregulated nonbank financial companies.
Deborah Lehr, chairman of the Antiquities Coalition, a Washington, DC–based organization fighting trafficking in artifacts, warns that terrorist groups are already using the art and antiquities industry to raise money by plundering ancient cultural sites and employing intermediaries to sell off the looted goods. “A key priority is shutting the US market to illicit antiquities while encouraging responsible trade practices,” she says.
Given that upward of 70 to 90 percent of auction catalog listings for valuable antiquities provide scant information about the seller, art merchants would be wise to accept the inevitable and move toward greater transparency and more due diligence, says Hardy, the former prosecutor. The proposed regulations, he says, would simply enshrine into law the steps that art dealers ought to be taking in the first place to stave off criminal acts.
“Sometimes,” he says, “the provenance of the funds can be more critical than the provenance of the art.”
TOM MASHBERG is a veteran journalist who writes about art and antiquities crimes for the New York Times and other publications.
FULL DOCUMENT: https://www.imf.org/external/pubs/ft/fandd/2019/09/pdf/the-art-of-money-laundering-and-washing-illicit-cash-mashberg.pdf
________________
ECONOMIA BRASILEIRA / BRAZIL ECONOMICS
INDÚSTRIA
IBGE. 01/10/2019. Produção industrial cresce 0,8% em agosto
Em agosto de 2019, a produção industrial cresceu 0,8% frente a julho (série com ajuste sazonal), eliminando, assim, grande parte da perda de 0,9% acumulada no período maio-julho de 2019. Na série sem ajuste sazonal, no confronto com agosto de 2018, o total da indústria apontou redução de 2,3% em agosto de 2019, após também registrar recuo em junho (-5,9%) e julho (-2,5%).
| Período | Produção industrial |
|---|---|
| Agosto / Julho 2019 | 0,8% |
| Agosto 2019 / Agosto 2018 | -2,3% |
| Acumulado em 2019 | -1,7% |
| Acumulado em 12 meses | -1,7% |
| Média móvel trimestral | 0,0% |
O setor industrial acumulou queda de 1,7% nos oito primeiros meses de 2019. O acumulado nos últimos 12 meses, ao assinalar recuo de 1,7% em agosto de 2019, mostrou perda de ritmo frente ao resultado do mês anterior (-1,3%) e permaneceu com a trajetória predominantemente descendente iniciada em julho de 2018 (3,2%).
| Indicadores da Produção Industrial por Grandes Categorias Econômicas Brasil - Agosto de 2019 | ||||
|---|---|---|---|---|
| Grandes Categorias Econômicas | Variação (%) | |||
| Agosto 2019/ Julho 2019* | Agosto 2019/ Agosto 2018 | Acumulado Janeiro-Agosto | Acumulado nos Últimos 12 Meses | |
| Bens de Capital | -0,4 | -3,7 | 0,7 | 1,6 |
| Bens Intermediários | 1,4 | -2,1 | -2,8 | -2,6 |
| Bens de Consumo | -0,7 | -1,8 | 0,3 | -0,3 |
| Duráveis | -1,8 | -5,6 | 0,5 | -0,6 |
| Semiduráveis e não Duráveis | -0,4 | -0,7 | 0,2 | -0,3 |
| Indústria Geral | 0,8 | -2,3 | -1,7 | -1,7 |
| Fonte: IBGE, Diretoria de Pesquisas, Coordenação de Indústria *Série com ajuste sazonal | ||||
10 dos 26 ramos pesquisados crescem em agosto
No crescimento de 0,8% da atividade industrial na passagem de julho para agosto de 2019, somente uma das quatro grandes categorias econômicas e 10 dos 26 ramos pesquisados mostraram expansão na produção. Entre as atividades, a influência positiva mais importante foi registrada por indústrias extrativas, que avançou 6,6%, quarta taxa positiva consecutiva, acumulando, assim, ganho de 25,2% nesse período. Vale destacar que esses resultados positivos interromperam três meses seguidos de queda na produção, período em que acumulou redução de 24,2%. Outros impactos positivos relevantes foram observados nos setores de coque, produtos derivados do petróleo e biocombustíveis (3,6%) e de produtos alimentícios (2,0%), com o primeiro assinalando avanço de 7,7% no período maio-agosto de 2019; e o segundo interrompendo três meses consecutivos de queda na produção, período em que acumulou perda de 3,0%.
Por outro lado, entre os 16 ramos que reduziram a produção nesse mês, o desempenho de maior importância para a média global foi registrado por veículos automotores, reboques e carrocerias, que recuou 3,0%, revertendo, dessa forma, a expansão de 1,4% verificada no mês anterior, quando interrompeu dois meses consecutivos de queda, período em que acumulou redução de 4,4%. Vale destacar também os resultados negativos assinalados pelos ramos de confecção de artigos do vestuário e acessórios (-7,4%), de máquinas e equipamentos (-2,7%) e de produtos farmoquímicos e farmacêuticos (-4,9%), após o crescimento observado em julho último: 0,9%, 6,4% e 6,4%, respectivamente.
Entre as grandes categorias econômicas, ainda na comparação com o mês imediatamente anterior, bens intermediários, ao crescer 1,4%, mostrou a única taxa positiva em agosto de 2019, após assinalar queda em junho (-0,6%) e ficar estável em julho (0,0%). Por outro lado, o setor produtor de bens de consumo duráveis (-1,8%) apontou o recuo mais intenso nesse mês, após avançar 0,4% em julho de 2019, quando interrompeu dois meses consecutivos de queda na produção, período em que acumulou redução de 3,0%. Os segmentos de bens de consumo semi e não-duráveis (-0,4%) e de bens de capital (-0,4%) também assinalaram resultados negativos em agosto de 2019, com o primeiro eliminando parte do avanço de 1,3%% verificado em julho; e o segundo marcando o terceiro mês seguido de queda na produção, com perda acumulada de 1,1% nesse período.
Média móvel trimestral tem variação nula (0,0%)
Ainda na série com ajuste sazonal, a evolução do índice de média móvel trimestral para o total da indústria mostrou variação nula (0,0%) no trimestre encerrado em agosto de 2019 frente ao nível do mês anterior, após registrar trajetória predominantemente descendente desde setembro de 2018.
Entre as grandes categorias econômicas, ainda em relação ao movimento deste índice na margem, bens de consumo duráveis (-0,7%) e bens de capital (-0,4%) apontaram os resultados negativos nesse mês, com ambos marcando o segundo mês seguido de queda e acumulando nesse período perda de 1,6% e 0,5%, respectivamente. O setor produtor de bens de consumo semi e não-duráveis também mostrou variação nula (0,0%) em agosto de 2019, após assinalar decréscimo de 0,4% no mês anterior. Por outro lado, o segmento de bens intermediários (0,3%) apontou o único avanço nesse mês e mostrou o segundo resultado positivo consecutivo nesse tipo de comparação, após interromper no mês anterior a trajetória descendente iniciada em janeiro de 2019.
Produção industrial cai 2,3% em relação a agosto de 2018
Na comparação com agosto de 2018, o setor industrial assinalou recuo de 2,3% em agosto de 2019, com resultados negativos nas quatro grandes categorias econômicas, 23 dos 26 ramos, 55 dos 79 grupos e 63,1% dos 805 produtos pesquisados. Vale citar que agosto de 2019 (22 dias) teve um dia útil a menos do que igual mês do ano anterior (23).
Entre as atividades, veículos automotores, reboques e carrocerias (-5,8%), outros produtos químicos (-6,1%) e celulose, papel e produtos de papel (-8,4%) exerceram as maiores influências negativas na formação da média da indústria, pressionadas, em grande medida, pela menor fabricação dos itens automóveis, na primeira; adubos ou fertilizantes com nitrogênio, fósforo e potássio (NPK), etileno não-saturado, superfosfatos, policloreto de vinila (PVC), amoníaco, hidróxido de sódio (soda cáustica), tintas e vernizes para impressão e construção, ureia e oxigênio, na segunda; e pastas químicas de madeira (celulose), na terceira.
Vale destacar também as contribuições negativas assinaladas pelos ramos de indústrias extrativas (-1,8%), de produtos de borracha e de material plástico (-5,6%), de manutenção, reparação e instalação de máquinas e equipamentos (-12,7%), de produtos farmoquímicos e farmacêuticos (-6,4%), de máquinas e equipamentos (-3,1%), de confecção de artigos do vestuário e acessórios (-6,5%), de bebidas (-3,7%) e de outros equipamentos de transporte (-9,7%). Em termos de produtos, os impactos negativos mais importantes nesses ramos foram, respectivamente, minérios de ferro; peças e acessórios de plástico para indústria automobilística, pneus novos para automóveis e motocicletas, embalagens de plástico para produtos alimentícios ou bebidas, chapas, folhas e outras formas planas autoadesivas de plásticos, artigos descartáveis de plástico, sacos, sacolas e bolsas de plástico para embalagens ou transporte, chapas, folhas, tiras e lâminas de plásticos, artigos de plástico para uso doméstico, correias de transmissão de borracha vulcanizada e reservatórios, caixas de água, cisternas, piscinas e artefatos semelhantes de plástico; serviços de manutenção e reparação de máquinas e equipamentos para usos industriais, de estruturas flutuantes, de máquinas motrizes não-elétricas e de máquinas e equipamentos para prospecção e extração mineral; medicamentos; tratores agrícolas, rolamentos de esferas, agulhas, cilindros ou roletes para equipamentos industriais, máquinas para colheita, carregadoras-transportadoras, máquinas para encher, fechar e embalar, centros de usinagem para trabalhar metais e bombas centrífugas; camisetas de malha, calças compridas, vestidos de malha, conjuntos de malha, calcinhas de malha, macacões e jalecos e roupas de dormir ou de banho de malha de uso feminino; preparações em xarope para elaboração de bebidas para fins industriais; e embarcações para transporte de pessoas ou cargas (inclusive petroleiros e plataformas), partes e peças para veículos ferroviários, aviões e vagões de passageiros e para transporte de mercadorias.
Por outro lado, ainda na comparação com agosto de 2018, entre as três atividades que apontaram ampliação na produção, as principais influências no total da indústria foram registradas por coque, produtos derivados do petróleo e biocombustíveis (5,0%) e produtos alimentícios (1,0%), impulsionadas, em grande medida, pela maior produção de gasolina automotiva, álcool etílico e óleos combustíveis, na primeira; e de açúcar cristal e VHP, sucos concentrados de laranja e carnes e miudezas de aves congeladas, na segunda.
Ainda no confronto com igual mês do ano anterior, bens de consumo duráveis (-5,6%) e bens de capital (-3,7%) assinalaram, em agosto de 2019, os recuos mais acentuados entre as grandes categorias econômicas. Os setores produtores de bens intermediários (-2,1%) e de bens de consumo semi e não-duráveis (-0,7%) também apontaram resultados negativos nesse mês, mas ambos com reduções menos intensas do que a observada na média nacional (-2,3%).
O segmento de bens de consumo duráveis recuou 5,6% em agosto de 2019 frente a igual período do ano anterior, após avançar 1,0% em julho último. Nesse mês, o setor foi particularmente pressionado pela redução na fabricação de automóveis (-11,9%). Vale citar também a queda assinalada pelo grupamento de móveis (-6,2%). Por outro lado, os principais impactos positivos foram verificados em eletrodomésticos da “linha branca” (7,4%) e da “linha marrom” (3,8%), motocicletas (9,9%) e outros eletrodomésticos (4,7%).
O setor produtor de bens de capital recuou 3,7% no índice mensal de agosto de 2019, após avançar 6,6% em julho último. Na formação do índice desse mês, o segmento foi influenciado, em grande medida, pela queda observada no grupamento de bens de capital para equipamentos de transporte (-6,6%), pressionado, principalmente, pela menor fabricação de embarcações para transporte de pessoas ou cargas (inclusive petroleiros e plataformas), caminhões, aviões, vagões de passageiros e para transporte de mercadorias e reboques e semirreboques (inclusive para uso agrícola). As demais taxas negativas foram registradas por bens de capital agrícolas (-17,3%), de uso misto (-8,3%), para fins industriais (-1,4%) e para construção (-4,8%). Por outro lado, o único impacto positivo foi assinalado pelo grupamento de bens de capital para energia elétrica (5,2%).
Ainda no confronto com igual mês do ano anterior, o segmento de bens intermediários, ao recuar 2,1% no índice mensal de agosto de 2019, apontou a terceira taxa negativa seguida, mas com queda menos acentuada do que as verificadas em junho (-6,2%) e julho (-5,2%) últimos. O resultado desse mês foi explicado, principalmente, pelos recuos nos produtos associados às atividades de outros produtos químicos (-5,9%), de celulose, papel e produtos de papel (-9,7%), de indústrias extrativas (-1,8%), de produtos de borracha e de material plástico (-5,3%), de metalurgia (-1,5%), de produtos de minerais não-metálicos (-2,0%), de veículos automotores, reboques e carrocerias (-1,7%), de máquinas e equipamentos (-2,8%), de produtos de metal (-1,1%) e de produtos têxteis (-1,4%), enquanto as pressões positivas foram registradas por produtos alimentícios (5,7%) e coque, produtos derivados do petróleo e biocombustíveis (0,7%). Ainda nessa categoria econômica, vale citar também os resultados negativos assinalados pelos grupamentos de insumos típicos para construção civil (-0,4%) e de embalagens (-0,5%), com ambos revertendo os avanços observados no mês anterior: 3,2% e 1,6%, respectivamente.
O setor produtor de bens de consumo semi e não-duráveis recuou 0,7% em agosto de 2019 frente a igual período do ano anterior, após avançar 1,5% em julho último. O desempenho nesse mês foi explicado, em grande parte, pela redução observada no grupamento de alimentos e bebidas elaborados para consumo doméstico (-2,9%), pressionado, principalmente, pela menor fabricação de biscoitos e bolachas, bombons e chocolates em barras, carnes de bovinos congeladas, frescas ou refrigeradas, sorvetes e picolés, carnes e miudezas de aves frescas ou refrigeradas, massas alimentícias secas, vinhos de uvas, cervejas e chope. Vale citar também os resultados negativos assinalados pelos grupamentos de semiduráveis (-4,2%) e de não-duráveis (-2,7%), influenciados, em grande medida, pelos recuos registrados nos itens camisetas de malha, calças compridas (de malha ou não), calçados de couro masculino, tapetes e outros revestimentos têxteis para pavimentos, artefatos de alumínio para uso doméstico, vestidos de malha, tênis, conjuntos (de malha ou não) e calçados de borracha moldado, no primeiro; e medicamentos, impressos para fins publicitários ou promocionais em papel, produtos de beleza ou de maquilagem, preparações capilares, papel higiênico e inseticidas, no segundo. Por outro lado, o subsetor de carburantes (13,3%) apontou a única taxa positiva nessa categoria, impulsionado pela maior produção de gasolina automotiva e álcool etílico.
Em 2019, indústria acumula -1,7%
No índice acumulado para janeiro-agosto de 2019, frente a igual período do ano anterior, o setor industrial mostrou redução de 1,7%, com resultados negativos em uma das quatro grandes categorias econômicas, 16 dos 26 ramos, 47 dos 79 grupos e 55,2% dos 805 produtos pesquisados.
Entre as atividades, indústrias extrativas (-10,7%) exerceu a maior influência negativa na formação da média da indústria, pressionada, em grande medida, pelos itens minérios de ferro. Vale destacar também as contribuições negativas assinaladas pelos ramos de manutenção, reparação e instalação de máquinas e equipamentos (-9,9%), de outros equipamentos de transporte (-11,1%), de celulose, papel e produtos de papel (-3,3%), de equipamentos de informática, produtos eletrônicos e ópticos (-4,2%), de produtos de borracha e de material plástico (-2,2%), de produtos de madeira (-5,4%) e de produtos farmoquímicos e farmacêuticos (-2,7%), influenciados, principalmente, pelos itens serviços de manutenção e reparação de máquinas e equipamentos para usos industriais, de estruturas flutuantes e de máquinas e equipamentos para prospecção e extração mineral; embarcações para transporte de pessoas ou cargas (inclusive petroleiros e plataformas), aviões, partes e peças para veículos ferroviários e vagões de passageiros e para transporte de mercadorias; pastas químicas de madeira (celulose); transmissores ou receptores de telefonia celular, antenas, computadores pessoais portáteis (laptops, notebooks, tablets e semelhantes), computadores pessoais de mesa (PC desktops) e televisores; peças e acessórios de plástico para indústria automobilística, pneus novos para automóveis, artigos de plástico para uso doméstico e artigos descartáveis de plástico; madeira serrada, aplainada ou polida e painéis de fibras de madeira; e medicamentos.
Por outro lado, entre as nove atividades que apontaram ampliação na produção, a principal influência no total da indústria foi registrada por veículos automotores, reboques e carrocerias (2,1%), impulsionada, em grande parte, pela maior fabricação dos itens autopeças, caminhões, reboques e semirreboques, caminhão-trator para reboques e semirreboques e carrocerias para ônibus. Outras contribuições positivas relevantes sobre o total nacional vieram de produtos de metal (4,7%), de bebidas (2,9%) e de produtos de minerais não-metálicos (1,9%). Em termos de produtos, os impactos positivos mais importantes nesses ramos foram, respectivamente, construções pré-fabricadas de metal, recipientes de ferro e aço para transporte ou armazenagem de gases, latas de alumínio para embalagens, caldeiras geradoras de vapor, torres e pórticos de ferro e aço, revólveres e pistolas, aparelhos de barbear, artefatos de alumínio para uso doméstico, estruturas de ferro e aço em chapas ou em outras formas, parafusos, ganchos, pinos e outros artefatos de ferro e aço e artefatos diversos de ferro e aço estampado; cervejas e chope; e ladrilhos, placas e azulejos de cerâmica para pavimentação ou revestimento, garrafas, garrafões e frascos de vidro para embalagem, massa de concreto preparada para construção, cimentos “Portland” e elementos pré-fabricados para construção civil.
Entre as grandes categorias econômicas, o perfil dos resultados para os oito meses de 2019 mostrou menor dinamismo para bens intermediários (-2,8%), pressionada, sobretudo, pela redução verificada em indústrias extrativas (-10,7%), explicada, principalmente, pelos efeitos do rompimento de uma barragem de rejeitos de mineração na região de Brumadinho (MG) ocorrido em janeiro de 2019. Por outro lado, os setores produtores de bens de capital (0,7%), de bens de consumo duráveis (0,5%) e de bens de consumo semi e não-duráveis (0,2%) assinalaram as taxas positivas no índice acumulado no ano.
Produção industrial volta a crescer em agosto, mas ritmo ainda é menor que em 2018. Produtos derivados do petróleo e biocombustíveis cresceram 3,6%
Depois de três meses em queda, a produção da indústria nacional voltou a crescer 0,8% em agosto frente a julho. É o melhor resultado para meses de agosto desde 2014 (0,9%). A recuperação de quase toda a perda acumulada desde maio foi puxada pela indústria extrativa, que cresceu 6,6% no mês, graças ao aumento na extração de minério de ferro, petróleo e gás.
Apesar da alta em agosto, a indústria mostra perda de ritmo em relação ao ano passado, com o acumulado em 12 meses passando de -1,3%, em julho, para -1,7%. Frente a agosto de 2018, o total da indústria caiu 2,3%. Esses resultados são da Pesquisa Industrial Mensal, divulgada hoje pelo IBGE.
Produção industrial (mês/mês anterior)
Clique e arraste para zoom
Fonte: IBGE - Pesquisa Industrial Mensal - Produção Física
Com a quarta taxa positiva, a indústria extrativa acumula crescimento de 25,2% de maio a agosto. Segundo o gerente da pesquisa, André Macedo, após o desastre de Brumadinho, no final de janeiro, essa atividade mostrou quedas de produção por três meses. “A partir de maio, algumas plantas de extração de minério que haviam paralisado a produção para fazer adequações exigidas pelas leis ambientais voltaram a funcionar”, explicou.
Produtos derivados do petróleo e biocombustíveis, com alta de 3,6%, e produtos alimentícios, com crescimento de 2%, também contribuíram para o resultado da indústria em agosto. As principais influências negativas vieram de veículos automotores, que caíram 3% com a redução das exportações para a Argentina, devido à crise econômica naquele país, e do setor de vestuário, que recuou 7,4%.
“É claro que agosto mostra um crescimento, mas tem a característica de estar muito concentrado em uma das quatro grandes categorias econômicas e em 10 dos 26 ramos pesquisados. Ou seja, o perfil de expansão não está disseminado para outras atividades”, explicou André.
Entre as grandes categorias econômicas, bens intermediários foi a única taxa positiva, com alta de 1,4% na comparação com julho. Já o setor de bens de consumo duráveis teve o recuo mais intenso nesse mês, de 1,8%, após avançar 0,4% em julho. Os segmentos de bens de consumo semi e não duráveis e de bens de capital também assinalaram resultados negativos, ambos de -0,4%.
DOCUMENTO: https://agenciadenoticias.ibge.gov.br/agencia-sala-de-imprensa/2013-agencia-de-noticias/releases/25551-producao-industrial-cresce-0-8-em-agosto
CNI. 01/10/2019. Faturamento e horas trabalhadas na indústria crescem 0,6%, informa CNI. Indicadores Industriais mostram que, mesmo com desempenho positivo, a atividade no setor continua fraca. Emprego ficou estável e massa real de salários e rendimento médio do trabalhador diminuíram em agosto

A atividade da indústria brasileira melhorou em agosto. O faturamento do setor aumentou 0,6% em relação a julho na série livre de influências sazonais. Foi o terceiro aumento consecutivo do índice. As horas trabalhadas na produção também cresceram 0,6% em agosto frente a julho na série de dados dessazonalizados. A utilização da capacidade instalada cresceu 0,1 ponto percentual e alcançou 78,1%, informa a pesquisa Indicadores Industriais, divulgada nesta terça-feira (1º), pela Confederação Nacional da Indústria (CNI).
Mesmo com o desempenho positivo de agosto, os índices de atividade estão próximos aos de 2018, ano que foi fraco para a indústria, observa a CNI. “Os índices de faturamento, horas trabalhadas e utilização da capacidade instalada seguem inferiores aos registrados em agosto do ano passado”, afirma a pesquisa. Na comparação com agosto do ano passado, o faturamento teve queda de 5,7%, as horas trabalhadas na produção recuaram 1,3%. A utilização da capacidade instalada ficou 0,2 ponto percentual menor do que a do mesmo mês do ano passado.
Os indicadores de mercado de trabalho também são negativos. Em agosto, o emprego aumentou apenas 0,1%, a massa real de salários diminuiu 0,7% e o rendimento médio real dos trabalhadores recuou 0,4% na comparação com julho, considerando as séries com ajuste sazonal. Em relação a agosto do ano passado, o emprego teve queda de 0,2%, a massa real de salários encolheu 1,2% e o rendimento médio do trabalhador caiu 0,9%.
“A expectativa é que o ritmo atual de recuperação se mantenha nos próximos meses. Não há, contudo, perspectiva de aceleração desse movimento, de forma que o resultado da indústria para 2019 dificilmente irá se descolar muito do de 2018. A indústria ainda tem estoques em excesso e não há expectativa que a demanda se acelere muito até o fim do ano, limitando o ritmo de atividade do setor”, afirma o economista da CNI Marcelo Azevedo.
CAPITAL ESTRANGEIRO
BACEN. 1º de outubro de 2019. BC passa a autorizar participação de capital estrangeiro em instituições financeiras brasileiras
Decreto publicado na última sexta-feira (27) também prevê que a Autoridade Monetária autorize instalação no país de novas agências de IFs estrangeiras.
Entrou em vigor decreto presidencial que autoriza o Banco Central (BC) a reconhecer, como de interesse do governo brasileiro, a instalação no país de novas agências de instituições financeiras (IFs) estrangeiras e o aumento da participação dos investidores estrangeiros no capital de IFs brasileiras. O Decreto nº 10.029, de 26 de setembro de 2019, publicado na última sexta-feira (27), visa dar igualdade de tratamento aos investidores estrangeiros em relação aos domésticos.
Antes da alteração, o pedido de instalação de novas agências de IFs estrangeiras ou de investimento estrangeiro no Sistema Financeiro Nacional (SFN) era analisado tecnicamente pelo BC, e depois encaminhado ao Conselho Monetário Nacional, que, posteriormente, remetia o processo à Casa Civil. Dali, a matéria seguia para a Presidência da República para reconhecimento do interesse do governo brasileiro, de acordo com o disposto no art. 52 dos Atos das Disposições Constitucionais Transitórias (ADCT) da Constituição Federal. Se houvesse interesse, era emitido um decreto para cada pedido.
Agora, com o decreto presidencial, o Banco Central continuará fazendo a mesma análise técnica, num processo similar àquele adotado pelos investidores domésticos que querem investir no SFN. Feito isso, por delegação do presidente da República, também reconhecerá o interesse do governo brasileiro na participação, tornando desnecessária a edição de um decreto para cada caso.
A mudança trará mais agilidade ao processo de entrada de novos agentes no SFN, trazendo boas perspectivas quanto à melhora na qualidade dos serviços financeiros prestados e na redução dos custos para os clientes, mediante a promoção de um ambiente com maior concorrência entre os participantes do sistema.
INFLAÇÃO
FGV. IBRE. 01/10/19. Índices Gerais de Preços. IPC-S. Inflação pelo IPC-S encerra setembro acumulando alta de 3,51% nos últimos 12 meses
O IPC-S de 30 de setembro de 2019 não registrou variação, ficando 0,01 ponto percentual (p.p) abaixo da taxa apurada na última divulgação. Com este resultado, o indicador acumula alta de 2,90% no ano e 3,51% nos últimos 12 meses.
Nesta apuração, três das oito classes de despesa componentes do índice registraram decréscimo em suas taxas de variação. A maior contribuição partiu do grupo Habitação (0,35% para 0,22%). Nesta classe de despesa, cabe mencionar o comportamento do item tarifa de eletricidade residencial, cuja taxa passou de 1,10% para 0,27%.
Também registraram decréscimo em suas taxas de variação os grupos: Vestuário (0,08% para 0,01%) e Despesas Diversas (0,06% para 0,04%). Nestas classes de despesa, vale destacar o comportamento dos itens: calçados (-0,17% para -0,32%) e serviço religioso e funerário (0,24% para -0,18%).
Em contrapartida, os grupos Transportes (0,06% para 0,16%), Educação, Leitura e Recreação (0,25% para 0,31%), Saúde e Cuidados Pessoais (0,24% para 0,29%) e Alimentação (-0,68% para -0,67%) apresentaram avanço em suas taxas de variação. Nestas classes de despesa, vale citar os itens: serviço de reparo em automóvel (0,03% para 0,65%), show musical (1,55% para 2,22%), artigos de higiene e cuidado pessoal (-0,11% para 0,37%) e hortaliças e legumes (-12,08% para -11,03%).
O grupo Comunicação repetiu a taxa de variação registrada na última apuração, que foi de 0,54%. As principais influências partiram dos itens: tarifa de telefone móvel (1,24% para 1,47%), em sentido ascendente, e tarifa de telefone residencial (0,50% para 0,19%), em sentido descendente.
DOCUMENTO: https://portalibre.fgv.br/navegacao-superior/noticias/inflacao-pelo-ipc-s-encerra-setembro-acumulando-alta-de-3-51-nos-ultimos-12-meses.htm
CONFIANÇA EMPRESARIAL
FGV. IBRE. 01/10/19. Sondagens e Índices de Confiança. Índice de Confiança Empresarial. Confiança Empresarial fica estável em setembro e retorna a nível médio do 4ºTri de 2018
O Índice de Confiança Empresarial (ICE) da Fundação Getulio Vargas (FGV IBRE) subiu 0,1 ponto em setembro de 2019, para 94,1 pontos. Na média do terceiro trimestre, o índice cresceu 1,2 ponto em relação ao trimestre anterior, retornando ao nível médio do quarto trimestre de 2018.
“A confiança empresarial ficou estável em setembro, refletindo uma percepção ainda desfavorável com relação à situação corrente dos negócios e otimismo moderado com a perspectiva de melhora ao longo dos próximos meses”, afirma Aloisio Campelo Jr., Superintendente de Estatísticas Públicas da FGV IBRE.
O Índice de Confiança Empresarial (ICE) consolida os índices de confiança dos quatro setores cobertos pelas Sondagens Empresariais produzidas pela FGV IBRE: Indústria, Serviços, Comércio e Construção.
O Índice de Situação Atual (ISA-E) ficou estável em setembro, em 91,1 pontos, enquanto o Índice de Expectativas (IE-E) subiu 0,6 ponto, para 101,6 pontos. Na média do terceiro trimestre, o índice que retrata a percepção atual subiu 0,8 ponto em relação ao trimestre anterior. Já o índice que retrata as expectativas do empresariado para os próximos meses, avançou 2,7 pontos na mesma métrica.
Entre os setores que integram o ICE, o comportamento também tende à estabilização ao final do terceiro trimestre. Naqueles que mais avançaram nos meses anteriores, como o Comércio e Construção, houve queda de 1,5 e 0,5 ponto, respectivamente, em setembro. No setor de Serviços, que havia amargado perda no mês anterior, houve alta de 1,7 ponto. A confiança da Indústria, que havia avançado discretamente no mês anterior, ficou estável em setembro.
“Além de registrar recuo da confiança no terceiro trimestre, a indústria é o segmento com menor grau otimismo em setembro. Isso ocorre de uma combinação de fatores tanto internos, como o ritmo lento de crescimento da demanda, provocando acúmulo de estoques, quanto externos, como as dificuldades que vem enfrentando a Argentina e a possibilidade de uma desaceleração mais forte da economia mundial em 2020”, afirma Aloisio Campelo Jr.
Difusão da Confiança
Em setembro, a confiança avançou em 49% dos 49 segmentos que integram o ICE, um número menos favorável que os 55% do mês anterior. O destaque positivo do mês, é o setor de Serviços em que a difusão de alta superou os 80%. Já o destaque negativo fica com o Comércio, com a disseminação de alta da confiança, em setembro, em apenas 17% dos segmentos.
DOCUMENTO: https://portalibre.fgv.br/navegacao-superior/noticias/confianca-empresarial-fica-estavel-em-setembro-e-retorna-a-nivel-medio-do-4tri-de-2018.htm
COMÉRCIO EXTERIOR BRASILEIRO
MEconomia. PORTAL G1. 01/10/2019. Balança comercial tem superávit de US$ 2,24 bilhões em setembro, menor para o mês em 5 anos. No ano, saldo positivo soma US$ 33,8 bi, 19% menos que no mesmo período de 2018. Previsão para o ano do Ministério da Economia baixa de US$ 58,3 bi em 2018 para US$ 41,8 bi em 2019.
Por Alexandro Martello, G1 — Brasília
O Ministério da Economia informou nesta terça-feira (1º) que a balança comercial registrou superávit de US$ 2,246 bilhões em setembro deste ano.
Se as exportações superam as importações, o resultado é de superávit. Se acontece o contrário, o resultado é de déficit.
De acordo com o governo federal, ao todo, as exportações somaram US$ 18,740 bilhões em setembro, e as importações, US$ 16,429 bilhões.
O saldo positivo do mês passado representa queda de 55% na comparação com o mesmo período do ano passado, quando o superávit chegou a US$ 5,071 bilhões. Esse também foi o pior resultado para o mês desde 2014, ou seja, em cinco anos.
Balança Comercial
Para meses de setembro, em US$ bilhões
2018
5.071
5.071
Fonte: Ministério da Economia
Segundo o Ministério da Economia, as exportações tiveram queda de 11,6% na comparação com setembro do ano passado. Já as importações registraram alta de 5,7%.
No caso das exportações, houve recuo de 14,5% na venda de produtos básicos, de 32,1% de produtos semimanufaturados e um aumento de 4,4% nos produtos manufaturados.
Nas importações, o governo federal informou que subiram as compras de bens de capital (95%), mas recuaram as aquisições bens de consumo (-8,5%), de bens intermediários (-3,9%) e de combustíveis e lubrificantes (-6,7%).
Parcial do ano
No acumulado dos nove primeiros meses deste ano, o governo federal informou que o saldo da balança ficou positivo em US$ 33,790 bilhões.
O superávit comercial, com isso, teve queda de 19% na comparação com o mesmo período do ano passado, quando o resultado foi de US$ 41,737 bilhões.
Esse também foi o pior resultado, para esse período, em três anos, ou seja, desde 2015 - quando foi registrado um superávit de US$ 10,175 bilhões.
No acumulado deste ano, de acordo com o Ministério da Economia, as exportações somaram US$ 167,739 bilhões, com média diária de US$ 885 milhões (queda de 6% na comparação com o mesmo período do ano passado).
As importações totalizaram US$ 133,589 bilhões, com média diária de US$ 706 milhões (queda de 1,8% em relação ao mesmo período de 2018).
Mercados compradores
De acordo com o governo, os principais compradores de produtos brasileiros no acumulado deste ano foram:
- China, Hong Kong e Macau: US$ 48,037 bilhões;
- Estados Unidos: US$ 21,801 bilhões;
- Países Baixos: US$ 8,084 bilhões;
- Argentina: US$ 7,474 bilhões;
- Chile: US$ 3,830 bilhões.
Saldo e projeções
No ano passado, a balança comercial registrou superávit de US$ 58,3 bilhões. Com isso, o saldo positivo, assegurado principalmente pela exportação de produtos básicos, ficou 13% abaixo do de 2017.
A expectativa do mercado financeiro para este ano é de nova queda do superávit comercial. Segundo pesquisa realizada pelo Banco Central na semana passada, a previsão para 2019 é de um saldo positivo de US$ 51,71 bilhões nas transações comerciais do país com o exterior.
O Banco Central, por sua vez, prevê um superávit da balança comercial de US$ 43 bilhões para este ano.
O Ministério da Economia baixou nesta terça-feira a previsão de que o saldo positivo da balança comercial para este ano de US$ 56,7 bilhões para US$ 41,8 bilhões, com US$ 222 bilhões de exportações e US$ 180,4 bilhões de compras do exterior.
Com isso, a previsão oficial do governo é de que o superávit comercial, em 2019, seja o pior, para um ano fechado, desde 2015 - quando o saldo positivo somou US$ 19,512 bilhões.
"O Brasil está nesse cenário de retração da economia mundial. Um dos principais motivos que os organismos internacionais apontam é a guerra comercial", avaliou o disse o diretor do Departamento de Estatística e Apoio à Exportação do MDIC, Herlon Brandão.
MEconomia. REUTERS. 1 DE OUTUBRO DE 2019. Balança comercial brasileira tem pior setembro em 5 anos e governo reduz projeção de saldo anual
Por Marcela Ayres
BRASÍLIA (Reuters) - A balança comercial brasileira registrou superávit de 2,246 bilhões de dólares em setembro, informou o Ministério da Economia nesta terça-feira, no pior resultado para o mês desde 2014, quando houve déficit de 946,4 milhões de dólares.
Fortemente afetado pelo recuo nas exportações, o dado também veio abaixo da expectativa de um saldo positivo de 3,2 bilhões de dólares, conforme pesquisa Reuters com analistas.
Em setembro, as vendas de produtos brasileiros ao exterior caíram 11,6% ante igual mês de 2018, pela média diária, chegando a 18,740 bilhões de dólares.
Houve queda de 32,1% nas exportações de produtos semimanufaturados e de 14,5% na de básicos, com destaque, neste último grupo, para a redução de 37,7% — ou 1,79 bilhão de dólares — nas vendas de petróleo em bruto.
Já as vendas produtos manufaturados subiram 4,4% em relação a igual mês de 2018.
Em relação às importações, houve aumento de 5,7% em setembro sobre um ano antes, a 16,494 bilhões de dólares.
Neste caso, as compras de bens de capital cresceram 95,1% sobre setembro do ano passado, ao passo que houve redução em todas as demais categorias: bens de consumo (-8,5%), combustíveis e lubrificantes (-6,7%) e bens intermediários (-3,9%).
ANO
No acumulado dos nove primeiros meses do ano, a balança comercial ficou positiva em 33,79 bilhões de dólares, recuo de 19,5% sobre igual etapa do ano passado considerando a média diária.
Para o ano, o Ministério da Economia prevê agora um superávit de 41,8 bilhões de dólares, sobre 56,7 bilhões de dólares antes.
“O Brasil está neste cenário de retração no comércio mundial por conta de menor atividade econômica mundial”, afirmou o subsecretário de Inteligência e Estatística de Comércio Exterior, Herlon Brandão, complementando que a guerra comercial entre Estados Unidos e China é apontada como um dos principais motivos para esse movimento.
Ele lembrou que a equipe econômica já havia ponderado que, no curto prazo, poderia haver algum benefício de curto prazo para o Brasil em função da guerra comercial, notadamente nos embarques de soja, mas que no agregado haveria prejuízo para economia como um todo.
Para Brandão, essa foi uma leitura acertada. Ele lembrou que, em meio à peste suína, diminuiu o abate dos animais na China. Com menos porcos comendo farelo de soja, a demanda pelo produto acabou afetada neste ano.
Brandão também destacou que a Argentina, mergulhada em crise econômica, tem comprado menos bens do Brasil, principalmente automóveis, afetando o desempenho das exportações.
“Argentina está nesse impacto da retração da economia mundial, é um dos principais parceiros comerciais do Brasil”, pontuou o subsecretário, frisando que 70% das exportações de automóveis vão para o país vizinho.
Diante desse quadro, inclusive, a Argentina pode ter perdido para os Estados Unidos o posto de maior mercado para manufaturados brasileiros, disse Brandão.
Na semana passada, o Banco Central informou que passou a ver um superávit de 43 bilhões de dólares para as trocas comerciais neste ano, sobre 46 bilhões de dólares antes.
Já economistas ouvidos pelo BC na mais recente pesquisa Focus estimam que o superávit comercial no ano será de 51,71 bilhões de dólares.
edição de Isabel Versiani
________________
LGCJ.: