FUNAG / PUBLICAÇÕES
MRE. FUNAG. IPRI. Lançamento - Cadernos de Política Exterior do IPRI número 8
A Fundação Alexandre de Gusmão (FUNAG) lançou os Cadernos de Política Exterior do IPRI número 8, disponível para download gratuito no portal da FUNAG na internet. A publicação conta com dez artigos, de autoria do ministro de Estado das Relações Exteriores, do embaixador Alberto da Costa e Silva, do embaixador Carlos Márcio Bicalho Cozendey, entre outros.
Sumário
- Globalismo: uma visão a partir do pensamento de Nietzsche, Ernesto Henrique Fraga Araújo.
- A África no Brasil, Alberto da Costa e Silva.
- Diretrizes para Difusão da Língua Portuguesa pelo Brasil no Exterior, Bruno Miranda Zétola
- O pedido de acessão do Brasil à OCDE: onde estamos, Carlos Márcio Cozendey
- Brasil e União Europeia nas negociações agrícolas da OMC: uma insólita parceria, Emerson Coraiola Yinde Kloss
- Inteligência artificial, paz e segurança: desafios para o Direito Internacional Humanitário, Eugênio Vargas Garcia
- Tribunal Penal Africano? A conflituosa relação entre o Tribunal Penal Internacional e a África, Michael Nunes Lawson
- Brasil e Índia: uma relação econômica a demandar ajustes, Renato Baumann
- Crime organizado transnacional: Convenção de Palermo e a contribuição brasileira, Ricardo dos Santos Poletto
- A competitividade brasileira na indústria de alta tecnologia: o modelo aeronáutico, Ricardo Henrique Correia dos Santos
Publicação
A Fundação Alexandre de Gusmão (FUNAG) publica a oitava edição dos "Cadernos de Política Exterior", revista editada pelo seu Instituto de Pesquisa de Relações Internacionais (IPRI). A presente edição reúne dez artigos – escritos por diplomatas, acadêmicos e especialistas – sobre relações internacionais e a política externa brasileira.
A publicação inicia-se com artigo do ministro das Relações Exteriores, embaixador Ernesto Araújo, adaptado de sua palestra proferida na abertura do seminário sobre globalismo – evento promovido pela FUNAG em 10 de junho de 2019. Na sequência, apresenta-se texto do embaixador Alberto da Costa e Silva, elaborado por ocasião da celebração do Dia da África, em 27 de maio de 2019, em evento realizado no Itamaraty.
O diplomata e historiador Bruno Miranda Zétola reflete, em seu artigo, sobre o importante papel do Itamaraty no processo de internacionalização da língua, cultura e economias criativas brasileiras. Os Cadernos trazem, ainda, texto do embaixador Carlos Márcio Cozendey, com reflexão sobre a adesão do Brasil à Organização para a Cooperação e Desenvolvimento Econômico (OCDE) e as razões que justificam o interesse brasileiro em se tornar membro da Organização.
Ensaio do conselheiro Emerson Coraiola Yinde Kloss versa sobre as tratativas entre Brasil e União Europeia no processo reparatório da 10ª Conferência Ministerial (CM10) da Organização Mundial de Comércio (OMC), realizada em Nairóbi em 2015.
Tendo como pano de fundo o impacto estratégico da inteligência artificial nas relações internacionais, o ministro Eugênio Vargas Garcia analisa a questão dos sistemas de armas autônomas letais e suas implicações.
Por sua vez, o diplomata Michael Nunes Lawson investiga como o continente africano, representado pela União Africana, passou de firme apoiador a obstinado opositor do Tribunal Penal Internacional (TPI).
O economista Renato Baumann discorre sobre a relação econômica bilateral Brasil-Índia e possíveis estratégias para aprofundá-la e consolidá-la.
O diplomata Ricardo dos Santos Poletto reflete sobre as origens, os limites e a contribuição da Convenção das Nações Unidas contra o Crime Organizado Transnacional (UNTOC), por meio de releitura de sua trajetória como construção política necessária para lidar com desafios emergentes da agenda global.
Por fim, os Cadernos trazem texto do major aviador Ricardo Henrique Correia dos Santos, que investiga a produção de alta tecnologia no segmento aeronáutico e a sua importância para o crescimento da economia nacional.
PUBLICAÇÃO: http://funag.gov.br/biblioteca/download/CadernosN%C2%BA8.pdf
________________
US ECONOMICS
COLOMBIA
U.S. Department of State. 10/09/2019. Secretary Michael R. Pompeo And Colombian Foreign Minister Carlos Holmes Trujillo. Michael R. Pompeo, Secretary of State. Washington, D.C. Treaty Room
SECRETARY POMPEO: Thank you all for being with us this morning. It’s my great honor to welcome my friend Foreign Minister Trujillo back to Washington for the U.S.-Colombia High Level Dialogue. It’s the fourth meeting that you and I have had this year.
This regular dialogue shows that the United States values our friendship with Colombia – a relationship rooted in a shared set of values, a commitment to democracy, the rule of law, and fundamental human rights.
President Duque’s administration deserves great credit for this close partnership. Just two decades ago, Colombia was gripped by violence and corruption. No more. We’ve been proud to support your efforts to reclaim and rebuild your nation, Mr. Foreign Minister, and we thank you for your great partnership.
Today our teams will talk about a number of topics, and we will build on those solid foundations for the good of your country, the United States, and, indeed, the broader region.
We’ll certainly address narcotics. The United States has a significant stake in the outcome of Colombia’s crackdown on the production of and trafficking of narcotics. That’s why we join President Duque in setting an ambitious goal to reduce coca cultivation and cocaine by half by the end of 2023.
We’ve seen signs of progress. We just had the chance to chat about that. Last year, coca cultivation decreased for the first time since 2012. More than 86,000 hectares of coca were eradicated – 20 percent more than we had set as our joint goal.
Much more work needs to be done. Today we’ll discuss how to expand our counternarcotics efforts to achieve and sustain the ambitious five-year goal that we set.
We’ll also address Colombia’s valiant humanitarian efforts to support the now 1.6 million people who have fled Venezuela and come to Colombia.
To date, the United States has provided more than $250 million to aid Colombia in its response to the Venezuelan crisis, and our support is ongoing and continuing.
Just this past month, at the U.N. General Assembly, I announced nearly $119 million in new funding to support relief efforts throughout the region.
And since 2018, we have twice deployed the U.S. Navy Ship Comfort on medical missions to the region, stopping each time in Colombia.
As I’ve shared with the foreign minister today, we stand ready to do even more to support Colombia’s heroic efforts to save lives and stabilize the region.
And then finally, we’ll talk about an important topic: how we strengthen our economic ties between the two countries. There’s real good progress already underway.
Colombia’s per capita GDP has doubled since 2000, and poverty has declined from one in five to one in 25.
That’s been a lot of hard work by Colombia and its people, but the United States has helped as well. We’re Colombia’s largest trade and investment partner, and our trade supports hundreds of thousands of jobs in each of our two countries.
I know we can do more, and I look forward to the continued discussions throughout the day amongst our teams to deliver on this commitment.
When I last visited Latin America in April, I explained the Trump administration’s ultimate goal in the region, which is to cement a future of democracy, peace, and prosperity.
As I said then, it’s not an impossible dream. Nor it is a foregone conclusion. We will all have to work on this together.
Colombia is proof – is proof that the dream is indeed possible and that hard work pays off. And today, that work continues.
Foreign Minister Trujillo, thank you and your delegation for being here. I invite you now to make a statement.
FOREIGN MINISTER TRUJILLO: Thank you very much, Mr. Secretary. Good morning, everyone. As Colombia’s minister of foreign affairs, it is an honor for – to meet you all today as we open the eighth meeting of the U.S.-Colombia High Level Dialogue. On behalf of the entire Colombian delegation, thank you, Secretary Pompeo, for the warm welcome and your hospitality here at the Department of State.
Today I am joined by a delegation of Colombian Government officials who will have leaded three areas of our high-level dialogue with the United States: security, economic prosperity, and democratic governance. Dating back to its beginnings in 2010, the high-level mechanism has sought to strengthen the U.S.-Colombia strategic partnership and diversify our bilateral agenda, working together toward our mutual prosperity. Since then, Mr. Secretary, multiple projects have come to fruition and benefitted both Americans and Colombians. Our accomplishments through the high-level dialogue include U.S. support for the Colombia’s admission to the OECD, improved cooperation in humanitarian de-mining, Colombia gaining access to the Global Entry program and increased educational exchanges, just to name a few.
We are committed to continuing down this path and setting out measurable, high-impact commitments. Ahead of this year’s session, I would like to briefly address three key issues that are at the top of our agenda and which demonstrate the efficacy of the high-level dialogue: the Venezuelan crisis, achieving prosperity and equality, and the fight against drugs.
The Venezuelan crisis: We will continue to work through all political and diplomatic means jointly with the countries of the Lima Group, jointly with the United States, jointly with the Organization of American States, and other democracies across the world, to create a condition that will lead to positive change in Venezuela. We will implement required sanctions to keep isolating the Maduro regime. Colombia is deeply grateful for the continued U.S. support to assist more than 1.4 million Venezuelan migrants in Colombia.
Achieving prosperity and equality: We are working to further boost economic trade and trade relations between the United States and Colombia. One example of this partnership occurred last May, when President Ivan Duque and U.S. Secretary of Energy Rick Perry signed an agreement for both countries to advance renewable and nonconventional energy sources, diversify our energy matrix, and make Colombia more attractive to investment in energy projects.
The fight against the global drug problem: The Colombian Government is committed more than ever to reducing areas cultivated with coca crops by 50 percent in two – in 2023. So far this year we have achieved more than 75 percent of the annual goal of eradicating 80,000 hectares of illicit crops.
Despite challenges in our hemisphere and across the globe, Colombia and the United States stand together in promoting common interests and values such as liberty, democracy, and the rule of law. These mutual values will continue to guide our actions in delivering prosperity for our peoples. Our delegation looks forward to this year’s session and deepening our political and commercial relations through close dialogue with the United States. Thank you very much.
SECRETARY POMPEO: Thank you.
U.S. Department of State. 10/10/2019. Secretary Michael R. Pompeo’s Meeting with Foreign Minister of Colombia Carlos Trujillo
The below is attributable to Spokesperson Morgan Ortagus:
Secretary of State Michael R. Pompeo met with Colombian Foreign Minister Carlos Holmes Trujillo yesterday in Washington, D.C., to inaugurate the eighth U.S.-Colombia High Level Dialogue featuring discussions on cooperation on security and counternarcotics, increasing economic prosperity, and strengthening democratic governance. Secretary Pompeo underscored continued U.S. support for Colombia’s coca eradication efforts and expanded police presence in rural areas to sustain counternarcotics gains, as well as for Colombia’s efforts to secure a lasting peace. Secretary Pompeo and Foreign Minister Trujillo also discussed the Maduro-generated crisis in Venezuela and its enormous burden on Colombia and the region. The Secretary expressed gratitude for Colombia’s continued democratic leadership and extraordinary generosity in hosting Venezuelan refugees.
EL SALVADOR
U.S. Department of State. 10/10/2019. Secretary Michael R. Pompeo’s Meeting with Salvadoran Foreign Minister Hill
The below is attributable to Spokesperson Morgan Ortagus:
Secretary of State Michael R. Pompeo met today with Salvadoran Foreign Minister Alexandra Hill in Washington, D.C. Secretary Pompeo and Foreign Minister Hill discussed the strong partnership between the United States and El Salvador, including supporting democracy in the Western Hemisphere. The Secretary underscored the importance of our shared commitment to democracy in Venezuela and reiterated U.S. support for interim President Juan Guaidó. The Secretary and the Foreign Minister also discussed the importance of U.S.‑Salvadoran cooperation in stemming illegal immigration to the United States.
SOUTH AFRICA
U.S. Department of State. 10/10/2019. Global Magnitsky Sanctions against Corruption Network in South Africa. Michael R. Pompeo, Secretary of State
Today, the U.S. Department of the Treasury’s Office of Foreign Assets Control (OFAC) sanctioned four individuals for corruption in South Africa pursuant to Executive Order 13818, which builds upon and implements the Global Magnitsky Human Rights Accountability Act. Specifically, OFAC designated Ajay Gupta, Atul Gupta, Rajesh Gupta, and Salim Essa for their involvement in corrupt schemes with government officials and employees in state-owned enterprises for their own personal gain. As a result of today’s actions, any property, or interest in property, of those designated within U.S. jurisdiction is blocked. Additionally, U.S. persons are generally prohibited from engaging in transactions with blocked persons, including entities owned or controlled by designated persons.
Today’s action demonstrates continued U.S. commitment to promoting transparency, accountability, and the rule of law globally. We commend the critical role played by South Africa’s civil society activists, whistleblowers, and investigative journalists to shine the spotlight on the Gupta network’s elicitation of criminal abuse of public office and other acts of corruption, which have deterred investment and impeded South Africa’s economic growth. The United States strongly supports ongoing efforts by the Government of South Africa, including its independent judiciary, judicial commissions of inquiry, and law enforcement agencies, to investigate and prosecute alleged instances of corruption. Successfully prosecuting and deterring corruption is essential to building a future of accountable government that fosters economic growth and opportunity for all of South Africa’s citizens.
U.S. Department of the Treasury. 10/10/2019. Treasury Sanctions Members of a Significant Corruption Network in South Africa. Global Magnitsky designations target members of family business engaged in corruption, including bribery and misappropriation of state assets
Washington – Today, the U.S. Department of the Treasury’s Office of Foreign AssetsControl (OFAC) sanctioned members of a significant corruption network in South Africa that leveraged overpayments on government contracts, bribery, and other corrupt acts to fund political contributions and influence government actions. Specifically, OFAC designated Ajay Gupta, Atul Gupta, Rajesh Gupta, and Salim Essa for their involvement in corruption in South Africa pursuant to Executive Order (E.O.) 13818, which builds upon and implements the Global Magnitsky Human Rights Accountability Act.
“The Gupta family leveraged its political connections to engage in widespread corruption and bribery, capture government contracts, and misappropriate state assets. Treasury’s designation targets the Guptas’ pay-to-play political patronage, which was orchestrated at the expense of the South African people,” said Sigal Mandelker, Treasury Under Secretary for Terrorism and Financial Intelligence. “The Guptas and Essa have used their influence with prominent politicians and parties to line their pockets with ill-gotten gains. We will continue to exclude from the U.S. financial system those who profit from corruption.”
Today’s sanctions announcement demonstrates the U.S. government’s unwavering commitment to supporting the rule of law and accountability in South Africa. We support the anti-corruption efforts of South Africa’s independent judiciary, law enforcement agencies, and the ongoing judicial commissions of inquiry. Moreover, we commend the extraordinary work by South Africa’s civil society activists, investigative journalists, and whistleblowers, who have exposed the breadth and depth of the Gupta family’s corruption.
THE GUPTA FAMILY
Ajay, Atul, and Rajesh Gupta immigrated to South Africa in the 1990s, and due in large part to their generous donations to a political party and their reportedly close relationship with former South African President Jacob Zuma, their business interests expanded. The family has been implicated in several corrupt schemes in South Africa, allegedly stealing hundreds of millions of dollars through illegal deals with the South African government, obfuscated by a shadowy network of shell companies and associates linked to the family.
Credible reports of these corruption schemes include the Gupta family offering members of the South African government money or elevated positions within the government, in return for their cooperation with Gupta family business efforts. Public reporting has revealed Gupta family efforts to garner the cooperation of a potential Minister of Finance by promising millions of dollars in return for the individual’s assistance in removing key members of the South African government who were considered to be stumbling blocks to the Gupta family’s enterprises. In another instance of an attempt to obtain the assistance of a member of government through illicit means, Rajesh reportedly promised a cut of a large scale development project to a provincial minister in return for the minister’s assistance. While making this offer, Rajesh reportedly referred to two other politically powerful individuals present at the meeting as receiving large monthly payments, similar to the one being offered the provincial minister, directly from Rajesh in return for their assistance with a mining project. In addition, the Gupta family was overpaid for government contracts and then used a portion of the proceeds of those overpayments to donate money to a South African political party. Further, the family paid money to a South African government official in exchange for the appointment of other government officials friendly to the Gupta family business interests. As a part of their corrupt business enterprise, South African government officials and business executives discussed ways to capture government contracts and then move the proceeds of those contracts through Gupta-owned businesses.
AJAY GUPTA
Ajay Gupta (Ajay) is being designated for being the leader of an entity that has engaged in, or whose members have engaged in, corruption, including the misappropriation of state assets, the expropriation of private assets for personal gain, corruption related to government contracts or the extraction of natural resources, or bribery.
Ajay is the family patriarch who formulated the family’s corrupt business strategies and controlled its finances.
ATUL GUPTA
Atul Gupta (Atul) has materially assisted, sponsored, or provided financial, material, technological support for, or goods or services to or in support of, an entity that has engaged in, or whose members have engaged in, corruption, including the misappropriation of state assets, the expropriation of private assets for personal gain, corruption related to government contracts or the extraction of natural resources, or bribery.
Atul is widely known to have overseen the Gupta family’s outreach to corrupt government officials.
RAJESH GUPTA
Rajesh Gupta (Rajesh) has materially assisted, sponsored, or provided financial, material, technological support for, or goods or services to or in support of, an entity that has engaged in, or whose members have engaged in, corruption, including the misappropriation of state assets, the expropriation of private assets for personal gain, corruption related to government contracts or the extraction of natural resources, or bribery.
Rajesh cultivated important relationships with the sons of powerful South African politicians and led efforts to pursue business and relationships in a South African province where corruption was rampant. Rajesh attempted to use at least one of those relationships to seek undue influence with additional members of a South African political party.
SALIM ESSA
Salim Essa, a business associate of the Gupta family, has materially assisted, sponsored, or provided financial, material, technological support for, or goods or services to or in support of, an entity that has engaged in, or whose members have engaged in, corruption, including the misappropriation of state assets, the expropriation of private assets for personal gain, corruption related to government contracts or the extraction of natural resources, or bribery.
As a result of today’s action, all property and interests in property of the individuals named above, and of any entities that are owned, directly or indirectly, 50 percent or more by them, individually, or with other designated persons, that are in the United States or in the possession or control of U.S. persons, are blocked and must be reported to OFAC. Unless authorized by a general or specific license issued by OFAC or otherwise exempt, OFAC’s regulations generally prohibit all transactions by U.S. persons or within (or transiting) the United States that involve any property or interests in property of designated or otherwise blocked persons. In addition, any approval, financing, facilitation, or guarantee by a U.S. person, wherever located, of a transaction by a foreign person where the transaction by that foreign person would be prohibited by E.O. 13818 if performed by a U.S. person or within the United States would be prohibited.
GLOBAL MAGNITSKY
Building upon the Global Magnitsky Human Rights Accountability Act, on December 20, 2017, the President signed E.O. 13818, in which the President found that the prevalence of human rights abuse and corruption that have their source, in whole or in substantial part, outside the United States, had reached such scope and gravity that it threatens the stability of international political and economic systems. Human rights abuse and corruption undermine the values that form an essential foundation of stable, secure, and functioning societies; have devastating impacts on individuals; weaken democratic institutions; degrade the rule of law; perpetuate violent conflicts; facilitate the activities of dangerous persons; and undermine economic markets. The United States seeks to impose tangible and significant consequences on those who commit serious human rights abuse or engage in corruption, as well as to protect the financial system of the United States from abuse by these same persons.
To date, the Department of the Treasury has designated 118 individuals and entities under E.O. 13818. This figure is in addition to the numerous human rights- or corruption-related designations Treasury has issued under other various authorities. In total, since January of 2017, Treasury has taken action against more than 680 individuals and entities engaged in activities related to, or directly involving, human rights abuse or corruption.
Information on the individuals and entities designated today. Global Magnitsky Designations; Iran-related Designations Updates; Counter Terrorism Designations Update; Non-proliferation. OFFICE OF FOREIGN ASSETS CONTROL. Specially Designated Nationals List Update
The following individuals have been added to OFAC's SDN List:
- ESSA, Salim (a.k.a. ESSA, Salim Aziz), Johannesburg, South Africa; DOB 15 Jan 1978; nationality South Africa; Gender Male; Passport M00073786 (South Africa) issued 09 Nov 2012 expires 08 Nov 2022; National ID No. 7801155017084 (South Africa) (individual) [GLOMAG].
- GUPTA, Ajay (a.k.a. GUPTA, Ajay Kumar), Dubai, United Arab Emirates; DOB 05 Feb 1966; POB Saharanpur, India; nationality India; Gender Male (individual) [GLOMAG].
- GUPTA, Atul (a.k.a. GUPTA, Atul Kumar), Dubai, United Arab Emirates; DOB 14 Jun 1968; POB Saharanpur, India; nationality South Africa; Gender Male (individual) [GLOMAG].
- GUPTA, Rajesh (a.k.a. GUPTA, Rajesh Kumar; a.k.a. "GUPTA, Tony"), Dubai, United Arab Emirates; DOB 05 Aug 1972; POB Saharanpur, India; nationality South Africa; Gender Male; National ID No. 7208056345087 (South Africa) (individual) [GLOMAG].
The following changes have been made to OFAC's SDN List:
- BAHMAN GROUP, No. 37, Saba Boulevard, Africa Street, P.O. Box 14335-835, Tehran 1917773844, Iran; Website www.bahmangroup.com; Additional Sanctions Information - Subject to Secondary Sanctions [SDGT] [IFSR] (Linked To: ANDISHEH MEHVARAN INVESTMENT COMPANY). -to- BAHMAN GROUP, No. 37, Saba Boulevard, Africa Street, P.O. Box 14335-835, Tehran 1917773844, Iran; Website www.bahmangroup.com; Additional Sanctions Information - Subject to Secondary Sanctions [SDGT] [IFSR] (Linked To: ISLAMIC REVOLUTIONARY GUARD CORPS).
- ROSTAMIAN, Kambiz, Villa No 13, Cluster 31 Juemierah Islands, Dubai, United Arab Emirates; DOB 27 Aug 1960; Additional Sanctions Information - Subject to Secondary Sanctions; Passport RE0003026 (Saint Kitts and Nevis); alt. Passport I17217816 (Iran) (individual) [NPWMD] [IFSR]. -to- ROSTAMIAN, Kambiz, Villa No 13, Cluster 31 Juemierah Islands, Dubai, United Arab Emirates; DOB 27 Aug 1960; Additional Sanctions Information - Subject to Secondary Sanctions; Passport RE0003028 (Saint Kitts and Nevis); alt. Passport I17217816 (Iran) (individual) [NPWMD] [IFSR].
INTEREST RATE
FED. October 09, 2019. Minutes of the Federal Open Market Committee, September 17-18, 2019
The Federal Reserve Board and the Federal Open Market Committee on Wednesday released the attached minutes of the Committee meeting held on September 17-18, 2019. A summary of economic projections made by Federal Reserve Board members and Reserve Bank presidents for the meeting is also included as an addendum to these minutes.
The minutes for each regularly scheduled meeting of the Committee ordinarily are made available three weeks after the day of the policy decision and subsequently are published in the Board's Annual Report. The descriptions of economic and financial conditions contained in these minutes and in the Summary of Economic Projections are based solely on the information that was available to the Committee at the time of the meeting.
Minutes of the Federal Open Market Committee September 17–18, 2019
A joint meeting of the Federal Open Market Committee and the Board of Governors was held in the offices of the Board of Governors of the Federal Reserve System in Washington, D.C., on Tuesday, September 17, 2019, at 10:15 a.m. and continued on Wednesday, September 18, 2019, at 9:00 a.m.1
PRESENT:
Jerome H. Powell, Chair
John C. Williams, Vice Chair
Michelle W. Bowman
Lael Brainard
James Bullard
Richard H. Clarida
Charles L. Evans
Esther L. George
Randal K. Quarles
Eric Rosengren
Patrick Harker, Robert S. Kaplan, Neel Kashkari, Loretta J. Mester, and Michael Strine, Alternate Members of the Federal Open Market Committee
Thomas I. Barkin, Raphael W. Bostic, and Mary C. Daly, Presidents of the Federal Reserve Banks of Richmond, Atlanta, and San Francisco, respectively
James A. Clouse, Secretary
Matthew M. Luecke, Deputy Secretary
David W. Skidmore, Assistant Secretary
Michelle A. Smith, Assistant Secretary
Mark E. Van Der Weide, General Counsel
Michael Held, Deputy General Counsel
Steven B. Kamin, Economist
Thomas Laubach, Economist
Stacey Tevlin, Economist
Rochelle M. Edge, Eric M. Engen, William Wascher, Jonathan L. Willis, and Beth Anne Wilson, Associate Economists
Lorie K. Logan, Manager pro tem, System Open Market Account
Ann E. Misback, Secretary, Office of the Secretary, Board of Governors
Eric Belsky,2 Director, Division of Consumer and Community Affairs, Board of Governors; Matthew J. Eichner,3 Director, Division of Reserve Bank Operations and Payment Systems, Board of Governors; Michael S. Gibson, Director, Division of Supervision and Regulation, Board of Governors; Andreas Lehnert, Director, Division of Financial Stability, Board of Governors
Daniel M. Covitz, Deputy Director, Division of Research and Statistics, Board of Governors; Michael T. Kiley, Deputy Director, Division of Financial Stability, Board of Governors; Trevor A. Reeve, Deputy Director, Division of Monetary Affairs, Board of Governors
Jon Faust, Senior Special Adviser to the Chair, Office of Board Members, Board of Governors
Joshua Gallin, Special Adviser to the Chair, Office of Board Members, Board of Governors
Brian M. Doyle, Wendy E. Dunn, Joseph W. Gruber, Ellen E. Meade, and Ivan Vidangos, Special Advisers to the Board, Office of Board Members, Board of Governors
Linda Robertson, Assistant to the Board, Office of Board Members, Board of Governors
Shaghil Ahmed, Senior Associate Director, Division of International Finance, Board of Governors
Antulio Bomfim, Jane E. Ihrig, and Edward Nelson, Senior Advisers, Division of Monetary Affairs, Board of Governors; Jeremy B. Rudd, Senior Adviser, Division of Research and Statistics, Board of Governors
David López-Salido, Associate Director, Division of Monetary Affairs, Board of Governors; John J. Stevens, Associate Director, Division of Research and Statistics, Board of Governors
Andrew Figura and John M. Roberts, Deputy Associate Directors, Division of Research and Statistics, Board of Governors; Christopher J. Gust, Deputy Associate Director, Division of Monetary Affairs, Board of Governors; Matteo Iacoviello and Andrea Raffo,2 Deputy Associate Directors, Division of International Finance, Board of Governors; Jeffrey D. Walker,3 Deputy Associate Director, Division of Reserve Bank Operations and Payment Systems, Board of Governors
Zeynep Senyuz,4 Assistant Director, Division of Monetary Affairs, Board of Governors
Penelope A. Beattie,5 Assistant to the Secretary, Office of the Secretary, Board of Governors
Martin Bodenstein,2 Section Chief, Division of International Finance, Board of Governors
David H. Small,6 Project Manager, Division of Monetary Affairs, Board of Governors
Hess T. Chung,2 Group Manager, Division of Research and Statistics, Board of Governors
Jonathan E. Goldberg, Edward Herbst,2 and Benjamin K. Johannsen, Principal Economists, Division of Monetary Affairs, Board of Governors
Fabian Winkler,2 Senior Economist, Division of Monetary Affairs, Board of Governors
Randall A. Williams,2 Senior Information Manager, Division of Monetary Affairs, Board of Governors
James Hebden,2 Senior Technology Analyst, Division of Monetary Affairs, Board of Governors
Achilles Sangster II, Information Management Analyst, Division of Monetary Affairs, Board of Governors
Kenneth C. Montgomery, First Vice President, Federal Reserve Bank of Boston
David Altig,2 Kartik B. Athreya, Michael Dotsey, Jeffrey Fuhrer,2 Sylvain Leduc, Simon Potter,7 and Ellis W. Tallman, Executive Vice Presidents, Federal Reserve Banks of Atlanta, Richmond, Philadelphia, Boston, San Francisco, New York, and Cleveland, respectively
David Andolfatto, Marc Giannoni, Evan F. Koenig,2 Paula Tkac, and Mark L.J. Wright, Senior Vice Presidents, Federal Reserve Banks of St. Louis, Dallas, Dallas, Atlanta, and Minneapolis, respectively
Jonas Fisher, Giovanni Olivei, Giorgio Topa, and Patricia Zobel, Vice Presidents, Federal Reserve Banks of Chicago, Boston, New York, and New York, respectively
Jonas Arias,2 Thorsten Drautzburg,2 and Leonardo Melosi,2 Senior Economists, Federal Reserve Banks of Philadelphia, Philadelphia, and Chicago, respectively
Fernando Duarte,2 Financial Economist, Federal Reserve Bank of New York
Review of Monetary Policy Strategy, Tools, and Communication Practices
Committee participants continued their discussions related to the ongoing review of the Federal Reserve's monetary policy strategy, tools, and communication practices. Staff briefings provided an assessment of the risk that the federal funds rate could, in some future downturn, be constrained by the effective lower bound (ELB) and discussed options for mitigating the costs associated with this constraint. The staff's analysis suggested that the ELB would likely bind in most future recessions, which could make it more difficult for the FOMC to achieve its longer-run objectives of maximum employment and symmetric 2 percent inflation. The staff discussed several options for mitigating ELB risks, including using forward guidance and balance sheet policies earlier and more aggressively than in the past.
The staff also illustrated the properties of "makeup" strategies using model simulations. Under such strategies, policymakers would promise to make up for past inflation shortfalls with a sustained accommodative stance of policy that is intended to generate higher future inflation. These strategies are designed to provide accommodation at the ELB by keeping the policy rate low for an extended period in order to support an economic recovery. Because of their properties both at and away from the ELB, makeup strategies may also more firmly anchor inflation expectations at 2 percent than a policy strategy that does not compensate for past inflation misses. The staff analysis emphasized, however, that the benefits of makeup strategies depend importantly on the private sector's understanding of these strategies and their confidence that future policymakers would follow through on promises to keep policy accommodative.
Participants generally agreed with the staff's analysis that the risk of future ELB episodes had likely increased over time, and that future ELB episodes and the reduced effect of resource utilization on inflation could inhibit the Committee's ability to achieve its employment and inflation objectives. The increased ELB risk was attributed in part to structural changes in the U.S. economy that had lowered the longer-run real short-term interest rate and thus the neutral level of the policy rate. In this context, a couple of participants noted that uncertainty about the neutral rate made it especially challenging to determine any appropriate changes to the current framework. In light of a low neutral rate and shortfalls of inflation below the 2 percent objective for several years, some participants raised the concern that the policy space to reduce the federal funds rate in response to future recessions could be compressed further if inflation shortfalls continued and led to a decline in inflation expectations, a risk that was also discussed in the staff analysis. These participants pointed to long, ongoing ELB spells in other major foreign economies and suggested that, to avoid similar circumstances in the United States, it was important to be aggressive when confronted with forces holding inflation below objective. A couple of participants judged that the lack of monetary policy space abroad and the possibility that fiscal space in the United States might be limited reinforced the case for strengthening the FOMC's monetary policy framework as a matter of prudent planning.
With regard to the current monetary policy framework, participants agreed that this framework served the Committee well in the aftermath of the financial crisis. A number of participants noted that the Committee's experience with forward guidance and balance sheet policies would likely allow the Committee to deploy these tools earlier and more aggressively in the event that they were needed. A few indicated that the uncertainty about the effectiveness of these policies was smaller than the uncertainty surrounding the effectiveness of a makeup strategy.
Participants generally agreed that the current framework also served the Committee well by providing a strong commitment to achieving the Committee's maximum-employment and symmetric inflation objectives. Such a commitment was seen as flexible enough to allow the Committee to choose policy actions that best support its objectives in a wide array of economic circumstances. Because of the downside risk to inflation and employment associated with the ELB, most participants were open to the possibility that the dual-mandate objectives of maximum employment and stable prices could be best served by strategies that deliver inflation rates that over time are, on average, equal to the Committee's longer-run objective of 2 percent. Promoting such outcomes may require aiming for inflation somewhat above 2 percent when the policy rate was away from the ELB, recognizing that inflation would tend to be lower than 2 percent when the policy rate was constrained by the ELB. Participants suggested several alternatives for doing so, including strategies that make up for past inflation shortfalls and those that respond more aggressively to below-target inflation than to above-target inflation. In this context, several participants suggested that the adoption of a target range for inflation could be helpful in achieving the Committee's objective of 2 percent inflation, on average, as it could help communicate to the public that periods in which the Committee judged inflation to be moderately away from its 2 percent objective were appropriate. A couple of participants suggested analyzing policies in which there was a target range for inflation whose midpoint was modestly higher than 2 percent or in which 2 percent was an inflation floor; these policies might enhance policymakers' scope to provide accommodation as appropriate when the neutral real interest rate was low.
Although ensuring inflation outcomes averaging 2 percent over time was seen as important, many participants noted that the illustrated makeup strategies delivered only modest benefits in the staff's model simulations. These modest benefits in part reflected that the responsiveness of inflation to resource slack had diminished, making it more difficult to provide sufficient accommodation to push inflation back to the Committee's objective in a timely manner. Some participants suggested that the modest effects were particularly pronounced using the FRB/US model and indicated the need for more robustness analysis of simulation results along several dimensions and for further comparison to other alternative strategies. In addition, several participants noted that the implementation of the makeup strategies in the form of either average inflation targeting or price-level targeting in the simulations was tied too rigidly to the details of particular rules. An advantage of the current framework over such alternative approaches is that it has provided the Committee with the flexibility to assess a broad range of factors and information in choosing its policy actions, and these actions can vary depending on economic circumstances in order to best achieve the Committee's dual mandate. Similarly, makeup strategies could be implemented more flexibly in order to deliver more accommodation during a future downturn and through the subsequent recovery than what could be achieved with a mechanical makeup rule.
Participants also discussed a number of challenges associated with makeup strategies. Many participants expressed reservations with the makeup strategies analyzed by the staff. Some participants raised the concern that the effective use of the makeup strategies in the form of the average inflation targeting and price-level targeting rules that the staff presented depended on future policymakers following through on commitments to keep policy accommodative for a long time. Such commitments might be difficult for future policymakers to follow through on, especially in situations in which the labor market was strong and inflation was above target. A few participants acknowledged that credibly committing to makeup strategies posed challenges. However, they pointed to the commitments that central banks around the world made to inflation targeting as examples in which similar challenges had been overcome. A couple of participants raised the concern that keeping policy rates low for a long time could lead to excessive risk-taking in financial markets and threaten financial stability. However, a couple of other participants judged that macroprudential tools could be used to help ensure that any overleveraging of households and firms did not threaten the financial system, while monetary policy needed to be focused on achieving maximum employment and symmetric 2 percent inflation. A few participants viewed the communication challenges associated with average-inflation targeting strategies, including the difficulty of conveying the dangers of low inflation to the public, as greater than for some other strategies that use threshold-based forward guidance. Several participants noted that makeup strategies could unduly limit the policy response in situations in which inflation had been running above 2 percent amid signs of an impending economic downturn. Accordingly, these participants favored makeup strategies that only reversed past inflation shortfalls relative to makeup strategies that reversed both past inflation shortfalls and past overruns.
Participants continued to discuss the benefits of the Committee's review of the monetary policy framework as well as the Committee's Statement on Longer-Run Goals and Monetary Policy Strategy, which articulates the Committee's approach to monetary policy. As they did at their meeting in July, participants mentioned several issues that this statement might possibly address. These issues included the conduct of monetary policy in the presence of the ELB constraint, the role of inflation expectations in the Committee's pursuit of its inflation goal, the best means of conveying the Committee's balanced approach to monetary policy, the symmetry of its inflation goal, and the time frame over which the Committee aimed to achieve it. Participants expected that they would continue their deliberations on these and other topics pertinent to the review at upcoming meetings. They also generally agreed that the Committee's consideration of possible modifications to its policy strategy, tools, and communication practices would take some time, and that the process would be careful, deliberate, and patient.
Developments in Financial Markets and Open Market Operations
The manager pro tem first discussed developments in global financial markets over the intermeeting period. Global financial markets were volatile over the intermeeting period, with market participants reacting to incoming information about U.S.–China trade tensions and the global growth outlook. In the weeks following the July FOMC meeting, U.S. yields declined sharply and risk asset prices fell amid a spate of largely negative news about risks to the global economic outlook. These price moves reversed to some degree in September as developments on trade and economic data turned more positive. On net, Treasury yields remained substantially lower, while the S&P 500 and corporate credit spreads reversed most or all of their earlier losses to end the period little changed.
Even after the partial rebound in September, market- and survey-based indicators of policy rate expectations suggested that investors viewed it as very likely that the Committee would ease policy further at this meeting. All respondents from the Desk's Survey of Primary Dealers and Survey of Market Participants viewed a 25 basis point decrease in the target range as the most likely outcome at this meeting. Looking beyond September, most survey respondents expected another 25 basis point cut by year-end. Further out, while the median of respondents' modal forecasts for the end of 2020 pointed to no rate cuts next year, individual forecasts were much more dispersed, with nearly half of respondents expecting at least one additional 25 basis point cut in 2020, and about one-fourth expecting two or more cuts. Market participants remained attentive to a range of global risk factors that could affect the policy rate path, including trade tensions between the United States and China, developments in Europe, political tensions in Hong Kong, uncertainties related to Brexit, and escalating geopolitical tension in the Middle East following attacks on Saudi oil facilities.
The manager pro tem turned next to a discussion of money market conditions. Money markets were stable over most of the period, and the reduction in the interest on excess reserves (IOER) rate following the July FOMC meeting fully passed through to money market rates. However, money markets became highly volatile just before the September meeting, apparently spurred partly by large corporate tax payments and Treasury settlements, and remained so through the time of the meeting. In an environment of greater perceived uncertainty about potential outflows related to the corporate tax payment date, typical lenders in money markets were less willing to accommodate increased dealer demand for funding. Moreover, some banks maintained reserve levels significantly above those reported in the Senior Financial Officer Survey about their lowest comfortable level of reserves rather than lend in repo markets. Money market mutual funds reportedly also held back some liquidity in order to cushion against potential outflows. Rates on overnight Treasury repurchase agreements rose to over 5 percent on September 16 and above 8 percent on September 17.
Highly elevated repo rates passed through to rates in unsecured markets. Federal Home Loan Banks reportedly scaled back their lending in the federal funds market in order to maintain some liquidity in anticipation of higher demand for advances from their members and to shift more of their overnight funding into repo. In this environment, the effective federal funds rate (EFFR) rose to the top of the target range on September 16. The following morning, in accordance with the FOMC's directive to the Desk to foster conditions to maintain the EFFR in the target range, the Desk conducted overnight repurchase operations for up to $75 billion. After the operation, rates in secured and unsecured markets declined sharply. Rates in secured markets were trading around 2.5 percent after the operation. Market participants reportedly expected that additional temporary open market operations would be necessary both over subsequent days and around the end of the quarter. Many also reportedly expected another 5 basis point technical adjustment of the IOER rate.
By unanimous vote, the Committee ratified the Desk's domestic transactions over the intermeeting period. There were no intervention operations in foreign currencies for the System's account during the intermeeting period.
Staff Review of the Economic Situation
The information available for the September 17–18 meeting indicated that labor market conditions remained strong and that real gross domestic product (GDP) appeared to be increasing at a moderate rate in the third quarter. Consumer price inflation, as measured by the 12-month percentage change in the price index for personal consumption expenditures (PCE), was below 2 percent in July. Survey-based measures of longer-run inflation expectations were little changed.
Total nonfarm payroll employment expanded at a solid pace in July and August, although at a slower rate than in the first half of the year. (Separately, the Bureau of Labor Statistics' preliminary estimate of the upcoming benchmark revision to payroll employment, which will be incorporated in the published data in February 2020, indicated that the revised pace of average monthly job gains from April 2018 to March 2019 would be notably slower than in the current published data.) The unemployment rate remained at 3.7 percent through August, and both the labor force participation rate and the employment-to-population ratio moved up. The unemployment rates for African Americans and Hispanics declined over July and August, while the rates for whites and Asians increased; the unemployment rate for each group was below its level at the end of the previous economic expansion, though persistent differentials between these rates remained. The average share of workers employed part time for economic reasons in July and August continued to be below its level in late 2007. Both the rate of private-sector job openings and the rate of quits moved roughly sideways in June and July and were still at relatively high levels; the four-week moving average of initial claims for unemployment insurance benefits through early September was near historically low levels. Total labor compensation per hour in the business sector increased 4.4 percent over the four quarters ending in the second quarter, a faster rate than a year earlier. Average hourly earnings for all employees rose 3.2 percent over the 12 months ending in August, the same pace as a year earlier.
Total consumer prices, as measured by the PCE price index, increased 1.4 percent over the 12 months ending in July. This increase was slower than a year earlier, as core PCE price inflation (which excludes changes in consumer food and energy prices) moved down to 1.6 percent, consumer food price inflation remained below core inflation, and consumer energy prices declined. The average monthly change in core PCE prices in recent months was faster than earlier this year, suggesting that the soft inflation readings during the earlier period were transitory. The trimmed mean measure of 12-month PCE price inflation constructed by the Federal Reserve Bank of Dallas remained at 2 percent in July. The consumer price index (CPI) rose 1.7 percent over the 12 months ending in August, while core CPI inflation was 2.4 percent. Recent survey-based measures of longer-run inflation expectations were little changed on balance. The preliminary September reading from the University of Michigan Surveys of Consumers dipped after edging up in August, but it remained within its recent range; the measures of longer-run inflation expectations from the Desk's Survey of Primary Dealers and Survey of Market Participants were little changed.
Real consumer expenditures appeared to be rising solidly in the third quarter after expanding strongly in the second quarter. Real PCE rose briskly in July, while the components of the nominal retail sales data used by the Bureau of Economic Analysis (BEA) to estimate PCE were flat in August and the rate of sales of light motor vehicles only edged up, suggesting some slowing in consumer spending growth in the third quarter from its strong second-quarter pace. Key factors that influence consumer spending—including a low unemployment rate, further gains in real disposable income, high levels of households' net worth, and generally low borrowing rates—were supportive of solid real PCE growth in the near term. The preliminary September reading on the Michigan survey measure of consumer sentiment picked up a little after weakening notably in August, although the Conference Board survey measure of consumer confidence did not show a similar decline in August.
Real residential investment seemed to be picking up a little in the third quarter after declining over the previous year and a half. Starts of new single-family homes were higher in July and August than the second-quarter average, and starts of multifamily units rose in August after falling back in July. Building permit issuance for new single-family homes—which tends to be a good indicator of the underlying trend in construction of such homes—was higher in July and August than its second-quarter average. Sales of existing homes rose modestly in July, while new home sales declined following an outsized increase in June.
Real nonresidential private fixed investment looked to be declining further in the third quarter. Nominal shipments of nondefense capital goods excluding aircraft decreased in July, and forward-looking indicators generally pointed to continued softness in business equipment spending. Orders for nondefense capital goods excluding aircraft increased in June but were still below the level of shipments, most measures of business sentiment deteriorated, analysts' expectations of firms' longer-term profit growth declined further, and trade policy concerns continued to weigh on firms' investment decisions. Nominal business expenditures for nonresidential structures outside the drilling and mining sector decreased in July, and the number of crude oil and natural gas rigs in operation—an indicator of business spending for structures in the drilling and mining sector—continued to decline through mid-September.
Industrial production increased modestly, on net, over July and August, but production remained notably lower than at the beginning of the year. Automakers' assembly schedules indicated that the production of light motor vehicles would be roughly flat in the near term (although the labor strike at General Motors was expected to temporarily disrupt vehicle production), while new orders indexes from national and regional manufacturing surveys and a persistent drag from trade tariffs pointed toward continued softness in factory output in coming months.
Total real government purchases appeared to be rising at a slower pace in the third quarter than in the second quarter. Federal defense spending over July and August decelerated, and federal hiring of temporary workers for next year's decennial census was modest in August. State and local government payrolls rose moderately over July and August, and nominal spending by these governments on structures in July was below its second-quarter average.
The nominal U.S. international trade deficit remained about unchanged in June before narrowing in July. Exports, which had been soft over most of the past year, declined sharply in June but partially rebounded in July. This pattern was particularly notable in exports of non-aircraft capital goods and consumer goods. Imports also declined sharply in June and then declined a little further in July. Imports of oil and consumer goods fell in June, while imports of capital goods dropped significantly in July. The BEA estimated that the change in net exports was a drag of about 3/4 percentage point on real GDP growth in the second quarter.
Foreign economic growth remained subdued in the second quarter. Growth picked up in Canada as oil production rebounded, but growth slowed sharply in Europe amid a downturn in manufacturing activity and persistent policy-related uncertainty. Growth also slowed in China and India. Recent indicators suggested widespread weakness in manufacturing abroad even as services activity appeared to be holding up relatively well. Foreign inflation rose in the second quarter, pushed up by earlier increases in oil prices as well as by rising food prices in some emerging economies. However, data on foreign core consumer prices showed little sign of underlying inflationary pressures abroad. Late in the intermeeting period, an attack on a key oil facility in Saudi Arabia disrupted Saudi oil production and caused an initial spike in prices on near-dated oil futures contracts.
Staff Review of the Financial Situation
Financial market developments over the intermeeting period were driven by an escalation in international trade tensions, growing concerns about the global economic growth outlook, and the prospect of more policy accommodation by central banks. Nominal Treasury yields posted very large declines in August as investors reacted to the U.S. Administration's announcement of additional tariffs on Chinese goods, along with the depreciation of the Chinese renminbi through the perceived threshold of 7 renminbi per U.S. dollar and the associated implications of these actions for the global economic outlook. Treasury yields partially rebounded following better-than-expected incoming economic data in the United States and abroad, a perceived reduction in the probability of a no‑deal Brexit, and some positive headlines about trade policy. The market-implied path of the federal funds rate shifted down on net. Broad equity price indexes were down as much as 6 percent in early August but almost fully recovered by the end of the intermeeting period. Spreads on investment-grade corporate bonds widened modestly, while those on speculative-grade corporate bonds were little changed on net. Financing conditions for businesses and households were largely unaffected by the intermeeting turbulence in financial markets and remained generally supportive of spending and economic activity.
Measures of expectations of the near- and medium-term path for the federal funds rate were particularly sensitive to news about U.S.–China trade tensions, while FOMC communications had only modest effects on market-based measures of policy rate expectations. A straight read of the option-implied probability distribution of the federal funds rate suggested that the odds investors attached to a 25 basis point reduction in the target range of the federal funds rate at the September FOMC meeting increased from about 50 percent at the time of the July FOMC meeting to 90 percent by the end of the intermeeting period. Respondents to the Desk's Survey of Primary Dealers and Survey of Market Participants assigned, on average, similarly high odds to a rate decrease at the September FOMC meeting. In addition, market-implied expectations for the federal funds rate at year-end and beyond moved down. A straight read of OIS (overnight index swap) forward rates suggested that investors expected the federal funds rate to decline about 45 basis points by year-end, to a level nearly 10 basis points lower than was expected at the time of the July FOMC meeting, and to decrease an additional roughly 45 basis points by the end of 2020.
Nominal Treasury yields decreased, on net, over the intermeeting period, with longer-term yields falling the most. The spread between 10‑year and 3-month Treasury yields became a bit more negative, while the spread between 10-year and 2-year Treasury yields turned negative for the first time since 2007 and fluctuated around zero until the September FOMC meeting. Measures of inflation compensation derived from Treasury Inflation-Protected Securities declined on net.
Broad stock price indexes decreased slightly, on net, over the intermeeting period amid heightened volatility. The escalation of trade tensions between China and the United States weighed on equity prices, but investors' expectations that major central banks would shift toward more accommodative monetary policies provided some support. Equity prices were also boosted by better-than-anticipated corporate earnings and retail-sector data. Stock prices of firms with high exposure to China underperformed the broader market somewhat, as did bank stocks amid downward revisions to banks' earnings forecasts. Conversely, the stock prices of utilities and real estate firms increased noticeably, reportedly benefiting from demand by investors reaching for less cyclical and higher-yielding assets. One-month option-implied volatility on the S&P 500 index—the VIX—was little changed, on net, over the intermeeting period and remained at the lower end of its historical distribution after retracing a sharp increase in early August.
Despite the volatility in many domestic and global financial markets over the intermeeting period, conditions in domestic short-term funding markets remained stable until the Monday before the September FOMC meeting, when flows associated with a combination of corporate tax payments and Treasury coupon securities settlements led to significant tightening of conditions, particularly for overnight funding. The EFFR rose to the top of the target range on September 16 and exceeded it by 5 basis points on September 17, after which funding pressures eased somewhat following the Desk's open market operations. On net, the EFFR averaged 2.14 percent over the current intermeeting period, with the spread to the IOER rate down a bit relative to the previous intermeeting period.
Early in the intermeeting period, bond yields in the advanced foreign economies (AFEs) plunged and foreign equities declined notably following an increase in U.S.–China trade tensions. Some weakness in foreign economic data, growing concerns about global growth, and the prospect of more monetary policy accommodation abroad contributed to further declines in yields. Later in the period, AFE yields partially rebounded and foreign equity prices fully recovered on some easing of U.S.–China trade tensions, as well as perceptions of reduced political uncertainty in the United Kingdom and Italy. Financial market reactions were mixed after the European Central Bank (ECB) announced a package of policy easing measures, including a rate cut on deposits at the ECB, resumption of its asset purchase program, and more favorable terms for longer-term lending to banks.
The dollar appreciated against emerging market currencies but was little changed, on balance, against AFE currencies, leaving the broad dollar index slightly higher. Emerging market sovereign bond spreads widened notably. The Argentine peso depreciated sharply and Argentine sovereign yields soared following the defeat of the current pro-market president in the primary election and the subsequent announcement of plans for debt restructuring and the imposition of capital controls.
Financing conditions for nonfinancial businesses remained accommodative. Overall issuance of corporate bonds was solid in August, driven by resilient investment-grade issuance. While speculative-grade corporate bond issuance was somewhat subdued in August, it was comparable to that seen over the same period in 2018. Growth of commercial and industrial loans at banks ticked up, driven by faster growth at large domestic banks. There were no initial public equity offerings by domestic firms in August amid increased market volatility, but several deals were expected to be completed in the coming months. On balance, the credit quality of nonfinancial corporations weakened slightly, with the volume of nonfinancial corporate bond downgrades modestly outpacing that of upgrades in recent months. Credit conditions for both small businesses and municipalities remained accommodative on balance.
In the commercial real estate (CRE) sector, financing conditions remained generally accommodative. Bank CRE loan growth slowed moderately since the second quarter, driven by slower growth in loans secured by nonfarm nonresidential properties. The volume of agency and non-agency commercial mortgage-backed securities issuance was slightly weaker in July and August than in the same period last year, though industry analysts reportedly anticipated that issuance would soon pick up in response to recent declines in interest rates.
Financing conditions in the residential mortgage market eased over the intermeeting period. Residential mortgage rates declined less than long-term Treasury yields, as the increase in prepayment risk and the rise in implied interest rate volatility reportedly reduced the demand for mortgage-backed securities. Home-purchase originations and refinancing originations both rose.
Financing conditions in consumer credit markets remained generally supportive of growth in consumer spending, although supply conditions continued to be tight for subprime credit card borrowers. Consumer credit expanded at a moderate pace in the second quarter overall, with bank credit data pointing to continued growth through July and August. In consumer asset-backed securities markets, issuance was solid, and spreads remained at relatively low levels, though somewhat above their post-crisis averages.
Staff Economic Outlook
The projection for U.S. economic activity prepared by the staff for the September FOMC meeting was little changed in the near term; real GDP growth was still forecast to be slower in the second half of the year than in the first half, mostly attributable to continued soft business investment and a slower increase in government spending. The projection for real GDP growth over the medium term was a bit weaker than the previous forecast, primarily reflecting the effects of a higher projected path for the foreign exchange value of the dollar and a lower trajectory for economic growth abroad, which were partially offset by a lower assumed path for interest rates. Real GDP was forecast to expand at a rate a little above the staff's estimate of potential output growth in 2019 and 2020 and then slow to a pace slightly below potential output growth in 2021 and 2022. The unemployment rate was projected to be roughly flat through 2022 and to remain below the staff's estimate of its longer-run natural rate, which was revised down a little. In addition, the staff revised up its estimate of the level of trend productivity in recent years after incorporating the BEA's recent annual revisions to the national income and product accounts. Both of these supply-side adjustments led to a somewhat higher projected path for potential output, implying that estimates of current and projected resource utilization were less tight than the staff previously assumed.
The staff's forecast of total PCE price inflation for this year was revised down somewhat, reflecting slightly lower projected paths for consumer food and energy prices, along with a little lower forecast for core PCE prices. The core PCE price inflation forecast for this year was revised down to reflect recent data as well as downward-revised data for earlier in the year from the BEA's annual revision. Both total and core inflation were projected to move up slightly next year, as the low readings early this year were expected to be transitory; nevertheless, both inflation measures were forecast to continue to run below 2 percent through 2022.
The staff continued to view the uncertainty around its projections for real GDP growth, the unemployment rate, and inflation as generally similar to the average of the past 20 years. Moreover, the staff still judged that the risks to the forecast for real GDP growth were tilted to the downside, with a corresponding skew to the upside for the unemployment rate. Important factors in that assessment were that international trade tensions and foreign economic developments seemed more likely to move in directions that could have significant negative effects on the U.S. economy than to resolve more favorably than assumed. In addition, softness in business investment and manufacturing so far this year was seen as pointing to the possibility of a more substantial slowing in economic growth than the staff projected. The risks to the inflation projection were also viewed as having a downward skew, in part because of the downside risks to the forecast for economic activity
Participants' Views on Current Conditions and the Economic Outlook
In conjunction with this FOMC meeting, members of the Board of Governors and Federal Reserve Bank presidents submitted their projections of the most likely outcomes for real GDP growth, the unemployment rate, and inflation for each year from 2019 through 2022 and over the longer run, based on their individual assessments of the appropriate path for the federal funds rate. The longer-run projections represented each participant's assessment of the rate to which each variable would be expected to converge, over time, under appropriate monetary policy and in the absence of further shocks to the economy. These projections are described in the Summary of Economic Projections, which is an addendum to these minutes.
Participants agreed that the labor market had remained strong over the intermeeting period and that economic activity had risen at a moderate rate. Job gains had been solid, on average, in recent months, and the unemployment rate had remained low. Although household spending had risen at a strong pace, business fixed investment and exports had weakened. On a 12-month basis, overall inflation and inflation for items other than food and energy were running below 2 percent. Market-based measures of inflation compensation remained low; survey-based measures of longer-term inflation expectations were little changed.
Participants generally viewed the baseline economic outlook as positive and indicated that their views of the most likely outcomes for economic activity and inflation had changed little since the July meeting. However, for most participants, that economic outlook was premised on a somewhat more accommodative path for policy than in July. Participants generally had become more concerned about risks associated with trade tensions and adverse developments in the geopolitical and global economic spheres. In addition, inflation pressures continued to be muted. Many participants expected that real GDP growth would moderate to around its potential rate in the second half of the year. Participants agreed that consumer spending was increasing at a strong pace. They also expected that, in the period ahead, household spending would likely remain on a firm footing, supported by strong labor market conditions, rising incomes, and accommodative financial conditions. Several participants indicated that the housing sector was starting to rebound, stimulated by a significant decline in mortgage rates. With regard to the contrast between robust consumption growth and weak investment growth, several participants mentioned that uncertainties in the business outlook and sustained weak investment could eventually lead to slower hiring, which, in turn, could damp the growth of income and consumption.
In their discussion of the business sector, participants saw trade tensions and concerns about the global outlook as the main factors weighing on business investment, exports, and manufacturing production. Participants judged that trade uncertainty and global developments would continue to affect firms' investment spending, and that this uncertainty was discouraging them from investing in their businesses. A couple of participants noted that businesses had the capacity to adjust to ongoing uncertainty concerning trade, and some firms were reconfiguring supply chains and making logistical arrangements as part of contingency planning to mitigate the effects of trade tensions on their businesses.
Participants discussed developments in the manufacturing and the agricultural sectors of the U.S. economy. Manufacturing production remained lower than at the beginning of the year, and recent indicators suggested that conditions were unlikely to improve materially over the near term. Participants saw the ongoing global slowdown and trade uncertainty as contributing importantly to these declines. A few participants noted ongoing challenges in the agricultural sector, including those associated with tariffs, weak export demand, and more intense financial burdens arising from the increase in carryover debt in preceding years. Participants commented on the potential disruption to global oil production arising from the attack on Saudi Arabia's facilities.
Participants judged that conditions in the labor market remained strong, with the unemployment rate near historical lows and continued solid job gains, on average, in recent months. The labor force participation rate of prime-age individuals, especially of prime-age women, moved up in August, continuing its upward trajectory, and the unemployment rate of African Americans fell to its lowest rate on record. However, a number of participants noted that, although the labor market was clearly in a strong position, the preliminary benchmark revision by the Bureau of Labor Statistics indicated that payroll employment gains would likely show less momentum coming into this year when the revisions are incorporated in published data early next year. A few participants observed that it would be important to be vigilant in monitoring incoming data for any sign of softening in labor market conditions. That said, reports from business contacts in many Districts pointed to continued strong labor demand, with some firms still reporting difficulties finding qualified workers and others broadening their recruiting to include traditionally marginalized groups. In some Districts, employers were also expanding training and provision of nonwage benefits, which could help sustain their expansion of hiring against a background of a very tight national labor market without spurring above-trend aggregate wage growth. Some firms were also reluctant to raise wages because of their limited pricing power, while others thought the wages they were offering were in line with the skill sets of the workers available to fill new positions. Participants generally viewed overall wage growth as broadly consistent with modest average rates of labor productivity growth in recent years and as exerting little upward pressure on inflation. A couple of participants noted that, with inflationary pressures remaining muted and wage growth moderate even as employment and spending expanded further, they had again adjusted downward their estimates of the longer-run normal unemployment rate.
In their discussion of inflation developments, participants noted that, despite a recent firming in the incoming data, readings on overall and core PCE inflation had continued to run below the Committee's symmetric 2 percent objective. Furthermore, in light of weakness in the global economy, perceptions of downside risks to growth, and subdued inflation pressures, some participants continued to view the risks to the outlook for inflation as weighted to the downside. Some participants, however, saw the recent inflation data as consistent with their previous assessment that much of the weakness seen early in the year was transitory. In this connection, several participants noted that recent monthly readings, notably for CPI inflation, seemed broadly consistent with the Committee's longer-run inflation objective of 2 percent, while the trimmed mean measure of PCE inflation, constructed by the Federal Reserve Bank of Dallas, remained at 2 percent in July.
In their discussion of the outlook for inflation, participants generally agreed that, under appropriate policy, inflation would move up to the Committee's 2 percent objective over the medium term. Participants saw inflation expectations as reasonably well anchored, but many participants observed that market-based measures of inflation compensation and some survey measures of consumers' inflation expectations were at historically low levels. Some of these participants further noted that longer-term inflation expectations could be somewhat below levels consistent with the Committee's 2 percent inflation objective, or that continued weakness in inflation could prompt expectations to drift lower.
Participants generally judged that downside risks to the outlook for economic activity had increased somewhat since their July meeting, particularly those stemming from trade policy uncertainty and conditions abroad. In addition, although readings on the labor market and the overall economy continued to be strong, a clearer picture of protracted weakness in investment spending, manufacturing production, and exports had emerged. Participants also noted that there continued to be a significant probability of a no-deal Brexit, and that geopolitical tensions had increased in Hong Kong and the Middle East. Several participants commented that, in the wake of this increase in downside risk, the weakness in business spending, manufacturing, and exports could give rise to slower hiring, a development that would likely weigh on consumption and the overall economic outlook. Several participants noted that statistical models designed to gauge the probability of recession, including those based on information from the yield curve, suggested that the likelihood of a recession occurring over the medium term had increased notably in recent months. However, a couple of these participants stressed the difficulty of extracting the right signal from these probability models, especially in the current period of unusually low levels of term premiums.
With regard to developments in financial markets, participants noted that longer-term U.S. Treasury rates had been volatile over the intermeeting period but, on net, had registered a sizable decline. Participants observed that a key source of downward pressure on Treasury rates arose from flight-to-safety flows, driven by downside risks to global growth, escalating trade tensions, and disappointing global data. Low interest rates abroad were also considered an important influence on U.S. longer-term rates. Participants expressed a range of views about the implications of low longer-term Treasury rates. Some participants judged that a prolonged inversion of the yield curve could be a matter of concern. Participants also noted that equity prices had exhibited volatility but had been largely flat, on balance, over the intermeeting period. Several participants cited considerations that led them to be concerned about financial stability, including low risk spreads and a buildup of corporate debt, corporate stock buybacks financed through low-cost leverage, and the pace of lending in the CRE market. However, several others pointed to signs that the financial system remained resilient.
In their consideration of the monetary policy options at this meeting, most participants believed that a reduction of 25 basis points in the target range for the federal funds rate would be appropriate. In discussing the reasons for such a decision, these participants pointed to considerations related to the economic outlook, risk management, and the need to center inflation and inflation expectations on the Committee's longer-run objective of 2 percent.
Participants noted that there had been little change in their economic outlook since the July meeting and that incoming data had continued to suggest that the pace of economic expansion was consistent with the maintenance of strong labor market conditions. However, a couple of participants pointed out that data revisions announced in recent months implied that the economy had likely entered the year with somewhat less momentum than previously thought. In addition, data received since July had confirmed the weakening in business fixed investment and exports. One risk that the economy faced was that the softness recorded of late in firms' capital formation, manufacturing, and exporting activities might spread to their hiring decisions, with adverse implications for household income and spending. Participants observed that such an eventuality was not embedded in their baseline outlook; however, a couple of them indicated that this was partly because they assumed that an appropriate adjustment to the policy rate path would help forestall that eventuality. Several also noted that, because monetary policy actions affected economic activity with a lag, it was appropriate to provide the requisite policy accommodation now to support economic activity over coming quarters.
Participants favoring a modest adjustment to the stance of monetary policy at this juncture cited other risks to the economic outlook that further underscored the case for such a move. As their discussion of risks had highlighted, downside risks had become more pronounced since July: Trade uncertainty had increased, prospects for global growth had become more fragile, and various intermeeting developments had intensified geopolitical risks. Against this background, risk-management considerations implied that it would be prudent for the Committee to adopt a somewhat more accommodative stance of policy. In addition, a number of participants suggested that a reduction at this meeting in the target range for the federal funds rate would likely better align the target range with a variety of indicators of the appropriate policy stance, including those based on estimates of the neutral interest rate. A few participants observed that the considerations favoring easing were reinforced by the proximity of the federal funds rate to the ELB. If policymakers provided adequate accommodation while still away from the ELB, this course of action would help forestall the possibility of a prolonged ELB episode.
Many participants also cited the level of inflation or inflation expectations as justifying a reduction of 25 basis points in the federal funds rate at this meeting. Inflation had generally fallen short of the Committee's objective for several years and, notwithstanding some stronger recent monthly readings on inflation, the 12-month rate was still below 2 percent. Some estimates of trend inflation were also below 2 percent. Several participants additionally stressed that survey measures of longer-term inflation expectations and market-based measures of inflation compensation were near historical lows and that these values pointed to the possibility that inflation expectations were below levels consistent with the 2 percent objective or could soon fall below such levels. Against this backdrop, participants suggested that a policy easing would help underline policymakers' commitment to the symmetric 2 percent longer-run objective. With inflation pressures muted and U.S. inflation likely being weighed down by global disinflationary forces, policymakers saw little chance of an outsized increase in inflation in response to additional policy accommodation and argued that such an increase, should it occur, could be addressed in a straightforward manner using conventional monetary policy tools.
Several participants favored maintaining the existing target range for the federal funds rate at this meeting. These participants suggested that the baseline projection for the economy had changed very little since the Committee's previous meeting and that the state of the economy and the economic outlook did not justify a shift away from the current policy stance, which they felt was already adequately accommodative. They acknowledged the uncertainties that currently figured importantly in evaluations of the economic outlook, but they contended that the key uncertainties were unlikely to be resolved soon. Furthermore, as they did not believe that these uncertainties would derail the expansion, they did not see further policy accommodation as needed at this time. Changes in the stance of policy, they believed, should instead occur only when the macroeconomic data readily justified those moves. In this connection, a couple of participants suggested that, if it decided to provide more policy accommodation at the present juncture, the Committee might be taking out too much insurance against possible future shocks, leaving monetary policy with less scope to boost aggregate demand in the event that such shocks materialized. A few of the participants favoring an unchanged target range for the federal funds rate also expressed concern that an easing of monetary policy at this meeting could exacerbate financial imbalances.
A couple of participants indicated their preference for a 50 basis point cut in the federal funds rate at this meeting. These participants suggested that a larger policy move would help reduce the risk of an economic downturn and would more appropriately recognize important recent developments, such as slowing job gains, weakening investment, and continued low values of market-based measures of inflation compensation. In addition, these participants stressed the need for a policy stance—possibly one using enhanced forward guidance—that was sufficiently accommodative to make it unlikely that the United States would experience a protracted period of the kind seen abroad in which the economy became mired in a combination of undesirably low inflation, weak economic activity, and near-zero policy rates. They also argued that it was desirable for the Committee to seek and maintain a level of accommodation sufficient to deliver inflation at 2 percent on a sustained basis and that such a policy would be consistent with inflation exceeding 2 percent for a time.
With regard to monetary policy beyond this meeting, participants agreed that policy was not on a preset course and would depend on the implications of incoming information for the evolution of the economic outlook. A few participants judged that the expectations regarding the path of the federal funds rate implied by prices in financial markets were currently suggesting greater provision of accommodation at coming meetings than they saw as appropriate and that it might become necessary for the Committee to seek a better alignment of market expectations regarding the policy rate path with policymakers' own expectations for that path. Several participants suggested that the Committee's postmeeting statement should provide more clarity about when the recalibration of the level of the policy rate in response to trade uncertainty would likely come to an end.
Participants' Discussion of Recent Money Market Developments
The manager pro tem provided a summary of the most recent developments in money markets. Open market operations conducted on the previous day had helped to ease strains in money markets, but the EFFR had nonetheless printed 5 basis points above the top of the target range. With significant pressures still evident in repo markets and the federal funds market, and in accordance with the FOMC's directive to maintain the federal funds rate within the target range, the Desk conducted another repo operation on the morning of the second day of the meeting. The staff presented a proposal to lower the IOER rate and the overnight reverse repurchase agreement rate by 5 basis points, relative to the target range for the federal funds rate, in order to foster trading of federal funds within the target range.
Participants agreed that developments in money markets over recent days implied that the Committee should soon discuss the appropriate level of reserve balances sufficient to support efficient and effective implementation of monetary policy in the context of the ample-reserves regime that the Committee had chosen. A few participants noted the possibility of resuming trend growth of the balance sheet to help stabilize the level of reserves in the banking system. Participants agreed that any Committee decision regarding the trend pace of balance sheet expansion necessary to maintain a level of reserve balances appropriate to facilitate policy implementation should be clearly distinguished from past large-scale asset purchase programs that were aimed at altering the size and composition of the Federal Reserve's asset holdings in order to provide monetary policy accommodation and ease overall financial conditions. Several participants suggested that such a discussion could benefit from also considering the merits of introducing a standing repurchase agreement facility as part of the framework for implementing monetary policy.
Committee Policy Action
In their discussion of monetary policy for this meeting, members noted that information received since the July meeting indicated that the labor market remained strong and that economic activity had been rising at a moderate rate. Job gains had been solid, on average, in recent months, and the unemployment rate had remained low. Household spending had been rising at a strong pace. However, business fixed investment and exports had weakened, and this outcome suggested that risks and uncertainty associated with international trade developments and with ongoing weakness in global economic growth were continuing to weigh on the domestic economy. On a 12-month basis, both the overall inflation rate and inflation for items other than food and energy were running below 2 percent. Market-based measures of inflation compensation remained low. Survey-based measures of longer-term inflation expectations were little changed. In light of these developments, most members agreed to lower the target range for the federal funds rate to 1-3/4 to 2 percent at this meeting.
With this adjustment to policy, those members who supported the policy action sought to make the overall stance of monetary policy most consistent with helping to offset the effects on aggregate demand of weak global growth and trade policy uncertainty, insure against further downside risks arising from those sources and from geopolitical developments, and promote a more rapid return of inflation to the Committee's symmetric 2 percent objective than would otherwise occur. A couple of these members observed that, because monetary policy actions affected aggregate spending with a lag, the present meeting was an appropriate occasion for providing accommodation that would support economic activity in the period ahead. Two members preferred to maintain the current target range for the federal funds rate at this meeting. These members noted that economic data received over the intermeeting period had been largely positive and that they anticipated, under an unchanged policy stance, continued strong labor markets and solid growth in activity, with inflation gradually moving up to the Committee's 2 percent objective. These members also suggested that providing further accommodation during a period of high economic activity and elevated asset prices could have adverse consequences for financial stability. One member preferred a reduction in the target range of 50 basis points in the federal funds rate at this meeting. This member suggested that such a larger rate adjustment would be more consistent with the achievement of the Committee's objectives over time and, in particular, with helping preclude the possibility of a protracted period in which inflation and employment were below the Committee's objectives.
Members agreed that, in determining the timing and size of future adjustments to the target range for the federal funds rate, the Committee would assess realized and expected economic conditions relative to its maximum-employment objective and its symmetric 2 percent inflation objective. They also agreed that those assessments would take into account a wide range of information, including measures of labor market conditions, indicators of inflation pressures and inflation expectations, and readings on financial and international developments.
With regard to the postmeeting statement, members agreed to update the language of the Committee's description of incoming data to acknowledge the weakening in investment spending and in U.S. exports, as well as the recent strong rate of increase of household spending.
At the conclusion of the discussion, the Committee voted to authorize and direct the Federal Reserve Bank of New York, until instructed otherwise, to execute transactions in the SOMA in accordance with the following domestic policy directive, to be released at 2:00 p.m.:
"Effective September 19, 2019, the Federal Open Market Committee directs the Desk to undertake open market operations as necessary to maintain the federal funds rate in a target range of 1-3/4 to 2 percent, including overnight reverse repurchase operations (and reverse repurchase operations with maturities of more than one day when necessary to accommodate weekend, holiday, or similar trading conventions) at an offering rate of 1.70 percent, in amounts limited only by the value of Treasury securities held outright in the System Open Market Account that are available for such operations and by a per-counterparty limit of $30 billion per day.
The Committee directs the Desk to continue rolling over at auction all principal payments from the Federal Reserve's holdings of Treasury securities and to continue reinvesting all principal payments from the Federal Reserve's holdings of agency debt and agency mortgage-backed securities received during each calendar month. Principal payments from agency debt and agency mortgage-backed securities up to $20 billion per month will continue to be reinvested in Treasury securities to roughly match the maturity composition of Treasury securities outstanding; principal payments in excess of $20 billion per month will continue to be reinvested in agency mortgage-backed securities. Small deviations from these amounts for operational reasons are acceptable.
The Committee also directs the Desk to engage in dollar roll and coupon swap transactions as necessary to facilitate settlement of the Federal Reserve's agency mortgage-backed securities transactions."The vote also encompassed approval of the statement below to be released at 2:00 p.m.:
"Information received since the Federal Open Market Committee met in July indicates that the labor market remains strong and that economic activity has been rising at a moderate rate. Job gains have been solid, on average, in recent months, and the unemployment rate has remained low. Although household spending has been rising at a strong pace, business fixed investment and exports have weakened. On a
12-month basis, overall inflation and inflation for items other than food and energy are running below 2 percent. Market-based measures of inflation compensation remain low; survey-based measures of longer-term inflation expectations are little changed.
Consistent with its statutory mandate, the Committee seeks to foster maximum employment and price stability. In light of the implications of global developments for the economic outlook as well as muted inflation pressures, the Committee decided to lower the target range for the federal funds rate to 1-3/4 to 2 percent. This action supports the Committee's view that sustained expansion of economic activity, strong labor market conditions, and inflation near the Committee's symmetric 2 percent objective are the most likely outcomes, but uncertainties about this outlook remain. As the Committee contemplates the future path of the target range for the federal funds rate, it will continue to monitor the implications of incoming information for the economic outlook and will act as appropriate to sustain the expansion, with a strong labor market and inflation near its symmetric 2 percent objective.
In determining the timing and size of future adjustments to the target range for the federal funds rate, the Committee will assess realized and expected economic conditions relative to its maximum employment objective and its symmetric 2 percent inflation objective. This assessment will take into account a wide range of information, including measures of labor market conditions, indicators of inflation pressures and inflation expectations, and readings on financial and international developments."Voting for this action: Jerome H. Powell, John C. Williams, Michelle W. Bowman, Lael Brainard, Richard H. Clarida, Charles L. Evans, and Randal K. Quarles.
Voting against this action: James Bullard, Esther L. George, and Eric Rosengren.
President Bullard dissented because he believed that lowering the target range for the federal funds rate by 50 basis points at this time would provide insurance against further declines in expected inflation and a slowing economy subject to elevated downside risks. In addition, a 50 basis point cut at this time would help promote a more rapid return of inflation and inflation expectations to target. President George dissented because she believed that an unchanged setting of policy was appropriate based on incoming data and the outlook for economic activity over the medium term. Recognizing the risks to the outlook from the effects of trade policy and weaker global activity, President George would be prepared to adjust policy should incoming data point to a materially weaker outlook for the economy. President Rosengren dissented because he judged that monetary policy was already accommodative. In his view, additional accommodation was not needed for an economy in which labor markets are already tight and could pose risks of further inflating the prices of risky assets and encouraging households and firms to take on too much leverage.
Consistent with the Committee's decision to lower the target range for the federal funds rate to 1-3/4 to 2 percent, the Board of Governors voted unanimously to lower the interest rate paid on required and excess reserve balances to 1.80 percent and voted unanimously to approve a 1/4 percentage point decrease in the primary credit rate to 2.50 percent, effective September 19, 2019.
It was agreed that the next meeting of the Committee would be held on Tuesday–Wednesday, October 29–30, 2019. The meeting adjourned at 10:40 a.m. on September 18, 2019.
Notation Vote
By notation vote completed on August 20, 2019, the Committee unanimously approved the minutes of the Committee meeting held on July 30–31, 2019.
James A. Clouse
Secretary
Note
- The Federal Open Market Committee is referenced as the "FOMC" and the "Committee" in these minutes.
- Attended through the discussion of the review of the monetary policy framework.
- Attended through the discussion of developments in financial markets and open market operations.
- Attended the discussion of developments in financial markets and open market operations.
- Attended Tuesday's session only.
- Attended the discussion of the review of the monetary policy framework through the end of the meeting.
- Attended opening remarks for Tuesday session only.
FULL DOCUMENT: https://www.federalreserve.gov/monetarypolicy/files/fomcminutes20190918.pdf
________________
ECONOMIA BRASILEIRA / BRAZIL ECONOMICS
INFLAÇÃO
FGV. IBRE. 10/10/19. Índices Gerais de Preços. IGP-M Primeiro Decêndio. IGP-M varia 0,68% na 1ª prévia de outubro
O Índice Geral de Preços - Mercado (IGP-M) subiu 0,68% no primeiro decêndio de outubro. No mesmo período de setembro, o índice havia registrado queda de 0,60%.
O Índice de Preços ao Produtor Amplo (IPA) variou 1,02% no primeiro decêndio de outubro. No mesmo período do mês de setembro, o índice havia caído 0,95%. Na análise por estágios de processamento, os preços dos Bens Finais variaram 0,14% em outubro, após registrar queda de 0,04% em setembro. A principal contribuição para este avanço partiu do subgrupo combustíveis para o consumo, cuja taxa passou de -4,04% para 3,45%. O índice correspondente aos Bens Intermediários passou de -0,59% no primeiro decêndio de setembro para 1,22% no primeiro decêndio de outubro. Contribuiu para o movimento o subgrupo combustíveis e lubrificantes para produção cuja taxa passou de -1,36% para 6,72%.
A taxa do índice referente as Matérias-Primas Brutas passou de -2,37% no primeiro decêndio de setembro para 1,77% no primeiro decêndio de outubro. Contribuíram para o avanço da taxa do grupo os seguintes itens: minério de ferro (-12,40% para 3,05%), milho (em grão) (-0,65% para 5,26%) e laranja (-2,22% para 10,33%). Em sentido oposto, vale citar soja (em grão) (8,18% para 0,70%), trigo (em grão) (0,30% para -2,34%) e cana-de-açúcar (-0,74% para -0,80%).
O Índice de Preços ao Consumidor (IPC) variou -0,01% no primeiro decêndio de outubro, ante -0,09% no mês anterior. Quatro das oito classes de despesa componentes do índice registraram acréscimo em suas taxas de variação, com destaque para o grupo Alimentação (-0,89% para -0,45%). Nesta classe de despesa, vale mencionar o comportamento do item hortaliças e legumes, cuja taxa passou de -14,59% para -7,17%.
Também foram computados acréscimo nas taxas de variação dos grupos Transportes (0,12% para 0,27%), Vestuário (-0,07% para 0,31%) e Despesas Diversas (0,05% para 0,06%). Nestas classes de despesa, as maiores influências observadas partiram dos seguintes itens: gasolina (-0,60% para 0,80%), roupas (-0,04% para 0,60%) e alimentos para animais domésticos (-0,37% para 1,21%).
Em contrapartida, os grupos Habitação (0,23% para 0,04%), Educação, Leitura e Recreação (0,24% para 0,03%) e Comunicação (0,23% para 0,15%) apresentaram decréscimo em suas taxas de variação. Nestas classes de despesa, vale mencionar o comportamento dos itens: tarifa de eletricidade residencial (1,12% para 0,09%), passagem aérea (2,10% para -0,79%) e tarifa de telefone residencial (0,64% para 0,17%).
O grupo Saúde e Cuidados Pessoais repetiu a taxa de variação da última apuração, que foi de 0,21%. Os destaques em sentido ascendente e descendente partiram dos itens: artigos de higiene e cuidado pessoal (-0,46% para 0,18%) e serviços de cuidados pessoais (0,42% para 0,28%), nessa ordem.
O Índice Nacional de Custo da Construção (INCC) variou 0,11% no primeiro decêndio de outubro, taxa inferior a apurada no mês anterior, quando o índice havia subido 0,50%. Os três componentes do INCC registraram as seguintes taxas da variação na passagem do primeiro decêndio de setembro para o primeiro decêndio de outubro: Materiais e Equipamentos (-0,32% para 0,26%), Serviços (0,53% para 0,13%) e Mão de Obra (1,04% para 0,00%).
DOCUMENTO: https://portalibre.fgv.br/navegacao-superior/noticias/igp-m-varia-0-68-na-1-previa-de-outubro.htm
COMÉRCIO VAREJISTA
IBGE. 10/10/2019. Vendas do varejo variam 0,1% em agosto
As vendas no varejo variaram 0,1% em agosto de 2019 na comparação com o mês anterior (série com ajuste sazonal). É o terceiro resultado positivo seguido nesse tipo de comparação, o que representa um acréscimo de 1,2% no período. Com isso, a evolução do índice de média móvel trimestral para o varejo mostrou, no trimestre encerrado em agosto (0,4%), mesmo ritmo de vendas do trimestre encerrado em julho (0,4%).
| Período | Varejo | Varejo Ampliado | ||
|---|---|---|---|---|
| Volume de vendas | Receita nominal | Volume de vendas | Receita nominal | |
| Agosto / Julho* | 0,1 | -0,2 | 0,0 | 0,3 |
| Média móvel trimestral* | 0,4 | 0,2 | 0,2 | 0,2 |
| Agosto 2019 / Agosto 2018 | 1,3 | 3,9 | 1,4 | 3,7 |
| Acumulado 2019 | 1,2 | 4,8 | 3,5 | 6,4 |
| Acumulado 12 meses | 1,4 | 5,1 | 3,7 | 6,7 |
| *Série COM ajuste sazonal Fonte: IBGE, Diretoria de Pesquisas, Coordenação de Indústria | ||||
Na comparação com agosto de 2018 (série sem ajuste sazonal), o comércio varejista avançou 1,3%. Com isso, o acumulado do ano ficou em 1,2%. Já o acumulado nos últimos doze meses, ao passar de 1,6% em julho para 1,4% em agosto, registrou perda de ritmo nas vendas.
Já no varejo ampliado, que inclui as atividades de Veículos, motos, partes e peças e de Material de construção, o volume de vendas não apresentou variação (0,0%) frente a julho de 2019. Com isso, a média móvel (0,2%) mostrou redução no ritmo das vendas, quando comparada à média móvel no trimestre encerrado em julho (0,4%).
Frente a agosto de 2018, o comércio varejista ampliado aumentou 1,4%, quinta taxa positiva consecutiva e a de menor magnitude entre elas. Assim, o varejo ampliado acumulou aumento de 3,5% no ano. O indicador acumulado nos últimos doze meses, ao passar 4,1% em julho para 3,7% em agosto, também apontou queda no ritmo de vendas
Quatro das oito atividades pesquisadas crescem entre julho e agosto
A variação de 0,1% no volume de vendas do comércio varejista na passagem de julho para agosto teve equilíbrio entre taxas negativas e positivas, atingindo quatro das oito atividades pesquisadas em cada caso. No campo positivo, destacaram-se: Hipermercados, supermercados, produtos alimentícios, bebidas e fumo (0,6%) e Outros artigos de uso pessoal e doméstico (0,2%), que, juntos, respondem por mais de 60% do total do varejo. Ainda com taxas positivas, encontram-se: Equipamentos e material para escritório, informática e comunicação (3,8%) e Livros, jornais, revistas e papelaria (0,2%).
Por outro lado, com variação negativa, figuram as atividades: Combustíveis e lubrificantes (-3,3%); Tecidos, vestuário e calçados (-2,5%), Móveis e eletrodomésticos (-1,5%); e Artigos farmacêuticos, médicos, ortopédicos, de perfumaria e cosméticos (-0,3%).
Considerando o comércio varejista ampliado, o volume de vendas manteve-se estável (0,0%). O setor de Veículos, motos, partes e peças registrou queda de 1,7%, segundo recuo seguido e Material de construção recuou 0,8% em agosto, descontando o acréscimo de 0,7% registrado no mês anterior.
Volume de vendas cresce 1,3% frente a agosto de 2018
Em agosto de 2019, frente a igual mês do ano anterior, o comércio varejista cresceu 1,3%, com taxas negativas atingindo cinco das oito atividades. Vale citar que agosto de 2019 (22 dias) teve um dia útil a menos do que igual mês do ano anterior (23 dias). Entre as atividades com crescimento, destacaram-se, por ordem de composição na taxa: Hipermercados, supermercados, produtos alimentícios, bebidas e fumo (2,4%), seguido por Outros artigos de uso pessoal e doméstico (4,7%) e Artigos farmacêuticos, médicos, ortopédicos, de perfumaria e cosméticos (5,2%).
Já as principais atividades que pressionaram negativamente o varejo foram: Combustíveis e lubrificantes (-2,9%) e Tecidos, vestuário e calçados (-3,4%), seguidos por: Móveis e eletrodomésticos (-1,3%); Livros, jornais, revistas e papelaria (-17,1%) e Equipamentos e material para escritório, informática e comunicação (-3,5%).
Com avanço de 1,4% frente a agosto de 2018, o comércio varejista ampliado registrou a quinta taxa positiva consecutiva. Esse resultado foi influenciado, principalmente, pelo desempenho de Veículos, motos, partes e peças (2,9%), enquanto o setor de Material de construção pressionou negativamente, com recuo de 1,6%.
O setor de Hipermercados, supermercados, produtos alimentícios, bebidas e fumo, (2,4%) registrou a terceira taxa positiva consecutiva. O segmento exerceu o principal impacto positivo na formação da taxa global do varejo. O desempenho da atividade, de vendas de itens essenciais, vem sendo sustentado pelo aumento da população ocupada e pela estabilidade da massa de rendimento real habitualmente recebida. O indicador acumulado de janeiro até agosto ficou em 0,3% e o indicador acumulado nos últimos doze meses, ao registrar acréscimo de 0,8%, mostrou perda de ritmo em relação a julho (1,1%).
O segmento de Outros artigos de uso pessoal e doméstico (4,7%), que engloba lojas de departamentos, óticas, joalherias, artigos esportivos, brinquedos etc., mostrou perda de ritmo em relação ao resultado de julho (8,1%). Ainda assim, o setor exerceu a segunda maior contribuição no resultado geral do varejo. O índice acumulado no ano ficou em 4,9% e o indicador acumulado nos últimos doze meses registrou taxa de 5,9%, com perda de 0,4 p.p. em relação ao resultado de julho (6,3%).
A atividade de Artigos farmacêuticos, médicos, ortopédicos e de perfumaria (5,2%) exerceu a terceira contribuição positiva, sendo a 28ª variação positiva consecutiva, na comparação com igual mês do ano anterior. Em relação ao índice acumulado no ano, a taxa ficou em 6,4%. Já o acumulado nos últimos doze meses, ao passar de 6,4% até julho para 6,2% em agosto, mostrou ligeira redução da intensidade de crescimento.
Combustíveis e lubrificantes (-2,9%) interrompeu uma sequência de três taxas positivas e exerceu a maior contribuição negativa para o resultado total do varejo. O indicador acumulado no ano, ao passar de 1,2% para 0,6%, mostrou redução de ritmo nas vendas. Ainda assim, o indicador acumulado nos últimos doze meses permaneceu praticamente estável entre julho (-0,6%) e agosto (-0,7%).
O setor de Tecidos, vestuário e calçados (-3,4%) volta a registrar taxa negativa, exercendo também a principal pressão negativa para o resultado geral do varejo. Quanto ao acumulado no ano, ao passar 0,4% para -0,1%, evidenciou perda de ritmo. Com isso, o acumulado nos últimos doze meses, ao passar de 1,3% em julho para 0,7% em agosto, também mostrou perda de ritmo.
O segmento de Móveis e eletrodomésticos (-1,3%) exerceu o segundo maior impacto negativo, após o aumento de 7,4% registrado no mês anterior. Em relação ao acumulado no ano, o índice mostrou variação de -0,1%. O indicador acumulado nos últimos doze meses ficou praticamente estável ao passar de -0,9% para -0,8%.
A atividade de Livros, jornais, revistas e papelaria (-17,1%) teve comportamento influenciado pelas mudanças na forma de comercialização dos seus principais itens, além de alterações nos hábitos dos consumidores. Com isso, o indicador acumulado no ano registra perda de 25,1%. O acumulado nos últimos doze meses, ao passar de -25,2% para -25,5%, permanece no campo negativo desde março de 2014.
O segmento de Equipamentos e material para escritório, informática e comunicação mostrou recuo de 3,5% em relação a agosto de 2018. Nos ano, o segmento mostra variação de -0,6%. O acumulado nos últimos doze meses (-0,1%) mostrou menor ritmo de vendas em relação a julho (0,5%).
O setor de Veículos, motos, partes e peças (2,9%) assinalou a quinta taxa seguida positiva e exerceu a maior contribuição positiva para o varejo ampliado. O indicador acumulado no ano aumentou 10,7% e a análise pelo acumulado nos últimos doze meses, ao registrar aumento de 11,3% até agosto, mostrou perda de ritmo em relação ao acumulado até julho (12,5%).
O segmento de Material de Construção (-1,6%) voltou a mostrar queda após resultado positivo em julho (8,1%). Com isso, o indicador acumulado no ano, com taxa de 3,6%, mostrou a redução de ritmo comparado ao mês de julho (4,5%). O acumulado nos últimos doze meses, ao passar de 3,6% para 2,9%, também mostra perda de ritmo.
| INDICADORES DO VOLUME DE VENDAS DO COMÉRCIO VAREJISTA E COMÉRCIO VAREJISTA AMPLIADO, SEGUNDO GRUPOS DE ATIVIDADES - Agosto 2019 | ||||||||
|---|---|---|---|---|---|---|---|---|
| ATIVIDADES | MÊS/MÊS ANTERIOR (1) | MÊS/IGUAL MÊS DO ANO ANTERIOR | ACUMULADO | |||||
| Taxa de Variação (%) | Taxa de Variação (%) | Taxa de Variação (%) | ||||||
| JUN | JUL | AGO | JUN | JUL | AGO | NO ANO | 12 MESES | |
| COMÉRCIO VAREJISTA (2) | 0,5 | 0,5 | 0,1 | 0,1 | 4,3 | 1,3 | 1,2 | 1,4 |
| 1 - Combustíveis e lubrificantes | 0,8 | 0,6 | -3,3 | 4,4 | 5,0 | -2,9 | 0,6 | -0,7 |
| 2 - Hiper, supermercados, bebidas e fumo | 0,2 | 1,1 | 0,6 | 0,8 | 1,7 | 2,4 | 0,3 | 0,8 |
| 2.1 - Super e hipermercados | -0,1 | 1,0 | 0,6 | 0,9 | 2,1 | 2,8 | 0,7 | 1,2 |
| 3 - Tecidos, vestuário e calçados | 1,4 | 0,8 | -2,5 | -1,5 | 6,5 | -3,4 | -0,1 | 0,7 |
| 4 - Móveis e eletrodomésticos | -1,0 | 0,7 | -1,5 | -6,6 | 7,4 | -1,3 | -0,1 | -0,8 |
| 5 - Artigos farmaceuticos e de perfumaria | 0,2 | 0,6 | -0,3 | 5,0 | 8,5 | 5,2 | 6,4 | 6,2 |
| 6 - Livros, jornais, revistas e papelaria | -0,6 | 2,2 | 0,2 | -26,2 | -18,1 | -17,1 | -25,1 | -25,5 |
| 7 - Equip.para escritório, informatica e comunicação | -2,4 | -0,7 | 3,8 | -8,8 | -1,1 | -3,5 | -0,6 | -0,1 |
| 8 - Outros artigos de uso pessoal e doméstico | 0,7 | 2,4 | 0,2 | -0,8 | 8,1 | 4,7 | 4,9 | 5,9 |
| COMÉRCIO VAREJISTA AMPLIADO (3) | 0,1 | 0,6 | 0,0 | 2,0 | 7,7 | 1,4 | 3,5 | 3,7 |
| 9 - Veículos e motos, partes e peças | 3,4 | -1,0 | -1,7 | 9,9 | 17,6 | 2,9 | 10,7 | 11,3 |
| 10- Material de construção | -0,9 | 0,7 | -0,8 | -3,3 | 8,1 | -1,6 | 3,6 | 2,9 |
| Fonte: IBGE, Diretoria de Pesquisas, Coordenação de Serviços e Comércio. (1) Séries com ajuste sazonal. (2) O indicador do comércio varejista é composto pelos resultados das atividades numeradas de 1 a 8. (3) O indicador do comércio varejista ampliado é composto pelos resultados das atividades numeradas de 1 a 10 | ||||||||
Vendas avançam em 15 das 27 unidades da federação
Na passagem de julho para agosto de 2019, o varejo teve resultados positivos em 15 das 27 unidades da federação, com destaque para Piauí (11,9%); Amapá (4,3%); e Maranhão (3,9%). Por outro lado, os destaques negativos, em termos de magnitude da taxa, foram no Rio Grande do Sul (-7,6%); Rio de Janeiro (-2,3%); e Roraima (-2,1%).
Para a mesma comparação, o comércio varejista ampliado não registrou variação entre julho e agosto (0,0%), com resultados positivos em 16 das 27 unidades da federação, com destaque para Amapá (9,1%); Piauí (4,6%); e Pará (2,5%). Por outro lado, pressionando negativamente, destacaram-se Roraima (-3,0%); Bahia e Rio de Janeiro (ambos com -1,9%)
Frente a agosto de 2018, as taxas positivas alcançaram 14 das 27 unidades da federação, com destaque para Amapá (26,4%); Amazonas (12,2%) e Santa Catarina (11,4%), enquanto Bahia (0,0%) mostrou estabilidade. Por outro lado, pressionando negativamente, figuram 12 das 27 unidades da federação, com destaque para Paraíba (-9,0%); Piauí
(-4,9%); e Rio Grande do Sul (-3,4%).
Quanto à participação na composição da taxa do varejo, os destaques são para São Paulo (2,9%); Santa Catarina (11,4%); e Amazonas (12,2%). Por outro lado, pressionando negativamente, figuram Paraná (-1,3%); Paraíba (-9,0%); e Rio Grande do Sul (-3,4%).
Considerando o comércio varejista ampliado, houve resultados positivos em 16 das 27 unidades da federação, com destaque para Amapá (39,9%); Santa Catarina (10,2%) e Mato Grosso (6,8%). Por outro lado, pressionando negativamente, figuram 10 das 27 unidades da federação, com destaque para Piauí (-6,4%); Paraíba (-5,7%) e Rio Grande do Sul (-3,1%), enquanto Bahia mostrou estabilidade (0,0%).
Quanto à participação na composição da taxa do varejo ampliado, destacaram-se São Paulo (1,9%) Santa Catarina (10,2%), e Paraná (2,3%). Por outro lado, Rio Grande do Sul
(-3,1%), Rio de Janeiro (-1,5%) e Espírito Santo (-2,6%) exerceram os principais impactos negativos.
Comércio fica em 0,1% e tem terceiro mês positivo, puxado por vendas de supermercados. Vendas nos supermercados cresceram 0,6% em agosto, quarta alta seguida
Os super e hipermercados impediram que as vendas do varejo ficassem negativas em agosto.. O volume do comércio no mês foi de 0,1% em relação julho, o que indica estabilidade, mas é o terceiro mês seguido que o setor tem taxa positiva, acumulando alta de 1,2% no ano.
Na comparação com agosto de 2018, as vendas cresceram 1,3%. Os resultados são da Pesquisa Mensal de Comércio, divulgada hoje pelo IBGE.
As vendas do setor de super e hiper supermercados, que agrega produtos alimentícios e fumo, aumentaram 0,6% na passagem de julho para agosto, o quarto resultado positivo seguido. Outra alta foi de outros artigos de uso pessoal e doméstico, que cresceram 0,2%. Juntos, os dois setores correspondem a mais de 60% do total do varejo.
“O aumento nos dois grupos indica um perfil de consumo mais básico, associado às classes de rendimento mais baixas da população”, explicou a gerente da pesquisa, Isabella Nunes.
Também tiveram aumento os equipamentos e materiais de escritório, informática e comunicação (3,8%), livros e revistas e artigos de papelaria (0,2%).
Volume de vendas no comércio varejista (%)
Clique e arraste para zoom
Fonte: IBGE - Pesquisa Mensal de Comércio
Já no lado das quedas, estão as vendas de combustíveis e lubrificantes (-3,3%), tecidos, vestuário e calçados (-2,5%), móveis e eletrodomésticos (-1,5%) e artigos farmacêuticos, médicos, ortopédicos e de perfumaria (-0,3%).
“A variação negativa para esses tipos de produtos confirma que a população está dedicando mais seu orçamento às compras de primeira necessidade. O equilíbrio entre essas quatro categorias em queda com dois grandes setores em alta levou o mercado a um patamar mais próximo da estabilidade”, avaliou a pesquisadora.
Já o comércio varejista ampliado, que inclui veículos automotivos (-1,7%) e material de construção (-0,8%), ficou estável em 0,0%. “Novamente, foram os supermercados e alimentos que serviram de contrapeso para esses resultados negativos, mantendo o índice geral estável”, concluiu Isabella.
DOCUMENTO: https://agenciadenoticias.ibge.gov.br/agencia-sala-de-imprensa/2013-agencia-de-noticias/releases/25662-vendas-do-varejo-variam-0-1-em-agosto
AGRICULTURA
IBGE. 10/10/2019. Em setembro, IBGE prevê alta de 6,3% na safra de 2019
A estimativa de setembro de 2019 para a safra nacional de cereais, leguminosas e oleaginosas é um novo recorde, com 240,7 milhões de toneladas, 6,3% superior à de 2018 (226,5 milhões de toneladas) e 0,4% acima da estimativa de agosto. A última safra recorde do país foi a de 2017 (238,4 milhões de toneladas). A área a ser colhida foi estimada em 63,1 milhões de hectares, crescendo 3,5% frente a 2018. Em relação ao mês anterior, a estimativa da área a ser colhida cresceu 200,1 mil hectares (0,3%). O arroz, o milho e a soja, os três principais produtos deste grupo, somados, representaram 92,8% da estimativa da produção e 87,0% da área a ser colhida.
| Estimativa de Setembro para a safra 2019 | 240,7 milhões de toneladas |
|---|---|
| Variação safra 2019 / safra 2018 | 6,3% (mais 14,3 milhões de toneladas) |
| Variação safra 2019 / estimativa de agosto | 0,4% (mais 997,3 mil toneladas) |
Em relação a 2018, houve acréscimos de 7,0% na área do milho (declínio de 1,9% no milho de primeira safra e aumento de 10,7% no milho de segunda safra), de 2,3% na área da soja e de 40,9% para a área do algodão herbáceo, ocorrendo declínio de 9,5% na área de arroz. No que se refere à produção, ocorreram decréscimos de 4,3% para a soja e de 12,0% para o arroz, bem como acréscimos de 23,1% para o milho (crescimentos de 1,1% no milho de primeira safra e de 33,3% no milho de segunda safra) e de 39,0% para o algodão herbáceo. Para a soja, foi estimada uma produção de 112,8 milhões de toneladas. Para o milho, uma produção recorde de 100,2 milhões de toneladas (26,0 milhões de toneladas de milho na primeira safra e 74,1 milhões de toneladas de milho na segunda safra).
A produção do arroz foi estimada em 10,3 milhões de toneladas e a do algodão, em 6,9 milhões de toneladas, novo recorde da série histórica do IBGE. Em relação ao mês anterior, houve crescimentos nas estimativas do milho (1,3% ou 1,3 milhão de toneladas), algodão (5,0% ou 324,7 mil toneladas), feijão (4,1% ou 120,2 mil toneladas), cevada (6,3% ou 24,5 mil toneladas), laranja (7,4% ou 1,2 milhão de toneladas) e do tomate (2,5% ou 96,5 mil toneladas). Houve declínios para a aveia (-1,9% ou 18,7 mil toneladas), batata-inglesa (-1,1% ou 42,7 mil toneladas), café arábica (-4,4% ou 96,3 mil toneladas), café canephora (-1,3% ou 12,1 mil toneladas) e trigo (-5,9% ou 343,5 mil toneladas).
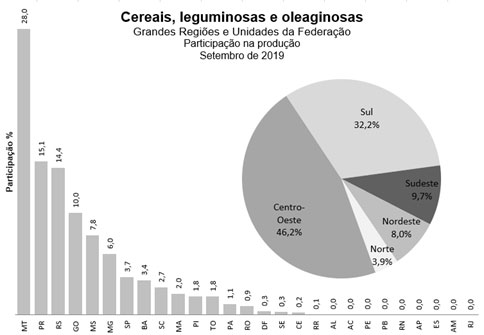
Entre as Grandes Regiões, o volume da produção de cereais, leguminosas e oleaginosas apresentou a seguinte distribuição: Centro-Oeste (111,2 milhões de toneladas); Sul (77,5 milhões de toneladas); Sudeste (23,4 milhões de toneladas); Nordeste (19,2 milhões de toneladas) e Norte (9,5 milhões de toneladas). Em relação à safra passada, houve altas de 6,2% na Região Norte, de 10,1% na Região Centro-Oeste, de 4,0% na Região Sul, de 0,5% na Região Nordeste e de 2,1% na Região Sudeste. Entre as Unidades da Federação, Mato Grosso lidera, com uma participação de 28,0% na produção nacional de grãos.
ESTIMATIVAS DE SETEMBRO/2019
Em relação a agosto, destacaram-se as variações nas seguintes estimativas de produção: feijão 3ª safra (13,6%), laranja (7,4%), cevada (6,3%), algodão herbáceo (5,0%), feijão 2ª safra (3,1%), tomate (2,5%), batata-inglesa 2ª safra (1,9%), milho 2ª safra (1,4%), feijão 1ª safra (1,2%), milho 1ª safra (1,2%), batata-inglesa 1ª safra (0,0%), café canephora (-1,3%), aveia (-1,9%), café arábica (-4,4%), trigo (-5,9%) e batata-inglesa 3ª safra (-6,5%). Com relação à variação absoluta, os destaques ficaram com a laranja (1 213 788 t), milho 2ª safra (1 001 926 t), algodão herbáceo (324 661 t), milho 1ª safra (298 210 t), tomate (96 527 t), feijão 3ª safra (69 769 t), feijão 2ª safra (35 473 t), cevada (24 501 t), batata-inglesa 2ª safra (22 023 t), feijão 1 ª safra (14 986 t), batata-inglesa 1ª safra (0 t), café canephora (-12 068 t), aveia (-18 705 t), batata inglesa 3ª safra (-64 720 t), café arábica (-96 270 t) e trigo (-343 515 t).
ALGODÃO HERBÁCEO (em caroço) – A produção foi de 6,9 milhões de toneladas, com alta de 5,0% em relação a agosto. Em Mato Grosso, maior produtor nacional, a produção cresceu 6,2% e alcançou 4,7 milhões de toneladas, o que representa 67,8% da safra nacional. Na Bahia, segundo maior produtor, a produção também foi reavaliada, com alta de 2,2%. Em Goiás, houve alta de 10,7%, devido à maior área cultivada. Preços compensatórios, com a maior demanda chinesa, além da boa produção e rentabilidade da safra anterior, incentivaram a ampliação da área plantada e o aumento dos investimentos. Em relação a 2018, a estimativa da produção de algodão cresceu 39,0%, devido ao aumento de 40,9% na área plantada. Já a produção cresceu 46,1% no Mato Grosso, de 19,7% na Bahia e 79,5% em Goiás.
BATATA-INGLESA – A estimativa da produção brasileira alcançou 3,8 milhões de toneladas, declínio de 1,1% em relação ao mês anterior. Em setembro, não houve variação para a 1ª safra em relação ao mês anterior. A produção ficou em 1,7 milhão de toneladas. Para a 2ª safra, a produção mineira foi reavaliada com crescimento de 10,1%, alcançando 478,1 mil toneladas. As produções do Paraná e São Paulo também foram revistas, contudo, para baixo, com declínios de 1,9% e 6,0%, respectivamente. Ao todo, a produção da 2ª safra alcançou 1,2 milhão de toneladas, crescimento de 1,9% em relação ao mês anterior. Para a 3ª safra, a produção foi estimada em 923,7 mil toneladas, declínio de 6,5% em relação ao mês anterior. São Paulo e Minas Gerais informaram redução de 5,3% e 14,6% em suas estimativas de produção, devendo as mesmas alcançarem 387,4 e 262,6 mil toneladas, respectivamente, enquanto Goiás informou aumento de 0,9%. Em relação ao ano anterior, a produção brasileira de batata-inglesa apresentou declínio de 0,3%.
CAFÉ (em grão) – A estimativa da produção brasileira de café foi de 3,0 milhões de toneladas, ou 50,3 milhões de sacas de 60 kg, redução de 16,0% em relação a 2018. Em relação ao mês anterior, a produção foi 3,5% menor.
Para o café arábica, a produção estimada foi de 2,1 milhões de toneladas, ou 35,1 milhões de sacas de 60 kg, declínio de 4,4% em relação ao mês anterior. Em Minas Gerais, na passagem de agosto para setembro, a estimativa da produção declinou 4,9%, com a produção devendo alcançar 1 489,8 mil toneladas, contra 1 566,9 mil toneladas estimados no mês anterior, declínio de 77,1 mil toneladas ou 1,3 milhão de sacas de 60 kg. Em São Paulo, a estimativa da produção também recuou 5,6%. Os cafezais sofreram com a incidência de altas temperaturas e falta de chuvas em um período importante do desenvolvimento da cultura, o que reduziu as estimativas de rendimento médio. Além disso, os preços não se encontravam tão atraentes, e os custos de produção foram relativamente elevados. Em relação a 2018, a produção do café arábica caiu 21,8%, representando uma produção de “ano de baixa”, devido à bienalidade característica dessa cultura.
Para o café canephora, mais conhecido como conillon, a produção estimada foi de 911,4 mil toneladas, ou 15,2 milhões de sacas de 60 kg, declinou 1,3%. A estimativa da produção da Bahia foi de 96,0 mil toneladas, ou 1,6 milhão de sacas de 60 kg, declínio de 11,1% em relação ao mês anterior. Espírito Santo e Rondônia, maiores produtores do País e responsáveis por 85,8% do total produzido na atual safra, mantiveram as estimativas do mês anterior. Apesar da retração de 15,5% na área plantada em relação ao ano anterior, a produção de café canephora cresceu 1,3%. Nesse comparativo, as produções foram maiores no Espírito Santo (7,4%) e em Rondônia (5,6%), e menor na Bahia (-31,6%). As produções capixaba e de Rondônia foram beneficiadas pelo clima este ano.
CEREAIS DE INVERNO (em grão) – A safra brasileira de inverno foi estimada em 6,9 milhões de toneladas, com o trigo participando com 79,8% do total, ou 5,5 milhões de toneladas, a aveia participando com 14,1%, ou 966,9 mil toneladas, e a cevada participando com 6,1%, ou 416,1 mil toneladas.
A área plantada do trigo, principal lavoura de inverno brasileira, foi 2,1 milhões de hectares. Houve queda de 5,9% na estimativa da produção em relação ao mês anterior, devido à redução de 5,8% no rendimento médio. No Paraná, maior produtor, com participação de 43,2% na produção nacional, a estimativa de produção foi de 2,4 milhões de toneladas, 12,9% a menos que no mês anterior, devido às geadas nas lavouras paranaenses.
O Rio Grande do Sul, que deve participar com 41,9% da produção nacional, a estimativa foi de 2,3 milhões de toneladas, 0,5% acima do mês anterior. No Sudeste, Minas Gerais informou uma estimativa da produção de 247,2 mil toneladas, crescimento de 24,6% em relação ao mês anterior. Em São Paulo, houve redução de 11,3% na estimativa da produção, devendo ser colhidas 250,2 mil toneladas. No Centro-Oeste, as estimativas da produção de Mato Grosso do Sul e de Goiás declinaram 21,2% e 9,7%, respectivamente. Em relação ao ano anterior, a produção tritícola brasileira apresenta crescimento de 3,1%.
A estimativa para a produção da aveia (966,9 mil toneladas) recuou 1,9% em relação a agosto devido à redução de 2,1% da produção no Rio Grande do Sul, que representa 70,8% da produção nacional. Em relação a 2018, a estimativa da produção de aveia cresceu 8,6%. Para a cevada, a produção estimada foi de 416,1 mil toneladas, com alta de 6,3% em relação a agosto. No Paraná, a estimativa de produção (257,8 mil toneladas) cresceu 9,6% em relação a agosto. A estimativa da produção gaúcha (142,9 mil toneladas) cresceu 1,4%. Em relação a 2018, a estimativa da produção de cevada cresceu 28,0%.
FEIJÃO (em grão) – A estimativa da produção foi de 3,1 milhões de toneladas, crescimento de 4,1% em relação ao mês anterior. Em relação a 2018, a produção total de feijão deverá ser 2,9% maior. A 1ª safra de feijão foi estimada em 1,3 milhão de toneladas, um aumento de 1,2% frente à estimativa de agosto, o que representou 14 986 toneladas. Destaque para Goiás que teve a estimativa de produção aumentada em 17,8% frente ao mês anterior. Em seguida, vieram Bahia, com redução de 5,9% e São Paulo, com aumento de 6,6% em relação a agosto.
Em relação a 2018, a produção da 1ª safra caiu 13,8%, com reduções em São Paulo (-27,1%), Paraná (-19,8%), Goiás (-17,2%), Ceará (-15,0%), Minas Gerais (-11,6%), Piauí (-14,8%), Santa Catarina (-20,5%), Rio Grande do Sul (-10,0%), Paraíba (-8,2%) e Distrito Federal (-29,8%). Em contrapartida, na Bahia, a estimativa de produção subiu 18,1%.
A 2ª safra de feijão foi estimada com um aumento de 3,1% frente a agosto. Influenciaram neste aumento as estimativas de São Paulo (+51,7%), Minas Gerais (+17,3%) e Paraná (+6,0%). Na Bahia, a estimativa de produção caiu 21,0%, ou menos 31 200 toneladas.
A estimativa de produção para a 2ª safra foi superior à de 2018 em 16,9%. Houve aumentos nas estimativas de produção da Bahia (357,2%), Minas Gerais (35,3%), São Paulo (125,9%) Paraná (32,9%), Mato Grosso do Sul (33,5%) e Goiás (25,3%). Em contrapartida, Mato Grosso reduziu sua estimativa em 49,9%. As maiores participações na produção para esta safra foram de: Paraná (31,2%), Minas Gerais (17,2%), Mato Grosso (10,8%) e Bahia (10,0%).
Para a 3ª safra de feijão, a previsão é a de um aumento de 13,6% na produção em relação a agosto. São Paulo foi a maior influência nesse resultado, com aumento de 120,0% na produção (54 000 toneladas). Outros incrementos foram informados por Minas Gerais (4,9%) e Goiás (5,9%). Em contrapartida, Mato Grosso do Sul informou uma redução de 62,3%. A estimativa de produção para a 3ª safra de feijão é 27,7% superior à de 2018. As Unidades da Federação responsáveis por esses aumentos foram São Paulo (31,0% ou 23 400 toneladas), Mato Grosso (112,2% ou 76 777 toneladas e Distrito Federal (101,7% ou 5 490 toneladas).
LARANJA – A estimativa da produção foi de 17,7 milhões de toneladas, ou 434,3 milhões de caixas de 40,8 kg, crescimento de 7,4% em relação ao mês anterior. Em São Paulo, principal produtor e responsável por 77,0% do total nacional, a produção foi estimada em 13,7 milhões de toneladas, ou 334,6 milhões de caixas de 40,8 kg, crescimento de 9,7% em relação ao mês anterior. Em relação a 2018, a produção de laranja cresceu 6,3%, sendo influenciada pela produção paulista, que teve alta de 8,5% em decorrência do aumento da produtividade, que alcançou 35 000 kg/ha. O cinturão citrícola de São Paulo destaca-se pelo elevado nível tecnológico, e a maior parte da sua produção de laranja é destinada ao processamento e produção de suco, importante produto na pauta das exportações brasileiras.
MILHO (em grão) – Em relação à última informação, a estimativa da produção cresceu 1,3%, totalizando 100,2 milhões de toneladas, novo recorde de produção da série histórica do IBGE. Ao todo, foi acrescida 1,3 milhão de toneladas. Em relação ao ano anterior, a estimativa da produção encontra-se 23,1% maio. Na 1ª safra de milho, a produção alcançou 26,0 milhões de toneladas, acréscimo de 1,2% em relação à última informação. Em relação ao ano anterior, a estimativa da produção foi 1,1% maior. Em setembro foram reavaliadas as produções de São Paulo (11,3% ou 22,3 mil toneladas), Minas Gerais (0,5% ou 23,3 mil toneladas), Paraná (0,6% ou 19,9 mil toneladas), Mato Grosso do Sul (28,2% ou 28,4 mil toneladas) e Goiás (0,2% ou 3,6 mil toneladas).
Para a 2ª safra, a estimativa da produção encontra-se em 74,1 milhões de toneladas, aumento de 1,4% em relação ao mês anterior, estando concentrada nos quatro maiores produtores do País: Mato Grosso (42,1% do total), Paraná (18,0%), Mato Grosso do Sul (13,3%) e Goiás (13,6%). Estas Unidades da Federação respondem juntos por 87,0% da produção nacional do milho 2ª safra. Este volume de produção de milho 2ª safra é recorde da série histórica do IBGE, e ficou 6,5 milhões de toneladas acima de 2017, até então, a maior produção obtida pelo País (67,6 milhões de toneladas).
Os aumentos mais expressivos na estimativa de produção, em relação a agosto, foram em Minas Gerais (35,0% ou 765,2 mil toneladas), Mato Grosso 1,2% ou 382,2 mil toneladas) e São Paulo (2,4% ou 56,4 mil toneladas). Em contrapartida, Paraná (-0,4%), Goiás (-1,1%) e Mato Grosso do Sul (-0,7%) informaram declínios na produção. Em decorrência do plantio antecipado da soja, houve um maior período para a “janela de plantio” do milho. Isso repercutiu positivamente no rendimento médio, que cresceu 20,4%, devendo alcançar 5 833 kg/ha.
TOMATE – A estimativa da produção (4,0 milhões de toneladas) cresceu 2,5% em relação a agosto, devido às reavaliações em São Paulo, onde a estimativa de produção cresceu 11,4%. Algumas novas áreas de lavouras foram detectadas, com os produtores investindo mais, em decorrência dos recentes aumentos no valor do produto. Outros crescimentos da produção informados no mês foram de Goiás (0,3%), Minas Gerais (0,8%), Rio de Janeiro (0,4%) e Ceará (0,1%). Em relação a 2018, a produção de tomate caiu 2,0%, a área plantada se reduziu em 3,4% e o rendimento médio subiu 1,6%.
ESTIMATIVAS DE SETEMBRO EM RELAÇÃO À SAFRA OBTIDA EM 2018
| Produção e variação anual por produto | |||
|---|---|---|---|
| Produto | Produção 2018 (t) | Produção 2019 (t) | Variação (%) |
| Algodão Herbáceo | 4.930.518 | 6.854.471 | 39,0 |
| Amendoim (1ª safra) | 546.517 | 548.289 | 0,3 |
| Amendoim (2ª safra) | 11.361 | 12.172 | 7,1 |
| Arroz | 11.736.353 | 10.326.974 | -12,0 |
| Aveia | 890.235 | 966.936 | 8,6 |
| Batata-inglesa (1ª safra) | 1.636.737 | 1.698.854 | 3,8 |
| Batata-inglesa (2ª safra) | 1.182.000 | 1.211.225 | 2,5 |
| Batata-inglesa (3ª safra) | 1.028.300 | 923.663 | -10,2 |
| Centeio | 8.184 | 9.661 | 18,0 |
| Cevada | 325.081 | 416.095 | 28,0 |
| Feijão (1ª safra) | 1.514.084 | 1.305.103 | -13,8 |
| Feijão (2ª safra) | 1.003.147 | 1.172.717 | 16,9 |
| Feijão (3ª safra) | 456.701 | 583.355 | 27,7 |
| Girassol | 137.969 | 128.311 | -7,0 |
| Mamona | 19.314 | 29.417 | 52,3 |
| Milho (1ª safra) | 25.743.077 | 26.020.398 | 1,1 |
| Milho (2ª safra) | 55.621.458 | 74.138.135 | 33,3 |
| Soja | 117.833.492 | 112.823.827 | -4,3 |
| Sorgo | 2.251.862 | 2.579.994 | 14,6 |
| Trigo | 5.305.067 | 5.468.084 | 3,1 |
| Triticale | 41.664 | 31.532 | -24,3 |
O Levantamento Sistemático da Produção Agrícola (LSPA) é uma pesquisa mensal de previsão e acompanhamento das safras dos principais produtos agrícolas. Em atenção a demandas dos usuários de informação de safra, os levantamentos para cereais (arroz, milho, aveia, centeio, cevada, sorgo, trigo e triticale), leguminosas (amendoim e feijão) e oleaginosas (caroço de algodão, mamona, soja e girassol) foram realizados em estreita colaboração com a Companhia Nacional de Abastecimento (Conab), órgão do Ministério de Agricultura, Pecuária e Abastecimento (MAPA), continuando um processo de harmonização das estimativas oficiais de safra, iniciado em março de 2007, para as principais lavouras brasileiras.
Estimativas de setembro indicam safra recorde de grãos para 2019. Estimativa indica safra deste ano 6,3% maior que a de 2018 e 1% acima do recorde de 2017
Em 2019, o país vai colher 240,7 milhões de tonelada de grãos, segundo o Levantamento Sistemático da Produção Agrícola (LSPA), divulgado hoje pelo IBGE. É o maior resultado da série histórica iniciada em 1975. Trata-se de um volume 6,3% maior que o da safra de 2018 e 1% acima do recorde de 2017, que chegou a 238,4 milhões de toneladas.
Além disso, são esperados recordes para duas culturas importantes: o milho e o algodão.
A safra de milho foi favorecida pela antecipação do plantio e pelas condições meteorológicas no período. Segundo o analista da pesquisa, Carlos Alberto Barradas, “o clima e os preços promissores estimularam os produtores a investir nessa cultura”. Em 2019, a produção de milho deve chegar a 100,2 milhões de toneladas, das quais cerca de 74,1 milhões são provenientes da segunda safra, que também atingiu seu maior volume.
Em 2019, o Brasil deve colher 6,9 milhões de toneladas de algodão, uma alta de 39% em relação a 2018. Esse recorde, segundo o analista do IBGE, se deveu ao clima favorável e à alta dos preços do produto no mercado internacional, graças à redução dos estoques na China. Cerca de 67,8% da produção de algodão do país sairão de Mato Grosso.
Em contrapartida, houve queda na produção de três culturas importantes: arroz, soja e café. Segundo Barradas, o arroz teve uma “drástica redução” em sua área plantada, principalmente no Rio Grande do Sul, cedendo terreno para a soja, que é mais rentável. “A introdução da cultura irrigada do arroz já permite a rotação dessas culturas”, explicou o analista do IBGE.
No caso do café, espera-se uma redução de 21,2% em relação à safra de 2018, devido à alternância entre anos de alta e de baixa produção, que é uma característica do produto. Já a soja foi prejudicada pela seca e as altas temperaturas que ocorreram durante o plantio, principalmente no Paraná, em São Paulo e Mato Grosso do Sul.
No entanto, Barradas salienta que a produção dessas três culturas ainda manteve um nível excelente, suficiente para atender a demanda desses produtos no país.
DOCUMENTO: https://agenciadenoticias.ibge.gov.br/agencia-sala-de-imprensa/2013-agencia-de-noticias/releases/25664-em-setembro-ibge-preve-alta-de-6-3-na-safra-de-2019
MAPA. CONAB. 10/10/2019. Estimativa. Safra de grãos 2019/20 indica produção de 245 milhões de toneladas, divulga Conab. Com esse resultado, safra atual mantém-se como recorde
O 1º levantamento da safra de grãos 2019/2020, divulgado nesta quinta-feira (10) pela Companhia Nacional de Abastecimento (Conab), revela que a produção brasileira está estimada em 245,8 milhões de toneladas, o que representa um aumento de 1,6% ou 3,9 milhões de toneladas, em comparação à safra 2018/19. Com isso, a safra atual mantém-se como recorde.
Na metodologia utilizada, foram utilizados cerca de 900 informantes, entre os dias 22 e 28 de setembro, para buscar informações relacionadas à intenção de plantio das culturas de verão que se iniciam. As produtividades estimadas para esta safra refletem condições normais de rendimento e são apuradas com a análise estatística das séries históricas e dos pacotes tecnológicos, existentes na base de dados da Companhia.
O resultado do estudo mostra que o milho primeira safra tem produção estimada em 26,3 milhões de toneladas, 2,5% superior à de 2018/19, com um crescimento de 1% na área, totalizando 4,14 milhões hectares. Já o milho segunda safra, que representa cerca de 70% do total do grão, começará a ser plantado após a colheita da soja, que está vigente no momento. A soja mantém a tendência de crescimento na área cultivada e aponta para crescimento de 1,9% em relação aos números anteriores, com 120,4 milhões de toneladas.
Segundo Silvio Farnese, diretor do Departamento de Comercialização e Abastecimento, o cenário é favorável e confirma o dinamismo da agricultura brasileira. “Nós temos um casamento perfeito quando a soja faz o primeiro movimento de plantio e o milho o segundo. Estamos dizendo que o Brasil economiza 19 milhões de hectares com essa tecnologia de sucessão de cultura leguminosa e gramíneas, são poucos países que fazem isso”, afirmou.
Com relação ao feijão primeira safra, devido a problemas de chuva na colheita nas safras anteriores, a primeira previsão de 2019/20 indica redução de 3,9% na área a ser cultivada. Neste momento, a cultura perde espaço para o milho e a soja, que apresentam melhor rentabilidade. Já o arroz tem uma produção de 10,6 milhões de t, 1,9% superior à de 2018/19, mesmo com redução de 0,6% na área a ser cultivada, totalizando 1,7 milhão de ha.
No caso do algodão, houve um pequeno acréscimo de 1,2% na área, alcançando 1,6 milhão de ha. Para o trigo, a safra 2019 ainda não foi totalmente colhida e a projeção é que este cereal alcance cerca de 5,1 milhões de toneladas.
Quanto à previsão da área plantada total no país, a expectativa é que sejam cultivados 63,9 milhões hectares, ou seja, uma variação positiva de 1,1% em comparação à safra passada.
Estudo: https://www.conab.gov.br/info-agro/safras/graos/boletim-da-safra-de-graos
ENERGIA
ANP. 10 de Outubro de 2019. 16ª Rodada da ANP tem recorde de arrecadação, com R$ 8,9 bilhões
A 16ª Rodada de Licitações arrecadou R$ 8,9 bilhões em bônus de assinatura, valor recorde entre as rodadas no regime de concessão já realizadas no Brasil. A rodada irá gerar investimentos de, pelo menos, R$ 1,58 bilhão apenas na primeira fase dos contratos de concessão (fase de exploração).
Foram arrematados 12 dos 36 blocos marítimos ofertados, com ágio médio de bônus de assinatura de 322,74%. O bloco C-M-541, na Bacia de Campos, teve o maior bônus de assinatura já ofertado para um bloco em rodadas de concessão, cerca de R$ 4,03 bilhões. Ao todo, 11 empresas, originárias de nove países, fizeram ofertas, sendo que dez arremataram blocos. A área total arrematada foi de cerca de 11,8 mil km².
Para o ministro de Minas e Energia, Bento Albuquerque, presente na sessão pública de ofertas, a licitação superou todas as expectativas. “O leilão teve recorde em arrecadação de bônus de assinatura. Isso mostra que a política para o setor de petróleo e gás natural está no rumo certo e abre novas perspectivas para o Leilão do Excedente da Cessão Onerosa e a 6ª Rodada de Partilha, que serão realizados este ano”, observou.
Já o diretor-geral da ANP, Décio Oddone, ressaltou a importância dos investimentos que serão gerados. “Como resultado dessa rodada, estimamos de três a quatro novas plataformas no litoral dos estados do Rio de Janeiro e São Paulo, uma produção de 400 a 500 mil barris por dia e arrecadação na ordem de R$ 100 bilhões em tributos e participações governamentais ao longo da vida dos projetos”, afirmou.
Além do ministro e do diretor-geral da ANP, também compareceram outras autoridades, representantes de empresas e os diretores da Agência Aurélio Amaral, Amorelli Júnior, Felipe Kury e Cesário Cecchi.
Veja abaixo os blocos arrematados na 16ª Rodada:
Nome da Bacia
|
Nome do Setor
|
Nome do Bloco
|
Empresa/Consórcio Vencedor
|
Bônus de assinatura (R$)
|
Campos
|
SC-AP4
|
C-M-477
|
Petrobras (70%)*; BP Energy (30%)
|
2.045.000.000,00
|
Campos
|
SC-AP4
|
C-M-541
|
Total E&P do Brasil (40%)*; Petronas (20%); QPI Brasil (40%)
|
4.029.302.001,00
|
Campos
|
SC-AP4
|
C-M-659
|
Shell Brasil (40%)*; QPI Brasil (25%); Chevron (35%)
|
714.000.000,96
|
Campos
|
SC-AUP3
|
C-M-479
|
ExxonMobil Brasil (100%)*
|
25.350.000,00
|
Campos
|
SC-AUP3
|
C-M-661
|
Petronas (100%)*
|
1.115.727.860,24
|
Campos
|
SC-AUP3
|
C-M-715
|
Petronas (100%)*
|
24.977.060,00
|
Campos
|
SC-AUP4
|
C-M-713
|
Shell Brasil (40%)*; QPI Brasil (25%); Chevron (35%)
|
550.800.000,31
|
Campos
|
SC-AUP4
|
C-M-795
|
Repsol (100%)*
|
9.528.800,00
|
Campos
|
SC-AUP4
|
C-M-825
|
Repsol (60%)*; Chevron (40%)
|
12.386.686,00
|
Campos
|
SC-AUP4
|
C-M-845
|
Chevron (40%)*; Wintershall Brasil (20%); Repsol (40%)
|
26.955.686,00
|
Santos
|
SS-AUP5
|
S-M-766
|
Chevron (40%)*; Wintershall Brasil (20%); Repsol (40%)
|
54.141.686,00
|
Santos
|
SS-AUP5
|
S-M-1500
|
BP Energy (100%)*
|
307.753.753,00
|
*Operadora
A assinatura dos contratos está prevista para ocorrer até o dia 14 de fevereiro de 2020.
________________
LGCJ.: