US ECONOMICS
GDP
DoC. BEA. September 26, 2019. Gross Domestic Product, Second Quarter 2019 (Third Estimate); Corporate Profits, Second Quarter 2019 (Revised)
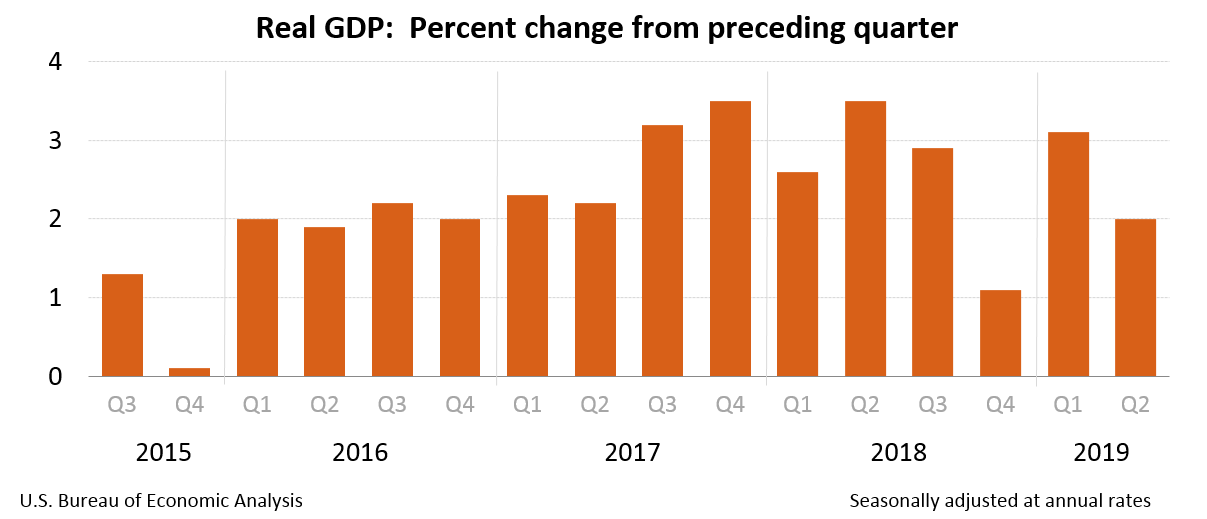
Real gross domestic product (GDP) increased at an annual rate of 2.0 percent in the second quarter of 2019 (table 1), according to the "third" estimate released by the Bureau of Economic Analysis. In the first quarter, real GDP increased 3.1 percent.
The GDP estimate released today is based on more complete source data than were available for the "second" estimate issued last month. In the second estimate, the increase in real GDP was also 2.0 percent. Downward revisions to personal consumption expenditures (PCE) and nonresidential fixed investment were primarily offset by upward revisions to state and local government spending and exports. Imports, which are a subtraction in the calculation of GDP, were revised down (see "Updates to GDP" on page 2).
The increase in real GDP in the second quarter reflected positive contributions from PCE, federal government spending, and state and local government spending that were partly offset by negative contributions from private inventory investment, exports, nonresidential fixed investment, and residential fixed investment (table 2).
The deceleration in real GDP in the second quarter primarily reflected downturns in inventory investment, exports, and nonresidential fixed investment. These downturns were partly offset by accelerations in PCE and federal government spending.
Real gross domestic income (GDI) increased 1.8 percent in the second quarter, compared with an increase of 3.2 percent in the first quarter. The average of real GDP and real GDI, a supplemental measure of U.S. economic activity that equally weights GDP and GDI, increased 1.9 percent in the second quarter, compared with an increase of 3.2 percent in the first quarter (table 1).
Current-dollar GDP increased 4.7 percent, or $241.5 billion, in the second quarter to a level of $21.34 trillion. In the first quarter, current-dollar GDP increased 3.9 percent, or $201.0 billion (tables 1 and 3).
The price index for gross domestic purchases increased 2.2 percent in the second quarter, compared with an increase of 0.8 percent in the first quarter (table 4). The PCE price index increased 2.4 percent, compared with an increase of 0.4 percent. Excluding food and energy prices, the PCE price index increased 1.9 percent, compared with an increase of 1.1 percent.
Updates to GDP
The second-quarter percent change in real GDP was the same as previously estimated. Downward revisions to PCE and nonresidential fixed investment were primarily offset by upward revisions to state and local government spending and exports, and a downward revision to imports. For more information, see the Technical Note. A detailed "Key Source Data and Assumptions" file is also posted for each release. For information on updates to GDP, see the "Additional Information" section that follows.
| Advance Estimate | Second Estimate | Third Estimate | |
|---|---|---|---|
| (Percent change from preceding quarter) | |||
| Real GDP | 2.1 | 2.0 | 2.0 |
| Current-dollar GDP | 4.6 | 4.6 | 4.7 |
| Real GDI | … | 2.1 | 1.8 |
| Average of Real GDP and Real GDI | … | 2.1 | 1.9 |
| Gross domestic purchases price index | 2.2 | 2.2 | 2.2 |
| PCE price index | 2.3 | 2.3 | 2.4 |
Corporate Profits
Profits from current production (corporate profits with inventory valuation and capital consumption adjustments) increased $75.8 billion in the second quarter, in contrast to a decrease of $78.7 billion in the first quarter (table 10).
Profits of domestic financial corporations increased $2.5 billion in the second quarter, compared with an increase of $22.2 billion in the first quarter. Profits of domestic nonfinancial corporations increased $34.7 billion, in contrast to a decrease of $108.2 billion. Rest-of-the-world profits increased $38.7 billion, compared with an increase of $7.3 billion. In the second quarter, receipts increased $25.3 billion, and payments decreased $13.4 billion.
FULL DOCUMENT: https://www.bea.gov/system/files/2019-09/gdp2q19_3rd.pdf
INTERNATIONAL TRADE
DoC. U.S. Census Bureau. 09/26/2019. Advance U.S. International Trade in Goods
The advance international trade deficit in goods increased to $72.8 billion in August from $72.5 billion in July as imports increased more than exports.
- August 2019: 72.8° $ billion
- July 2019: 72.5° $ billion
(*) The 90% confidence interval includes zero. The Census Bureau does not have sufficient statistical evidence to conclude that the actual change is different from zero.
(°) Statistical significance is not applicable or not measurable for these surveys. The Manufacturers’ Shipments, Inventories and Orders estimates are not based on a probability sample, so we can neither measure the sampling error of these estimates nor compute confidence intervals.
(r) Revised.
All estimates are seasonally adjusted except for the Rental Vacancy Rate, Home Ownership Rate, Quarterly Financial Report for Retail Trade, and Quarterly Services Survey. None of the estimates are adjusted for price changes.
MONETARY POLICY
FED. September 26, 2019. Speech. The Federal Reserve’s Review of Its Monetary Policy Strategy, Tools, and Communication Practices. Vice Chair Richard H. Clarida. At “A Hot Economy: Sustainability and Trade-Offs,” a Fed Listens event sponsored by the Federal Reserve Bank of San Francisco, San Francisco, California
I am delighted to be in San Francisco today to participate in this Fed Listens conference, "A Hot Economy: Sustainability and Trade-Offs," which is one of a series of events associated with the Federal Reserve's 2019 review of our monetary policy strategy, tools, and communication practices.1
Motivation for the Review
Although I will have more to say about the review in a moment, let me state at the outset that we believe our existing framework, which has been in place since 2012, has served us well and has enabled us to achieve and sustain our statutorily assigned goals of maximum employment and price stability. However, we also believe now is a good time to step back and assess whether, and in what possible ways, we can refine our strategy, tools, and communication practices to achieve and maintain our goals as consistently and robustly as possible.2
With the U.S. economy operating at or close to maximum employment and price stability, now is an especially opportune time to conduct this review. The unemployment rate is near a 50-year low, and inflation is running close to our 2 percent objective. With this review, we hope to ensure that we are well positioned to continue to meet our statutory goals in coming years.
The U.S. and foreign economies have changed in some important ways since the Global Financial Crisis. Perhaps most significantly, neutral interest rates appear to have fallen in the United States.3 A fall in neutral rates increases the likelihood that a central bank's policy rate will hit its effective lower bound (ELB) in future economic downturns. That development, in turn, could make it more difficult during downturns for monetary policy to support spending and employment and to keep inflation from falling too far below the 2 percent objective.4
Another key development in recent decades is that price inflation appears less responsive to resource slack. That is, the short-run price Phillips curve—if not the wage Phillips curve—appears to have flattened, implying a change in the dynamic relationship between inflation and employment.5 A flatter Phillips curve permits the Federal Reserve to support employment more aggressively during downturns—as was the case during and after the Great Recession—because a sustained inflation breakout is less likely when the Phillips curve is flatter.6 However, a flatter Phillips curve also increases the cost, in terms of lost economic output, of reversing unwelcome increases in longer-run inflation expectations. Thus, a flatter Phillips curve makes it all the more important that inflation expectations remain anchored at levels consistent with our 2 percent inflation objective.7 And let me emphasize that, based on the evidence I have reviewed, I judge that U.S. inflation expectations today do reside in a range I consider consistent with our price‑stability mandate.
A Robust U.S. Labor Market
For some time now, price stability in the United States has coincided with a historically low unemployment rate. This low unemployment rate, 3.7 percent in August, has been interpreted by many as suggesting that the labor market is currently operating beyond full employment. However, we cannot directly observe the level of the unemployment rate that is consistent with full employment and price stability, u*, but must infer it from data via models. I myself believe that the range of plausible estimates of u* extends to 4 percent and below and includes the current unemployment rate of 3.7 percent. As the unemployment rate has declined in recent years, labor force participation for people in their prime working years has increased significantly, with the August participation rate at a cycle high of 82.6 percent.8 Increased prime-age participation has provided employers with additional labor resources and has been one factor, along with a pickup in labor productivity, restraining inflationary pressures. Whether participation will continue to increase in a tight labor market remains to be seen. But I note that prime-age participation still remains below levels seen in previous business cycle expansions.
Also, although the labor market is robust, there is no evidence that rising wages are putting upward pressure on price inflation. Wages today are increasing broadly in line with productivity growth and underlying inflation. Also of note, and receiving less attention than it deserves, is the material increase in labor's share of national income that has occurred in recent years as the labor market has tightened. As I have written before, there is a cyclical regularity in U.S. data that labor's share tends to rise as expansions endure and the labor market tightens.9 In recent cycles—and thus far in this cycle—this rise in labor's share has not put upward pressure on price inflation.
The strong job gains of recent years also have delivered benefits to groups that have historically been disadvantaged in the labor market. For example, African Americans and Hispanics have experienced persistently higher unemployment rates than whites for many decades.10 However, those unemployment rate gaps have narrowed as the labor market has strengthened, and, as President Daly's research shows, there is some indication these groups especially benefit when the unemployment rate remains very low.11 Likewise, the gaps between unemployment rates for less-educated workers and their more-educated counterparts appear to narrow as the labor market strengthens.12 Wage increases in the past couple of years have been strongest for less-educated workers and for those at the lower end of the wage distribution.13
Scope of the Review
The Federal Reserve Act assigns to the Fed the responsibility to conduct monetary policy "so as to promote effectively the goals of maximum employment, stable prices, and moderate long-term interest rates."14 Our review this year takes this statutory mandate as given and also takes as given that inflation at a rate of 2 percent is most consistent over the longer run with the congressional mandate.
Our existing monetary policy strategy is laid out in the Committee's Statement on Longer-Run Goals and Monetary Policy Strategy.15 First adopted in January 2012, the statement indicates that the Committee seeks to mitigate deviations of inflation from 2 percent and deviations of employment from assessments of its maximum level. In doing so, the Federal Open Market Committee (FOMC) recognizes that these assessments of maximum employment are necessarily uncertain and subject to revision.
As a practical matter, our current strategy shares many elements with the policy framework known as "flexible inflation targeting."16 However, the Fed's mandate is much more explicit about the role of employment than that of most flexible inflation-targeting central banks, and our statement reflects this by stating that when the two sides of the mandate are in conflict, neither one takes precedence over the other.
The review of our current framework is wide ranging, and we are not prejudging where it will take us, but events of the past decade highlight three broad questions that we will seek to answer with our review.
Three Questions
The first question is, "Can the Federal Reserve best meet its statutory objectives with its existing monetary policy strategy, or should it consider strategies that aim to reverse past misses of the inflation objective?"
Under our current approach as well as the approaches of many central banks around the world, persistent inflation shortfalls of the target are treated as "bygones." Central banks are generally believed to have effective tools for preventing persistent inflation overshoots, but the ELB on interest rates makes persistent undershoots more of a challenge. Persistent inflation shortfalls carry the risk that longer-term inflation expectations become anchored below the stated inflation goal.17
In part because of that concern, some economists have advocated "makeup" strategies under which policymakers seek to undo past inflation deviations from target. These strategies include targeting average inflation and price-level targeting, in which policymakers seek to stabilize the price level around a constant growth path.18 Other makeup strategies seek to reverse shortfalls in policy accommodation at the ELB by keeping the policy rate lower for longer than otherwise would be the case.19 In many models that incorporate the ELB, these makeup strategies lead to better average performance on both legs of the dual mandate.20
The success of makeup strategies relies on households and firms believing in advance that the makeup will, in fact, be delivered when the time comes—for example, that a persistent inflation shortfall will be met by future inflation above 2 percent. As is well known from the research literature, makeup strategies, in general, are not time consistent because when the time comes to push inflation above 2 percent, conditions at that time will not justify that action. Thus, one of the most important questions we will seek to answer in our review is whether the Fed could, in practice, attain the benefits of makeup strategies that are possible in theoretical models.
The next question the review will consider is, "Are existing monetary policy tools adequate to achieve and maintain maximum employment and price stability, or should the toolkit be expanded? And, if so, how?" The FOMC's primary monetary policy tool is its target range for the federal funds rate. In December 2008, the FOMC cut that target to just above zero in response to financial turmoil and deteriorating economic conditions. Because the U.S. economy required additional support after the ELB was reached, the FOMC deployed two additional tools in the years following the crisis: balance sheet policies and forward guidance about the likely path of the federal funds rate.21
In addition to assessing the efficacy of these existing tools, the review will examine additional tools for easing policy when the ELB is binding. During the crisis and its aftermath, the Federal Reserve considered but ultimately found some of the tools deployed by other central banks wanting in the U.S. context. But the review will reassess the case for these and other tools in light of more recent experience with using these tools in other countries.
The third question the review will consider is, "How can the FOMC's communication of its policy framework and implementation be improved?" Our communication practices have evolved considerably since 1994, when the Federal Reserve released the first statement after an FOMC meeting. Over the past decade or so, the FOMC has enhanced its communication both to promote public understanding of its policy goals, strategy, and actions and to foster democratic accountability. These enhancements include the Statement on Longer-Run Goals and Monetary Policy Strategy; postmeeting press conferences; various statements about the principles and strategy guiding the Committee's normalization of monetary policy; and quarterly summaries of individual FOMC participants' economic projections, assessments about the appropriate path of the federal funds rate, and judgments of the uncertainty and balance of risks around their projections.22
As part of the review, we will assess the Committee's current and past communications and additional forms of communication that could be helpful. For example, there might be ways to improve communication about the coordination of policy tools or the interplay between monetary policy and financial stability.
Activities and Timeline for the Review
Let me turn now to our review process itself.23 At our Fed Listens events, we are hearing from a broad range of interested individuals and groups, including business and labor leaders, community development professionals, and academics. At a research conference at the Federal Reserve Bank of Chicago in early June, we heard from prominent academic economists as well as national and community leaders. One panel discussion provided a valuable perspective on the labor market that could not otherwise be gleaned from the aggregate statistics we often consult. Another panel discussion offered insights into how the monetary levers we pull and push affect communities, credit availability, and small businesses. In addition to the Chicago conference, all 12 Reserve Banks and the Board of Governors have hosted or will soon host Fed Listens events.
This summer, the FOMC began to assess what we have learned at the Fed Listens events and to receive briefings from System staff on topics relevant to the review.24 At our July meeting, FOMC participants agreed that our current framework for monetary policy has served the Committee and the U.S. economy well over the past decade. FOMC participants noted that the Committee's experience with forward guidance and asset purchases has improved its understanding of how these tools operate. As a result, the Committee could proceed more confidently in using these tools in the future if economic circumstances warranted. However, overall, we judged that forward guidance and balance sheet tools, while helpful, did not eliminate the risk of returning to the ELB. If forward guidance or balance sheet actions prove to be insufficient in future episodes, ELB constraints could impede the attainment of the Federal Reserve's dual-mandate objectives over time. At our July meeting, we also noted that the Committee's Statement on Longer-Run Goals and Monetary Policy Strategy has been helpful in articulating and clarifying the Federal Reserve's approach to monetary policy and agreed that any changes we might make to our strategy would likely call for some modification of this consensus statement.
We have much still to discuss at upcoming meetings. I expect we will consider various topics, such as alternative policy strategies, options for enhanced use of existing monetary policy tools, possible additions to the policy toolkit, potential changes to communication practices, and the relationship between monetary policy and financial stability. We will share our findings with the public when we have completed our review, likely during the first half of next year.
Concluding Thoughts
The economy is constantly evolving, bringing with it new policy challenges. So it makes sense for us to remain open minded as we assess current practices and consider ideas that could potentially enhance our ability to deliver on the goals the Congress has assigned us. For this reason, my colleagues and I do not want to preempt or to predict our ultimate findings. What I can say is that any refinements or more material changes to our framework that we might make will be aimed solely at enhancing our ability to achieve and sustain our dual-mandate objectives in the world we live in today.
Thank you very much for your time and attention. I look forward to the excellent program President Daly and her team have put together.
References
Aaronson, Stephanie R., Mary C. Daly, William Wascher, and David W. Wilcox (2019). "Okun Revisited: Who Benefits Most from a Strong Economy? (PDF)" paper presented at the Brookings Papers on Economic Activity Conference, held at the Brookings Institution, Washington, March 7–8.
Adam, Klaus, and Roberto M. Billi (2007). "Discretionary Monetary Policy and the Zero Lower Bound on Nominal Interest Rates," Journal of Monetary Economics, vol. 54 (April), pp. 728–52.
Bank for International Settlements (2017). 87th Annual Report (PDF). Basel, Switzerland: BIS, June.
Bauer, Michael D., and Glenn D. Rudebusch (2014). "The Signaling Channel for Federal Reserve Bond Purchases (PDF)," International Journal of Central Banking, vol. 10 (September), pp. 233–89.
Baumeister, Christiane, and Luca Benati (2013). "Unconventional Monetary Policy and the Great Recession: Estimating the Macroeconomic Effects of a Spread Compression at the Zero Lower Bound (PDF)," International Journal of Central Banking, vol. 9 (June), pp. 165–212.
Berg, Claes, and Lars Jonung (1999). "Pioneering Price Level Targeting: The Swedish Experience 1931–1937," Journal of Monetary Economics, vol. 43 (June), pp. 525–51.
Bernanke, Ben S. (2007). "Federal Reserve Communications," speech delivered at the Cato Institute 25th Annual Monetary Conference, Washington, November 14.
——— (2017). "Temporary Price-Level Targeting: An Alternative Framework for Monetary Policy," Ben Bernanke's Blog, October 12.
Blanchard, Olivier, Eugenio Cerutti, and Lawrence Summers (2015). "Inflation and Activity—Two Explorations and their Monetary Policy Implications (PDF)," IMF Working Paper WP/5/230. Washington: International Monetary Fund, November.
Board of Governors of the Federal Reserve System (2018a). Monetary Policy Report. Washington: Board of Governors, February.
——— (2018b). Monetary Policy Report. Washington: Board of Governors, July.
——— (2019a). Monetary Policy Report. Washington: Board of Governors, February.
——— (2019b). "Minutes of the Federal Open Market Committee, July 30–31, 2019," press release, August 21.
Boivin, Jean, and Marc P. Giannoni (2006). "Has Monetary Policy Become More Effective?" Review of Economics and Statistics, vol. 88 (August), pp. 445–62.
Boivin, Jean, Michael T. Kiley, and Frederic S. Mishkin (2010). "How Has the Monetary Transmission Mechanism Evolved over Time?" in Benjamin M. Friedman and Michael Woodford, eds., Handbook of Monetary Economics, vol. 3. Amsterdam: Elsevier, pp. 369–422.
Brand, Claus, Marcin Bielecki, and Adrian Penalver (2018). "The Natural Rate of Interest: Estimates, Drivers, and Challenges to Monetary Policy (PDF)," Occasional Paper Series 217. Frankfurt: European Central Bank, December.
Bullard, James (2018). "The Case of the Disappearing Phillips Curve (PDF)," speech delivered at the 2018 ECB Forum on Central Banking, Sintra, Portugal, June 19.
Cajner, Tomaz, Tyler Radler, David Ratner, and Ivan Vidangos (2017). "Racial Gaps in Labor Market Outcomes in the Last Four Decades and over the Business Cycle (PDF)," Finance and Economics Discussion Series 2017-071. Washington: Board of Governors of the Federal Reserve System, June.
Campbell, Jeffrey R., Charles L. Evans, Jonas D.M. Fisher, and Alejandro Justiniano (2012). "Macroeconomic Effects of Federal Reserve Forward Guidance (PDF)," Brookings Papers on Economic Activity, Spring, pp. 1–80.
Campbell, Jeffrey R., Jonas D.M. Fisher, Alejandro Justiniano, and Leonardo Melosi (2017). "Forward Guidance and Macroeconomic Outcomes since the Financial Crisis," in Martin Eichenbaum and Jonathan A. Parker, eds., NBER Macroeconomics Annual 2016, vol. 31. Chicago: University of Chicago Press, pp. 283–357.
Cecchetti, Stephen G., Michael E. Feroli, Peter Hooper, Anil K. Kashyap, and Kermit L. Schoenholtz (2017). Deflating Inflation Expectations: The Implications of Inflation's Simple Dynamics (PDF), report prepared for the 2017 U.S. Monetary Policy Forum, sponsored by the Initiative on Global Markets at the University of Chicago Booth School of Business, held in New York, March 3.
Chen, Han, Vasco Cúrdia, and Andrea Ferrero (2012). "The Macroeconomic Effects of Large‐Scale Asset Purchase Programmes," Economic Journal, vol. 122 (November), pp. F289–315.
Chung, Hess, Etienne Gagnon, Taisuke Nakata, Matthias Paustian, Bernd Schlusche, James Trevino, Diego Vilán, and Wei Zheng (2019). "Monetary Policy Options at the Effective Lower Bound: Assessing the Federal Reserve's Current Policy Toolkit (PDF)," Finance and Economics Discussion Series 2019-003. Washington: Board of Governors of the Federal Reserve System, January.
Clarida, Richard H. (2012). "What Has—and Has Not—Been Learned about Monetary Policy in a Low‐Inflation Environment? A Review of the 2000s," Journal of Money, Credit and Banking, vol. 44, s1 (February), pp. 123–40.
——— (2016). "Good News for the Fed," International Economy, Spring, pp. 44–45 and 75–76.
Clarida, Richard, Jordi Galí, and Mark Gertler (2000). "Monetary Policy Rules and Macroeconomic Stability: Evidence and Some Theory," Quarterly Journal of Economics, vol. 115 (February), pp. 147–80.
Clinton, Kevin, Charles Freedman, Michel Juillard, Ondra Kamenik, Douglas Laxton, and Hou Wang (2015). "Inflation-Forecast Targeting: Applying the Principle of Transparency (PDF)," IMF Working Paper WP/15/132. Washington: International Monetary Fund, June.
D'Amico, Stefania, William English, David López‐Salido, and Edward Nelson (2012). "The Federal Reserve's Large‐Scale Asset Purchase Programmes: Rationale and Effects," Economic Journal, vol. 122 (November), pp. F415–46.
D'Amico, Stefania, and Thomas B. King (2013). "Flow and Stock Effects of Large‐Scale Treasury Purchases: Evidence on the Importance of Local Supply," Journal of Financial Economics, vol. 108 (May), pp. 425–48.
Economic Policy Institute (2019). State of Working America Data Library. Washington: EPI, March.
Eggertsson, Gauti B., and Michael Woodford (2003). "The Zero Bound on Interest Rates and Optimal Monetary Policy (PDF)," Brookings Papers on Economic Activity, no. 1, pp. 139–235.
Engen, Eric M., Thomas Laubach, and David Reifschneider (2015). "The Macroeconomic Effects of the Federal Reserve's Unconventional Monetary Policies (PDF)," Finance and Economics Discussion Series 2015-005. Washington: Board of Governors of the Federal Reserve System, January.
English, William B., David López-Salido, and Robert Tetlow (2015). "The Federal Reserve's Framework for Monetary Policy: Recent Changes and New Questions," IMF Economic Review, vol. 63 (May), pp. 22–70.
Erceg, Christopher, James Hebden, Michael Kiley, David López-Salido, and Robert Tetlow (2018). "Some Implications of Uncertainty and Misperception for Monetary Policy (PDF)," Finance and Economics Discussion Series 2018-059. Washington: Board of Governors of the Federal Reserve System, August.
Faust, Jon, and Jonathan H. Wright (2013). "Forecasting Inflation," in Graham Elliott, Clive Grander, and Allan Timmermann, eds., Handbook of Economic Forecasting, vol. 2A. Amsterdam: Elsevier, pp. 2–56.
Fuhrer, Jeffrey, Giovanni Olivei, Eric Rosengren, and Geoffrey Tootell (2018). "Should the Fed Regularly Evaluate Its Monetary Policy Framework? (PDF)" paper presented at the Brookings Papers on Economic Activity Conference, Fall, held at the Brookings Institution, Washington, September 13–14.
Gagnon, Joseph, Matthew Raskin, Julie Remache, and Brian P. Sack (2011). "Large-Scale Asset Purchases by the Federal Reserve: Did They Work? (PDF)" FRBNY Economic Policy Review, vol. 17 (May), pp. 41–59.
Hamilton, James D., and Jing Cynthia Wu (2012). "The Effectiveness of Alternative Monetary Policy Tools in a Zero Lower Bound Environment," Journal of Money, Credit and Banking, vol. 44, s1 (February), pp. 3–46.
Hebden, James, and David López-Salido (2018). "From Taylor's Rule to Bernanke's Temporary Price Level Targeting (PDF)," Finance and Economics Discussion Series 2018-051. Washington: Board of Governors of the Federal Reserve System, July.
Hills, Timothy S., Taisuke Nakata, and Sebastian Schmidt (2016). "The Risky Steady State and the Interest Rate Lower Bound (PDF)," Finance and Economics Discussion Series 2016-009. Washington: Board of Governors of the Federal Reserve System, January.
Holston, Kathryn, Thomas Laubach, and John C. Williams (2017). "Measuring the Natural Rate of Interest: International Trends and Determinants," Journal of International Economics, vol. 108, Supplement 1 (May), pp. S59–75.
Joyce, Michael, Ana Lasaosa, Ibrahim Stevens, and Matthew Tong (2011). "The Financial Market Impact of Quantitative Easing in the United Kingdom (PDF)," International Journal of Central Banking, vol. 7 (September), pp. 113–61.
Joyce, Michael, David Miles, Andrew Scott, and Dimitri Vayanos (2012). "Quantitative Easing and Unconventional Monetary Policy—An Introduction," Economic Journal, vol. 122 (November), pp. F271–88.
Kiley, Michael T., and John M. Roberts (2017). "Monetary Policy in a Low Interest Rate World (PDF)," Brookings Papers on Economic Activity, Spring, pp. 317–96.
King, Mervyn, and David Low (2014). "Measuring the 'World' Real Interest Rate," NBER Working Paper Series 19887. Cambridge, Mass.: National Bureau of Economic Research, February.
Mishkin, Frederic S. (2007). "Monetary Policy and the Dual Mandate," speech delivered at Bridgewater College, Bridgewater, Va., April 10.
Nakov, Anton (2008). "Optimal and Simple Monetary Policy Rules with Zero Floor on the Nominal Interest Rate (PDF)," International Journal of Central Banking, vol. 4 (June), pp. 73–127.
Nessén, Marianne, and David Vestin (2005). "Average Inflation Targeting," Journal of Money, Credit and Banking, vol. 37 (October), pp. 837–63.
Rachel, Lukasz, and Thomas D. Smith (2017). "Are Low Real Interest Rates Here to Stay? (PDF)" International Journal of Central Banking, vol. 13 (September), pp. 1–42.
Reifschneider, David L., and John C. Williams (2000). "Three Lessons for Monetary Policy in a Low-Inflation Era," Journal of Money, Credit and Banking, vol. 32 (November), pp. 936–66.
Roberts, John M. (2006). "Monetary Policy and Inflation Dynamics," International Journal of Central Banking, vol. 2 (September), pp. 193–230.
Romer, David (2010). "A New Data Set on Monetary Policy: The Economic Forecasts of Individual Members of the FOMC," Journal of Money, Credit and Banking, vol. 42 (August), pp. 951–57.
Ruge-Murcia, Francisco (2014). "Do Inflation-Targeting Central Banks Implicitly Target the Price Level? (PDF)" International Journal of Central Banking, vol. 10 (June), pp. 301–26.
Simon, John, Troy Matheson, and Damiano Sandri (2013). "The Dog That Didn't Bark: Has Inflation Been Muzzled or Was it Just Sleeping? (PDF)" in World Economic Outlook: Hopes, Realities, Risks. Washington: International Monetary Fund, April, pp. 79–95.
Swanson, Eric T. (2017). "Measuring the Effects of Federal Reserve Forward Guidance and Asset Purchases on Financial Markets," NBER Working Paper Series 23311. Cambridge, Mass.: National Bureau of Economic Research, April (revised August 2018).
——— (2018). "The Federal Reserve Is Not Very Constrained by the Lower Bound on Nominal Interest Rates," NBER Working Paper Series 25123. Cambridge, Mass.: National Bureau of Economic Research, October.
Weingarden, Alison (2017). "Labor Market Outcomes in Metropolitan and Non-Metropolitan Areas: Signs of Growing Disparities," FEDS Notes. Washington: Board of Governors of the Federal Reserve System, September 25.
Woodford, Michael (2012). "Methods of Policy Accommodation at the Interest-Rate Lower Bound (PDF)," paper presented at "The Changing Policy Landscape," a symposium sponsored by the Federal Reserve Bank of Kansas City, held in Jackson Hole, Wyo., August 30–September 1.
Yellen, Janet (2015). "Inflation Dynamics and Monetary Policy," speech delivered at the Philip Gamble Memorial Lecture, University of Massachusetts, Amherst, September 24.
——— (2017). "The Economic Outlook and the Conduct of Monetary Policy," speech delivered at the Stanford Institute for Economic Policy Research, Stanford University, Stanford, Calif., January 19.
Notes
1. These remarks represent my own views, which do not necessarily represent those of the Federal Reserve Board or the Federal Open Market Committee.
2. Fuhrer and others (2018) explore the desirability of comprehensive reviews of the monetary policy framework. They argue that such reviews may help the Fed more effectively identify and implement needed changes to its framework.
3. For evidence of a fall in neutral rates of interest in the United States and abroad, see, among several contributions, King and Low (2014); Holston, Laubach, and Williams (2017); Rachel and Smith (2017); and Brand, Bielecki, and Penalver (2018).
4. For assessments of the risks that U.S. monetary policy will be constrained by the ELB and its implications for economic activity and inflation, see Kiley and Roberts (2017), Erceg and others (2018), Swanson (2018), and Chung and others (2019).
5. For evidence of a flattening of the slope of the Phillips curve in the United States and abroad, see, among others, Simon, Matheson, and Sandri (2013); Blanchard, Cerutti, and Summers (2015); and Bank for International Settlements (2017).
6. One potential contributor to the flattening of the Phillips curve is a change in the conduct of monetary policy since the 1980s toward greater stabilization of inflation and economic activity; for evidence of such a change, see Clarida, Galí, and Gertler (2000); Boivin and Giannoni (2006); and Boivin, Kiley, and Mishkin (2010). As discussed in Roberts (2006) and Bullard (2018), greater stabilization on the part of a central bank can lead to the estimation of flatter Phillips curves in reduced-form regressions. Similarly, the adoption of an explicit inflation objective, along with greater certainty regarding the conduct of monetary policy, can help anchor longer-term inflation expectations and stabilize actual inflation in response to shocks.
7. See Yellen (2015) for a discussion of inflation dynamics and monetary policy; see Erceg and others (2018) for a quantitative exploration of the monetary policy implications of a flat Phillips curve in an uncertain economic environment. Since the mid-1980s, movements in both realized inflation and measures of longer-term inflation expectations have been somewhat muted, complicating the task of extracting the precise role of inflation expectations as a determinant of realized inflation. Faust and Wright (2013) review the literature on inflation forecasting and present evidence in support of the conclusion that measures of inflation expectations help predict the trend in inflation. Cecchetti and others (2017) showed that while the level of realized inflation and four-quarter-ahead inflation expectations are positively correlated, changes in these variables have been largely uncorrelated since the mid-1980s. These authors suggest that, in a low and stable inflation environment, policymakers should pay attention to a wide array of other indicators in determining the implications of movements in realized inflation and measures of inflation expectations.
8. The box "The Labor Force Participation Rate for Prime-Age Individuals" in the Board's July 2018 Monetary Policy Report contains a discussion of recent developments in labor force participation rates for prime-age individuals; see Board of Governors (2018b, pp. 8–10).
9. See Clarida (2016).
10. See Cajner and others (2017) for a careful examination of how labor market differentials by race and ethnicity have evolved over time.
11. See Aaronson and others (2019) for evidence on the relative behavior of unemployment rates by race and ethnicity in a strong labor market. The authors find similar patterns for labor force participation rates and for employment-to-population ratios.
12. Disparities in labor market outcomes are also evident between urban and rural areas of the United States. However, these gaps have not narrowed as the labor market has strengthened. The box "Employment Disparities between Rural and Urban Areas" in the Board's February 2019 Monetary Policy Report examines these disparities in more detail; see Board of Governors (2019, pp. 10–12). See also Weingarden (2017).
13. Wage gains for workers with different wage levels and with different levels of education can be calculated using data from the Current Population Survey from the Bureau of Labor Statistics. The Economic Policy Institute (2019) provides convenient tabulations of these data.
14. Even though the act lists three distinct goals, the Federal Reserve's mandate for monetary policy is commonly known as the "dual mandate." The reason is that an economy in which people who want to work either have a job or are likely to find one fairly quickly and in which the price level (meaning a broad measure of the price of goods and services purchased by consumers) is stable creates the conditions needed for interest rates to settle at moderate levels. For a discussion, see Mishkin (2007). Quoted text from the Federal Reserve Act is in 12 U.S.C. § 225a (2000), https://www.federalreserve.gov/aboutthefed/section2a.htm.
15. The statement is available on the Board's website at https://www.federalreserve.gov/monetarypolicy/files/FOMC_LongerRunGoals.pdf.
16. For a discussion of this terminology and references, see English, López-Salido, and Tetlow (2015) and Clinton and others (2015).
17. These risks could be exacerbated if households and businesses expect monetary policy to be insufficiently accommodative because of proximity to the ELB. For related discussions, see Reifschneider and Williams (2000); Adam and Billi (2007); Nakov (2008); and Hills, Nakata, and Schmidt (2016).
18. Eggertsson and Woodford (2003) provide an early discussion of how optimal monetary policy at the ELB entails a commitment to reflate the price level during the subsequent economic expansion. Nessén and Vestin (2005) discuss the relationship between average inflation targeting and price-level targeting. There is a dearth of empirical evidence on strategies seeking to make up for inflation deviations. Central banks that pursue an inflation goal generally seek to achieve a specific rate of inflation by some time horizon—typically a couple of years ahead or over the "medium run"—without regard to past inflation deviations. One exception is the Reserve Bank of Australia, whose inflation goal is specified as a range of 2–3 percent, on average, over the medium term" and thus might embed some notion of history dependence. However, Ruge-Murcia (2014) argues that the drift in the price level in Australia is comparable with the drifts observed in economies with purely forward-looking specification of the inflation goal. The only known historical example of price-level targeting occurred in Sweden from 1931 to 1933 when the country abandoned the gold standard and attempted instead to maintain its price level. The temporary adoption of price-level targeting is credited with helping Sweden avoid deflation, an outcome that contrasted with that in countries that stayed on the gold standard. See Berg and Jonung (1999).
See Bernanke (2017) for a discussion of a temporary price-level targeting strategy. See Hebden and López-Salido (2018) for a quantitative assessment of that and other strategies. See also Kiley and Roberts (2017) for a strategy in which policymakers aim for inflation higher than 2 percent during economic expansions to compensate for below-target realizations of inflation during economic downturns.
19. See Reifschneider and Williams (2000) for a strategy in which a central bank following a Taylor rule makes up for shortfalls in policy accommodation during ELB episodes by subsequently keeping the policy rate lower than otherwise. The box "Complexities of Monetary Policy Rules" in the Board's July 2018 Monetary Policy Report contains an application of such a modified rule; see Board of Governors (2018b, pp. 37–41).
20. See English, López-Salido, and Tetlow (2015) for applications of flexible price-level targeting and nominal income-targeting strategies to a quantitative model of the U.S. economy.
21. As an illustration of the shortfall in policy support created by a binding ELB during the Global Financial Crisis, the simple policy rules considered in a January 2017 speech by then-Chair Janet Yellen prescribed setting the federal funds rate between negative 1-1/2 and negative 9 percent; see Yellen (2017). In addition to using these two additional monetary policy tools, the Federal Reserve implemented a number of other measures to stabilize the financial system, increase household and business confidence, and more generally support the economic recovery. These supplementary measures included the setting up of several credit facilities and the introduction of stress tests for systemically important financial institutions.
22. Starting in 1979, the Federal Reserve published a summary of individual economic projections from various Board members, FOMC members, or FOMC participants in the semiannual Monetary Policy Report. With the introduction of the Summary of Economic Projections (SEP) in 2007, the FOMC increased the frequency of the releases of policymaker projections, expanded the set of economic variables included, and extended the forecast horizon. Because the SEP includes individual contributions of projections and assessments from all FOMC participants, it captures a broader range of views than those of FOMC members. For a discussion and data, see Bernanke (2007) and Romer (2010).
23. Information about the review and the events associated with it are available on the Board's website at https://www.federalreserve.gov/monetarypolicy/review-of-monetary-policy-strategy-tools-and-communications.htm.
24. See Board of Governors (2019b).
FULL DOCUMENT: https://www.federalreserve.gov/newsevents/speech/files/clarida20190926a.pdf
ENERGY
U.S. Department of State. 09/26/2019. U.S. Convenes a Multilateral Meeting on Energy Resource Governance Initiative (ERGI)
U.S. Secretary of State Michael R. Pompeo convened a multilateral meeting on the U.S. Department of State-led Energy Resource Governance Initiative (ERGI) on September 26 during the high-level week at the United Nations General Assembly.
Growth in mineral intensive clean energy and electric vehicle (EV) technologies is creating unprecedented demand for raw materials and products. By the year 2030, 130 million EVs are projected to be on the road – up from five million today, according to the International Energy Agency. In turn, global demand on energy resource minerals will increase ten-fold over the same period. This presents complex challenges for some countries that are rich in energy resources but that face challenges with governance.
ERGI promotes sound governance and resilient supply chains in the energy minerals sector. Through this initiative, the U.S. Department of State’s Bureau of Energy Resources (ENR) engages countries to advance governance principles, share best practices, and encourage a level playing field. The ERGI founding partners—Australia, Botswana, Chile, Peru, and the United States—share long histories of responsible resource management. Together, the United States and the other founding partners are developing a best practices toolkit on governance and transparency, which will support nations’ responsible mineral development.
ENR’s Assistant Secretary Frank Fannon facilitated a conversation among the founding partners and other participant countries including: Argentina, Brazil, Democratic Republic of the Congo, Namibia, the Philippines, and Zambia. The participants discussed on shared challenges and opportunities for improving governance standards in extractive sectors to meet the anticipated demand for energy resource minerals.
President Trump released Executive Order 13817 on critical mineral management in December 2017. The Department of Commerce then released a government-wide action plan in June 2019, to reduce U.S. reliance on imported critical minerals. State Department’s ERGI complements the action plan by improving source country minerals governance and supporting resilient supply chains. ERGI provides a clear roadmap for better sourcing energy resource minerals globally by improving source country minerals governance and supporting resilient supply chains.
ERGI also advances key Administration priorities like Asia EDGE (Enhancing Development and Growth through Energy) and America Crece:Growth in the Americas, which seeks to catalyze private sector investment in infrastructure in Latin America and the Caribbean.
U.S. Department of State. 09/26/2019. Secretary Michael R. Pompeo At the Department of State’s Energy Resources Governance Initiative Event
SECRETARY POMPEO: Thank you, and thank you all for joining us this morning. I want to begin by welcoming Australia, Botswana, and Peru, founding partners of the Energy Resource Governance Initiative, along with the United States, Canada, and Chile. This initiative is yet more proof of how the Trump administration is tackling global challenges by building out partnerships with like-minded nations that focus on results that are real and tangible and which can make a difference.
We’re proud to bring this group together. The work that we’re doing here is absolutely essential – it’s essential to ensuring secure and reliable energy supplies for every nation.
Here’s why: As the global middle class expands, demand is increasing for mineral-intensive technologies. Wind and solar require six times the amount of copper as coal-generated power. A typical electric vehicle will need around four times more copper than a conventional gas-powered car.
So the question is, from where and how will we get the minerals that we need? Most are sourced from a small number of countries vulnerable to political instability, governance challenges, and malign influence from foreign actors.
We want to ensure that these important mineral commodities remain free from international coercion and control. We’d like to work with you to promote good mining sector governance and ensure that supply chains remain open and able to responsibly meet demand all around the world and for decades to come.
So today we’re all here. We’ve assembled to discuss how we can do that by opening markets, leveling the playing field for competition, and sharing our knowledge, our best practices to support our allies and friends.
At the same time, we must also pursue new sources of these critical minerals. The Trump administration is doing exactly that, inside our own borders.
We’re also working bilaterally to strengthen supply chains. For example, President Trump and Prime Minister Trudeau recently agreed to a framework of cooperation on critical minerals. Australia, too, has committed to supporting potential joint ventures in the United States to improve rare earth processing capacity.
The U.S. also signed an MOU to assist Greenland to explore and responsibly develop their energy resources.
By forming this initiative, the United States and our partner nations have taken a significant step toward a secure and prosperous energy future.
I look forward to discussing the important work that lies ahead, and I hope other nations will join us in this effort. And again, thank you all for you being here. Thank you.
VENEZUELA
U.S. Department of State. 09/25/2019. The United States Increases its Contribution in Response to the Venezuelan Regional Crisis
On September 25, Secretary Pompeo announced in New York nearly $119 million in additional humanitarian assistance to further demonstrate the United States’ commitment and solidarity with the Venezuelan people and the region in response to the Maduro-made Venezuela crisis. This amount includes nearly $36 million for life-saving aid inside Venezuela.
These funds will increase much needed assistance, not only in Venezuela, but in 16 countries across the region that continue to generously host the more than four million people forced to flee the former Maduro regime. U.S. assistance will consist of providing urgently needed medical and health support, water, food, and nutrition inside Venezuela, as well as providing food, shelter, water, medical assistance, mental health counseling, and legal assistance to Venezuelans forced to flee their country. This brings the United States’ total commitment to $568 million since FY 2017, including over $472 million in life-saving humanitarian aid inside Venezuela and for Venezuelans in the region, over $95 million in economic and development assistance, as well as the previous $20 million in humanitarian aid inside Venezuela pledged in January 2019.
The United States supports interim President Juan Guaido and the Venezuelan National Assembly as they work together with the international community and the Venezuelan people to the ensure adherence to rule of law and justice, stabilize the economy and reestablish basic services including water, electricity, and education, so that the people of Venezuela can return to their rightful place in the community of democracies. By restoring democracy in Venezuela the region will regain its stability and start to rebuild Venezuela’s devastated society.
The United States will continue to support the people of Venezuela during this humanitarian, political, and economic crisis, and we ask other nations to do the same.
________________
ORGANISMOS
DIGITAL CURRENCY
IMF. SEPTEMBER 26, 2019. From Stablecoins to Central Bank Digital Currencies
By Tobias Adrian and Tommaso Mancini-Griffoli
As privately issued stablecoins continue to encroach on more traditional forms of money—like cash and bank deposits—policymakers will not simply look on from the sidelines. They will arbitrate. Their rules and actions will determine how we will eventually pay for everyday items like a cup of coffee, and, more importantly, will affect the structure and risks of our financial sector.
Our last blog introduced stablecoins—cryptographic tokens that can be easily exchanged, benefitting from minimal price volatility relative to cash. Consumers might quickly adopt these new, cheaper, faster, and more user-friendly services integrated into their social media platforms. However, these also come with notable risks that require prompt regulatory action.
The world of fiat money is in flux, and innovation will transform the landscape of banking and money.
One possible regulatory path forward is to give stablecoin providers access to central bank reserves. This also offers a blueprint for how central banks could partner with the private sector to offer the digital cash of tomorrow—called synthetic central bank digital currency (sCBDC)—as discussed in the IMF’s first Fintech Note .
The regulatory imperative
Whether stablecoins are indeed stable is questionable. Stablecoin providers must privately generate trust in their liabilities—the very coins they issue. Many do so by backing coins one-for-one with assets of the same denomination. So if a stablecoin owner wanted to redeem her 10 euro coin for a 10 euro note, the stablecoin provider could sell the assets for cash to be pay out on the spot.
Or could it? Much depends on the safety and liquidity of the underlying assets, and on whether they fully back the coins in circulation. It also depends on whether assets are protected from other creditors if the stablecoin provider goes bankrupt.
Will the stablecoin owner get her money back any time she wants? Even if her peers attempt to sell their coins all at once, in a panic?
Regulation must eliminate these risks. One option is to require that stablecoin providers hold safe and liquid assets, as well as sufficient equity to protect coin-holders from losses. In essence, the call would be to regulate stablecoin providers despite them not being traditional banks; not an easy task we have found out.
Central bank backing
Another approach is to require stablecoin providers to fully back coins with central bank reserves—the safest and most liquid assets available.
The solution is not novel. The People’s Bank of China, for instance, requires giant payment providers AliPay and WeChat Pay to do so, and central banks around the world are considering giving fintech companies access to their reserves—though only after satisfying a number of requirements related to anti-money laundering, connectivity between different coin platforms, security, and data protection among others.
Clearly, doing so would enhance the attractiveness of stablecoins as a store of value. It would essentially transform stablecoin providers into narrow banks—institutions that do not lend, but only hold central bank reserves. Competition with commercial banks for customer deposits would grow stronger, raising questions about the social price tag.
But there are also clearer-cut advantages. Chief among these is stability, as backing is in perfectly safe and liquid assets. Another is regulatory clarity, as narrow banks would fit neatly into existing regulatory frameworks. Moreover, different stablecoins could be seamlessly exchanged thanks to the central bank settling all transactions. This would enhance competition among stablecoin providers. Additional benefits include support for domestic payment solutions in the face of foreign-currency stablecoins offered by monopolies that are hard to regulate; and better monetary policy transmission if pressure on currency substitution were alleviated, and interest rates were paid on reserves held by stablecoin providers—however distant the prospect.
Next step: a central bank digital currency?
If stablecoin providers held client assets at the central bank, clients would indirectly be able to hold, and transact in, central bank liabilities—the essence, after all, of a “central bank digital currency.” In practice, the coins would remain the liability of private issuers, and client assets would have to be protected against the bankruptcy of the stablecoin provider.
This synthetic central bank digital currency—or “sCBDC” for short—offers significant advantages over its full-fledged cousin, which requires getting involved in many of the steps of the payments chain. This can be costly—and risky—for central banks, as it would push them into unfamiliar territory of brand management, app development, technology selection, and customer interaction.
In the sCBDC model, which is a public-private partnership, central banks would focus on their core function: providing trust and efficiency. The private sector, as providers of stablecoins, would be left to satisfy the remaining steps under appropriate supervision and oversight, and to do what they do best: innovate and interact with customers.
Whether central banks jump on board at all is another matter. Each central bank would weigh the pros and cons related to payment system stability, financial inclusion, and cost efficiency as discussed in a recent IMF staff paper. To the extent that central banks wish to offer a digital alternative to cash, they should consider sCBDC as a potentially attractive option.
Will sCBDC turn out to be the central-bank money of the future? One thing is sure: the world of fiat money is in flux, and innovation will transform the landscape of banking and money. You can bet your bottom dollar on it.
FULL DOCUMENT: https://blogs.imf.org/2019/09/26/from-stablecoins-to-central-bank-digital-currencies/?utm_medium=email&utm_source=govdelivery
________________
ECONOMIA BRASILEIRA / BRAZIL ECONOMICS
INDÚSTRIA
FGV. IBRE. 26/09/19. Sondagens e Índices de Confiança. Sondagem da Indústria. Confiança da Indústria fica estável em setembro
O Índice de Confiança da Indústria (ICI) da Fundação Getulio Vargas ficou estável em setembro, na comparação com o mês anterior, em 95,6 pontos. Dessa forma, a média do terceiro trimestre se encerra 1,6 ponto abaixo da média do segundo trimestre, em 95,3 pontos.
“Apesar da melhora pontual na percepção sobre a demanda, a estabilidade da confiança em setembro indica que o setor continuou andando de lado no terceiro trimestre. Do mesmo modo, a queda dos indicadores que refletem as expectativas em relação à evolução da produção nos três meses seguintes e a evolução dos negócios nos seis meses seguintes, sugerem que uma recuperação mais consistente da indústria de transformação deve ficar para o próximo ano. A boa notícia fica a cargo do indicador de emprego previsto, que subiu novamente, apontando que menos empresas estão prevendo redução de pessoal ocupado”, comenta Renata de Mello Franco, economista da FGV/IBRE.
A confiança recuou em 10 dos 19 segmentos industriais pesquisados em agosto. O Índice de Situação Atual (ISA) cresceu 0,3 ponto, para 95,9 pontos. Já o Índice de Expectativas (IE) diminuiu 0,5 ponto, para 95,2 pontos. Em médias móveis trimestrais, o ISA apresentou, pela quinta vez consecutiva, queda de 0,2 ponto, para 95,3 pontos. Por sua vez, o IE apresentou alta de 0,1 ponto, para 95,4 pontos, interrompendo sequência de cinco quedas.
Neste mês, a melhora na percepção sobre a situação atual dos negócios foi a principal contribuição favorável ao resultado do ISA, que contou ainda com avaliações mais positivas sobre a demanda e negativas sobre o estoque. Apesar do aumento do percentual de empresas que consideram a situação atual dos negócios fraca, de 22,6% para 23,4%, a proporção de empresas que a consideram boa aumentou de 14,0% para 16,6%. Dessa forma, o indicador apresentou a segunda alta consecutiva, passando de 94,6 pontos em agosto para 95,3 pontos em setembro.
Em relação ao IE, houve piora das expectativas para os próximos meses, impulsionada principalmente pelo recuo de 1,5 pontos do indicador de produção prevista, que agora se encontra abaixo dos cem pontos (99,1 pontos). No mesmo sentido, o indicador que mede o otimismo dos empresários com a evolução do ambiente de negócios nos seis meses seguintes caiu novamente, para 94,3 pontos, o menor nível desde agosto de 2017 (93,9 pontos).
O Nível de Utilização da Capacidade Instalada (NUCI) caiu 0,3 ponto percentual (p.p.), voltando para 75,5%, o mesmo nível observado em julho. Em médias móveis trimestrais, o NUCI avançou pela sexta vez consecutiva, dessa vez em 0,2 p.p., para 75,6%.
DOCUMENTO: https://portalibre.fgv.br/navegacao-superior/noticias/confianca-da-industria-fica-estavel-em-setembro.htm
POUPANÇA
CNDL. SPC. 26/09/2019. Em cada dez brasileiros, sete não conseguiram poupar dinheiro em agosto, revela indicador CNDL/SPC Brasil
66% dos poupadores colocam dinheiro na velha caderneta de poupança, principalmente, pela facilidade de resgate. Somente 16% dos que poupam guardam pensando na aposentadoria e 42% tiveram de resgatar ao menos parte do dinheiro poupado
Com o desemprego ainda elevado e o poder de compra comprometido, o brasileiro não está conseguindo guardar dinheiro, seja para realizar um sonho de consumo, preparar-se para a aposentadoria ou simplesmente lidar com imprevistos. Dados apurados pela Confederação Nacional de Dirigentes Lojistas (CNDL) e pelo Serviço de Proteção ao Crédito (SPC Brasil) revelam que 67% dos consumidores brasileiros não conseguiram guardar nenhuma parte de seus rendimentos no último mês de agosto – o percentual é ainda maior considerando as pessoas das classes C, D e E (71%). Já entre as pessoas de renda mais alta (classes A e B), o percentual de não-poupadores é de 54%, um dado expressivo e que revela que o hábito de poupança não é frequente mesmo entre pessoas que recebem um salário maior.
Em agosto passado, apenas 22% dos entrevistados foram capazes de poupar ao menos parte do salário, sendo que cada poupador guardou em média, R$ 546,61. O baixo número de poupadores tem se mantido estável ao longo da série histórica, sendo que em agosto de 2018 girava em torno de 16%.
Entre os brasileiros que não pouparam nenhum centavo, 40% justificam possuir uma renda muito baixa, o que inviabiliza ter sobras no fim do mês. Outros 18% foram surpreendidos por algum imprevisto financeiro, 15% fizeram gastos extras atípicos com reformas, tratamentos médicos e compras, por exemplo e 13% reconhecem ter perdido o controle sobre os próprios gastos.
“A crise econômica tem seu papel no resultado da baixa poupança. Com desemprego presente em muitos lares, o orçamento familiar tornou-se mais apertado e, em alguns casos, insuficiente até para honrar compromissos já assumidos. No entanto, não se pode ignorar que muitos consumidores não dão a devida importância para a formação de uma reserva financeira. O consumidor deve ter em mente que um orçamento controlado pode fazer toda a diferença. O ideal não é poupar somente o que sobra no fim do mês, mas sempre reservar uma quantia fixa, encarando o valor destinado para a reserva como mais um compromisso mensal”, afirma a economista-chefe do SPC Brasil, Marcela Kawauti.
61% dos poupadores guardam dinheiro para lidar com imprevistos e 42% tiveram de sacar ao menos parte do dinheiro em agosto
O levantamento ainda mostra que a maior parte dos poupadores busca proteger-se contra imprevistos como doenças, morte de entes ou mesmo o desemprego (61%). Há também 42% que poupam pensando em garantir um futuro melhor para a família, 16% que poupam com o intuito de comprar a casa própria e 14% que citam a intenção de abrir um negócio. A reserva financeira com foco na aposentadoria foi citada apenas por 16% dos entrevistados.
Para o educador financeiro do SPC Brasil, José Vignoli, é preocupante que uma minoria dos poupadores tenha como objetivo guardar dinheiro para garantir uma aposentadoria tranquila. “A preparação individual para a aposentadoria ganha ainda mais força neste momento em que se discute a reforma da previdência. Um futuro tranquilo nas finanças depende de um esforço feito no presente. Muitos acham que não vale a pena, pois sobra pouco dinheiro. Porém, o hábito de poupar é mais importante do que o valor que se guarda mensalmente, já que com o passar do tempo, essa quantia vai aumentando gradativamente com o efeito dos juros da aplicação”, alerta o educador.
Entre os que poupam, 42% tiveram de sacar ao menos parte desses recursos em agosto, principalmente para pagar contas do dia a dia (32%), quitas dívidas (30%) e lidar com imprevistos (26%).
A velha poupança lidera ranking de investimentos do brasileiro; 33% citam facilidade de resgate e 21% acreditam não ter dinheiro suficiente para diversificar aplicações
O levantamento ainda revela que o principal destino do dinheiro poupado pelos brasileiros continua sendo a velha caderneta de poupança, citada por 66% dos entrevistados. Também chama a atenção o fato de que 21% deixam a quantia parada na conta corrente e 18% guardam dinheiro em casa. Outras modalidades mais sofisticadas como o tesouro direto e CDBs foram citados por 11% e 9%, respectivamente.
“A preferência majoritária pela poupança, que tem baixo rendimento, ou por guardar dinheiro na própria casa, por exemplo, demonstra que mesmo entre aqueles que guardam dinheiro, há falta de conhecimento e interesse em buscar aplicações mais rentáveis e adequadas para cada tipo de objetivo financeiro”, explica a economista Marcela Kawauti.
De acordo com a pesquisa, entre aqueles que optam pela poupança, guardar dinheiro em casa ou na conta corrente, 33% garantem que o fazem pela facilidade de sacar o dinheiro a qualquer momento. Já 21% alegam não ter dinheiro suficiente para investir em outras modalidades e 19% citam a questão do hábito no uso das opções mais tradicionais. Além desses, 16% têm medo de perder o valor aplicado e 11% alegam não ter conhecimento suficiente para investir.
“A carteira de investimentos do poupador brasileiro é bastante conservadora. Para compensar a perda de rentabilidade de modalidades atreladas à taxa Selic ou à taxa DI, que têm rendido pouco atualmente com os juros em patamar baixo, o poupador que quiser obter mais ganhos terá de diversificar suas aplicações. Isso depende de uma análise criteriosa que leva em conta o apetite ao risco do investidor e também do objetivo daquela aplicação”, afirma a economista Marcela Kawauti.
Metodologia
O indicador abrange 12 capitais das cinco regiões brasileiras: São Paulo; Rio de Janeiro; Belo Horizonte; Porto Alegre; Curitiba; Recife; Salvador; Fortaleza; Brasília; Goiânia; Manaus; e Belém. Juntas, essas cidades somam aproximadamente 80% da população residente nas capitais. A amostra, de 800 casos, foi composta por pessoas com idade superior ou igual a 18 anos, de ambos os sexos e de todas as classes sociais. A margem de erro é de 3,5 pontos percentuais a uma margem de confiança de 95%.
DOCUMENTO: http://site.cndl.org.br/em-cada-dez-brasileiros-sete-nao-conseguiram-poupar-dinheiro-em-agosto-revela-indicador-cndlspc-brasil/
EMPREGO
MEconomia. 25/09/2019. Caged. País tem saldo positivo no emprego formal em agosto, com 121.387 novos postos de trabalho. Foi o quinto mês consecutivo de resultado positivo no Caged e o melhor agosto desde 2013
Pelo quinto mês seguido, o Brasil teve saldo positivo no emprego formal. Em agosto, a expansão foi de 121.387 vagas, decorrente de 1.382.407 admissões e de 1.261.020 desligamentos. As informações são do Cadastro Geral de Empregados e Desempregados (Caged), divulgado nesta quarta-feira (25/9) pela Secretaria de Trabalho da Secretaria Especial de Previdência e Trabalho do Ministério da Economia. O resultado de agosto é equivalente à variação de 0,31% em relação ao estoque no mês anterior. Foi o melhor agosto no Caged desde 2013.
No acumulado de 2019, foram criados 593.467 novos postos, com variação de 1,55% do estoque. No mesmo período de 2018 houve crescimento de 568.551 empregos, uma variação de 1,50%. Nos últimos 12 meses foram criados 530.396 empregos, uma variação de 1,38%. No mesmo período do ano anterior, o saldo foi de 356.852, representando um crescimento de 0,94%.
Setores de atividade
Em agosto de 2019, foi registrado saldo positivo no nível de emprego em seis setores econômicos e saldo negativo em dois. Tiveram saldo positivo Serviços (61.730 postos), Comércio (23.626), Indústria de Transformação (19.517), Construção Civil (17.306), Administração Pública (1.391) e Extrativa Mineral (1.235). Apresentaram saldo negativo Agropecuária (-3.341 postos) e Serviços Industriais de Utilidade Pública/SIUP (-77 postos).
O setor de Serviços apresentou saldo positivo em todos os seus seis subsetores: Ensino (20.153 postos), Comercialização e Administração de Imóveis (17.366), Serviços Médicos, Odontológicos e Veterinários (9.110), Serviços de Alojamento, Alimentação e Reparação (8.187), Transportes e Comunicações (5.239) e Instituições de Crédito, Seguros e Capitalização (1.675).
O Comércio registrou saldo positivo em seus dois subsetores: Comércio Varejista, com a geração de 20.149 empregos, e Comércio Atacadista, com 3.477 novos postos de trabalho.
Segundo o Secretário de Trabalho do Ministério da Economia, Bruno Dalcolmo, "é importante enfatizar que se trata do melhor resultado para o mês de agosto desde 2013. Na condição de indicador antecedente, o Caged sinaliza a recuperação gradativa do emprego e do crescimento econômico, após um primeiro semestre repleto de desafios. Na nossa perspectiva, a Construção Civil é o melhor exemplo da consistência da retomada, com cinco meses consecutivos de saldos positivos de emprego".
Regiões e estados
Todas as cinco regiões apresentaram saldo de emprego positivo em agosto: Sudeste (51.382 postos, com variação positiva de 0,25%); Nordeste (34.697, 0,55%); Sul (13.267, 0,18%); Centro-Oeste (11.431, 0,35%) e Norte (10.610, 0,59%).
Das 27 Unidades Federativas, 25 tiveram saldo positivo. Os maiores saldos foram registrados em São Paulo (33.298 postos, 0,27% de variação positiva), Rio de Janeiro (11.810, 0,36%) e Pernambuco (10.431, 0,85%).
Salário
Para o conjunto do território nacional, o salário médio de admissão em agosto de 2019 foi de R$1.619,45 e o salário médio de desligamento, de R$1.769,59. Em termos reais (mediante deflacionamento pelo Índice Nacional de Preços ao Consumidor - INPC) houve aumento de 0,44% no salário de admissão e 0,09% no salário de desligamento em comparação ao mês anterior. Em relação ao mesmo mês do ano anterior foi registrado crescimento de 1,97% para o salário médio de admissão e de 1,02% para o salário de desligamento.
Desligamento mediante acordo entre empregador e empregado
Em agosto de 2019, ocorreram 18.420 desligamentos mediante acordo entre empregador e empregado (1,5% do total de desligamentos), envolvendo 13.351 estabelecimentos, em um universo de 12.105 empresas. Um total de 28 empregados realizou mais de um desligamento mediante acordo com o empregador.
Trabalho Intermitente
O mês registrou 12.929 admissões e 6.356 desligamentos na modalidade de trabalho intermitente, gerando saldo de 6.573 empregos, envolvendo 3.239 estabelecimentos e 2.830 empresas contratantes. Um total de 85 empregados celebrou mais de um contrato na condição de trabalhador intermitente.
Trabalho em Regime de Tempo Parcial
Foram registradas, em agosto, 7.804 admissões em regime de tempo parcial e 5.154 desligamentos, gerando saldo de 2.650 empregos, envolvendo 4.211 estabelecimentos e 3.583 empresas contratantes. Um total de 44 empregados celebrou mais de um contrato em regime de tempo parcial.
INFLAÇÃO
BACEN. 26 Setembro 2019. O Banco Central divulgou o Relatório Trimestral de Inflação do terceiro trimestre de 2019.
Sumário executivo
Indicadores recentes da atividade econômica
sugerem retomada do processo de recuperação
da economia brasileira. O cenário do Comitê de
Política Monetária (Copom) supõe que essa retomada
ocorrerá em ritmo gradual.
O Produto Interno Bruto (PIB) cresceu no segundo
trimestre de 2019 em relação ao trimestre anterior
(dados com ajuste sazonal), após dois trimestres
de relativa estabilidade. Sob a ótica da oferta, o
resultado do segundo trimestre refletiu avanços na
indústria e nos serviços, parcialmente compensados
por recuo na agropecuária. Do lado da demanda,
o consumo das famílias mostra a resiliência desse
componente, que registrou o décimo crescimento
consecutivo, enquanto a formação bruta de capital
fixo (FBCF) voltou a crescer, recuperando-se da queda
registrada nos últimos dois trimestres.
O resultado do PIB no segundo trimestre de 2019
contribuiu para elevação da projeção central de
crescimento no ano, de 0,8% para 0,9%. Para 2020,
ainda com elevado grau de incerteza, projeta-se
crescimento de 1,8%.
A economia segue operando com alto nível de
ociosidade dos fatores de produção, refletido
nos baixos índices de utilização da capacidade da
indústria e, principalmente, na taxa de desemprego.
No cenário externo, a provisão de estímulos
monetários adicionais nas principais economias, em
contexto de desaceleração econômica e de inflação
abaixo das metas, tem sido capaz de produzir
ambiente relativamente favorável para economias
emergentes. Entretanto, o cenário segue incerto e os
riscos associados a uma desaceleração mais intensa
da economia global permanecem.
Não obstante, a economia brasileira apresenta maior
capacidade de absorver eventual revés no cenário
internacional, devido ao seu balanço de pagamentos
robusto, à ancoragem das expectativas de inflação e à
perspectiva de continuidade das reformas estruturais
e de recuperação econômica.
As expectativas de inflação para 2019, 2020, 2021 e
2022 apuradas pela pesquisa Focus encontram-se em
torno de 3,5%, 3,8%, 3,75% e 3,5%, respectivamente.
O Copom avalia que diversas medidas de inflação
subjacente se encontram em níveis confortáveis,
inclusive os componentes mais sensíveis ao ciclo
econômico e à política monetária.
No que se refere às projeções condicionais de
inflação, no cenário com trajetórias para as taxas
de juros e câmbio extraídas da pesquisa Focus, as
projeções do Copom situam-se em torno de 3,3%
para 2019 e 3,6% para 2020. Esse cenário supõe
trajetória de taxa Selic que encerra 2019 em 5,00%
a.a. e permanece nesse patamar até o final de 2020.
Também supõe trajetória para a taxa de câmbio que
termina 2019 em R$3,90/US$ e permanece nesse
patamar até o final de 2020. No cenário com taxa Selic
constante a 6,00% a.a. e taxa de câmbio constante
a R$4,05/US$ , as projeções situam-se em torno de
3,4% para 2019 e 3,6% para 2020. No cenário híbrido
com trajetória de taxa Selic da pesquisa Focus e taxa
de câmbio constante, as projeções para a inflação
situam-se ao redor de 3,4% para 2019 e 3,8% para
2020.
As projeções apresentadas utilizam o conjunto de
informações disponíveis até a reunião do Copom
realizada em 17 e 18.9.2019 (225ª reunião). Para os
condicionantes utilizados nas projeções, em especial
os advindos da pesquisa Focus, realizada pelo Banco
Central do Brasil, a data de corte é 13.9.2019, a menos
de indicação contrária.
Em sua reunião mais recente (225ª reunião), o Copom
decidiu, por unanimidade, reduzir a taxa Selic para
5,50% a.a. O Comitê entende que essa decisão reflete
seu cenário básico e balanço de riscos para a inflação
prospectiva e é compatível com a convergência da
inflação para a meta no horizonte relevante para
a condução da política monetária, que inclui o anocalendário de 2020.
Na ocasião, o Comitê comunicou que seu cenário
básico para a inflação envolve fatores de risco
em ambas as direções. Por um lado, (i) o nível de
ociosidade elevado pode continuar produzindo
trajetória prospectiva abaixo do esperado. Por
outro lado, (ii) uma eventual frustração em relação
à continuidade das reformas e à perseverança
nos ajustes necessários na economia brasileira
pode afetar prêmios de risco e elevar a trajetória
da inflação no horizonte relevante para a política
monetária. O risco (ii) se intensifica no caso de (iii)
deterioração do cenário externo para economias
emergentes.
O Copom reitera que a conjuntura econômica
prescreve política monetária estimulativa, ou seja,
com taxas de juros abaixo da taxa estrutural.
O Copom avalia que o processo de reformas e ajustes
necessários na economia brasileira tem avançado, mas
enfatiza que perseverar nesse processo é essencial
para a queda da taxa de juros estrutural e para a
recuperação sustentável da economia. O Comitê
ressalta ainda que a percepção de continuidade da
agenda de reformas afeta as expectativas e projeções
macroeconômicas correntes. Em particular, o Comitê
julga que avanços concretos nessa agenda são
fundamentais para consolidação do cenário benigno
para a inflação prospectiva.
Na avaliação do Copom, a evolução do cenário básico
e do balanço de riscos prescreveu ajuste no grau
de estímulo monetário, com redução da taxa Selic
em 0,50 ponto percentual. O Comitê avalia que a
consolidação do cenário benigno para a inflação
prospectiva deverá permitir ajuste adicional no grau
de estímulo. O Copom reitera que a comunicação
dessa avaliação não restringe sua próxima decisão
e enfatiza que os próximos passos da política
monetária continuarão dependendo da evolução
da atividade econômica, do balanço de riscos e das
projeções e expectativas de inflação.
DOCUMENTO: https://www.bcb.gov.br/content/publicacoes/ri/201909/ri201909p.pdf
COMÉRCIO EXTERIOR BRASILEIRO
MEconomia. 25/09/2019. Brasil e Estados Unidos realizam sessão empresarial do Diálogo Comercial. Encontro acontece nesta quinta (26/9), em Brasília, e será oportunidade para o setor privado conhecer resultados da relação bilateral
Reunindo empresas e representantes dos governos federais do Brasil e dos Estados Unidos, a Secretaria Especial de Comércio Exterior e Assuntos Internacionais do Ministério da Economia e a Câmara Americana de Comércio no Brasil (Amcham Brasil), organizam, em Brasília, nesta quinta-feira (26/9), a sessão empresarial do Diálogo Comercial Brasil-Estados Unidos.
Durante a sessão, que será aberta à imprensa, representantes dos governos dos dois países vão apresentar, em primeira mão, os principais resultados alcançados no âmbito do mecanismo bilateral.
O encontro, que será realizado na sede da Amcham em Brasília, será também a oportunidade de empresários e executivos de empresas brasileiras e norte-americanas apresentarem suas expectativas em relação à agenda de comércio entre os dois países.
Participam do encontro o secretário de Comércio Exterior do Ministério da Economia, Lucas Ferraz; o diretor de Política na Administração de Comércio Internacional do Departamento de Comércio dos EUA, Joseph Laroski; e a CEO da Amcham Brasil, Deborah Vieitas. O vice-presidente Executivo da Amcham, Abrão Neto, mediará o debate com a participação empresarial.
A Sessão Empresarial do Diálogo Comercial Brasil-Estados Unidos é uma realização da Amcham com a Secretaria de Comércio Exterior e Assuntos Internacionais do Ministério da Economia, com apoio do Brazil – US Business Council.
Programação
14h – Credenciamento e welcome coffee
14h30 – Abertura Institucional: Deborah Vieitas, CEO, Amcham Brasil
14h05 – Perspectivas do Governo Brasileiro: Marcos Troyjo, Secretário Especial de Comércio Exterior e Assuntos Internacionais do Ministério da Economia (a confirmar)
14h15 – Perspectivas do Governo Americano:- Joseph Laroski, Director of Policy, International Trade Administration, U.S. Department of Commerce
14h25 – O Diálogo Comercial como instrumento da Relação Bilateral: Lucas Ferraz, Secretário de Comércio Exterior do Ministério da Economia
14h35 – Talk -Show / Interação com empresários: mediação: Abrão Neto, Vice-Presidente Executivo, Amcham Brasil
Sessão empresarial do Diálogo Comercial Brasil-Estados Unidos
Dia: 26 de setembro (quinta-feira)
Hora: de 14h às 16h
Local: Auditório S1 da Amcham, em Brasília-DF, no Edificio ION (SGAN 601, Lote H, Asa Norte)
ENERGIA
PETROBRAS. 26/09/2019. Petrobras aprova revisão de seu posicionamento estratégico
A Petrobras informa que seu Conselho de Administração aprovou, em reunião realizada ontem (25/09), a atualização da Visão, do Propósito e das Estratégias para o Novo Plano 2020-2024, que está em fase de elaboração.
A nova visão da Petrobras é ser a melhor empresa de energia na geração de valor para o acionista, com foco em óleo e gás e com segurança, respeito às pessoas e ao meio ambiente.
“Estamos construindo a nova Petrobras, uma empresa sustentável, competitiva, que atua com segurança e ética, gerando mais valor para seus acionistas e para a sociedade. Seremos uma companhia dedicada à exploração e produção de petróleo em águas profundas, menos endividada.
Esta nova Petrobras agrega, desde já, a transformação digital como uma poderosa alavanca para a realização de ganhos de produtividade e redução de custos”, destacou o presidente da Petrobras, Roberto Castello Branco.
Seguem abaixo a nova Visão e Propósito, assim como os Valores, que foram reafirmados:
Visão
A melhor empresa de energia na geração de valor para o acionista, com foco em óleo e gás e com segurança, respeito às pessoas e ao meio ambiente.
Propósito
Prover energia que assegure prosperidade de forma ética, segura e competitiva.
Valores
Respeito à vida, às pessoas e ao meio ambiente; ética e transparência; orientação ao mercado; superação e confiança; e resultados.
A estratégia da companhia foi ajustada, definindo suas ações por segmento de negócio, tendo em vista o foco no core business e a geração de valor para o acionista:
Exploração e Produção
- Maximizar o valor do portfólio, com foco em águas profundas e ultra profundas, buscando eficiência operacional, otimização do fator de recuperação e parcerias
- Crescer sustentado em ativos de óleo e gás de classe mundial, em águas profundas e ultra profundas
Gás e Energia
- Atuar de forma competitiva na comercialização do gás próprio
- Otimizar o portfólio termoelétrico focando no autoconsumo e na comercialização do gás próprio
- Sair integralmente da distribuição e do transporte de gás
Refino, Transporte e Comercialização
- Atuar de forma competitiva nas atividades de refino, logística e comercialização de derivados com foco nas operações do Sudeste
- Sair integralmente dos negócios de fertilizantes, distribuição de GLP e de biodiesel
- Atuar de forma competitiva na comercialização global de petróleo
Renováveis
- Desenvolver pesquisas visando a atuação, em longo prazo, em negócios de energia renovável com foco em eólica e solar no Brasil
- Viabilizar comercialmente o diesel renovável e o BioQav como resposta às políticas de sustentabilidade da matriz energética brasileira
Estratégias Transversais
- Transformar digitalmente a Petrobras entregando soluções para os desafios, empoderando nossos colaboradores, gerando valor, e aumentando a segurança das operações
- Desenvolver as competências críticas e uma cultura de alto desempenho para atender aos novos desafios da companhia, utilizando o valor econômico adicionado como ferramenta de gestão
- Perseguir constantemente uma estrutura de custos e de investimentos competitiva e eficiente, com alto padrão de segurança e respeito ao meio ambiente
- Fortalecer a credibilidade e a reputação da Petrobras
A Petrobras informa que o Novo Plano 20-24, que será integrado ao Plano Estratégico, com o detalhamento do planejamento operacional e financeiro para os próximos cinco anos, está em elaboração e será divulgado ao mercado assim que for aprovado pelos órgãos competentes da companhia.
________________
LGCJ.: