US ECONOMICS
PERSONAL INCOME
DoC. BEA. SEPTEMBER 27, 2019. Personal Income and Outlays, August 2019
Personal income increased $73.5 billion (0.4 percent) in August according to estimates released today by the Bureau of Economic Analysis. Disposable personal income (DPI) increased $77.7 billion (0.5 percent) and personal consumption expenditures (PCE) increased $20.1 billion (0.1 percent).
Real DPI increased 0.4 percent in August and Real PCE increased 0.1 percent. The PCE price index increased less than 0.1 percent. Excluding food and energy, the PCE price index increased 0.1 percent.
| 2019 | |||||
|---|---|---|---|---|---|
| Apr. | May | Jun. | Jul. | Aug. | |
| Percent change from preceding month | |||||
| Personal income: | |||||
| Current dollars | 0.4 | 0.4 | 0.4 | 0.1 | 0.4 |
| Disposable personal income: | |||||
| Current dollars | 0.4 | 0.3 | 0.4 | 0.3 | 0.5 |
| Chained (2012) dollars | 0.1 | 0.2 | 0.3 | 0.0 | 0.4 |
| Personal consumption expenditures (PCE): | |||||
| Current dollars | 0.7 | 0.4 | 0.3 | 0.5 | 0.1 |
| Chained (2012) dollars | 0.4 | 0.3 | 0.2 | 0.3 | 0.1 |
| Price indexes: | |||||
| PCE | 0.3 | 0.1 | 0.1 | 0.2 | 0.0 |
| PCE, excluding food and energy | 0.2 | 0.1 | 0.3 | 0.2 | 0.1 |
| Price indexes: | Percent change from month one year ago | ||||
| PCE | 1.5 | 1.4 | 1.4 | 1.4 | 1.4 |
| PCE, excluding food and energy | 1.6 | 1.5 | 1.6 | 1.7 | 1.8 |
The $73.5 billion increase in personal income in August primarily reflected increases in wages and salaries, nonfarm proprietors’ income, and personal current transfer receipts that were partially offset by a decrease in personal interest income (table 3).
The $13.9 billion increase in real PCE in August reflected an increase of $18.0 billion in spending for goods and a $1.6 billion decrease in spending for services (table 7). Within goods, recreational goods and vehicles was the leading contributor to the increase. Within services, the largest contributor to the decrease was spending for food services and accommodations. Detailed information on monthly real PCE spending can be found on Table 2.3.6U.
Personal outlays increased $22.3 billion in August (table 3). Personal saving was $1.35 trillion in August and the personal saving rate, personal saving as a percentage of disposable personal income, was 8.1 percent (table 1).
Updates to Personal Income and Outlays
Estimates have been updated for April through July. The percent change from the preceding month for current-dollar personal income, and for current-dollar and chained (2012) dollar DPI and PCE -- revised and as published in last month's release -- are shown below.
Estimates have been updated for April through July. The percent change from the preceding month for current-dollar personal income, and for current-dollar and chained (2012) dollar DPI and PCE -- revised and as published in last month's release -- are shown below.
| Change from preceding month | ||||||||
|---|---|---|---|---|---|---|---|---|
| June | July | |||||||
| Previous | Revised | Previous | Revised | Previous | Revised | Previous | Revised | |
| (Billions of dollars) | (Percent) | (Billions of dollars) | (Percent) | |||||
| Personal income: | ||||||||
| Current dollars | 83.8 | 81.6 | 0.5 | 0.4 | 23.9 | 23.6 | 0.1 | 0.1 |
| Disposable personal income: | ||||||||
| Current dollars | 69.7 | 67.6 | 0.4 | 0.4 | 44.4 | 42.0 | 0.3 | 0.3 |
| Chained (2012) dollars | 45.9 | 42.4 | 0.3 | 0.3 | 8.9 | 2.6 | 0.1 | 0.0 |
| Personal consumption expenditures: | ||||||||
| Current dollars | 50.3 | 48.9 | 0.3 | 0.3 | 93.1 | 72.7 | 0.6 | 0.5 |
| Chained (2012) dollars | 30.2 | 27.5 | 0.2 | 0.2 | 56.9 | 34.6 | 0.4 | 0.3 |
FULL DOCUMENT: https://www.bea.gov/system/files/2019-09/pi0819.pdf
DoC. US CENSUS. SEPTEMBER 26, 2019. Income and Poverty. U.S. Median Household Income Up in 2018 From 2017. New Data Show Income Increased in 14 States and 10 of the Largest Metros
By GLORIA GUZMAN
Median household income for the United States and 14 states increased significantly in 2018 from the previous year, according to U.S. Census Bureau data released today.
The 2018 American Community Survey (ACS) shows that median household income rose between 2017 and 2018 for 10 of the 25 most populous metropolitan areas.
Median household income for the nation has been increasing every year since 2013, but the year-to-year increase from 2017 is smaller than the prior three years.
However, the Gini index of income inequality was significantly higher during the same period for the nation and nine states.
The ACS provides detailed estimates of demographic, social, economic and housing characteristics for states, congressional districts, counties, places and other localities every year.
The estimates contained in a report released today are primarily based on the 2017 and 2018 ACS. All the dollar estimates in this story have been inflation-adjusted to 2018 dollars.

Real median household income in the United States increased 0.8% to $61,937 between 2017 and 2018.
Median household income for the nation has been increasing every year since 2013, but the year-to-year increase from 2017 is smaller than the prior three years. Previously, increases ranged between 1.8% and 3.3% annually.
This was the second consecutive year that U.S. median household income was higher than 2005, when the ACS was fully implemented.
Median household income in 2018 was higher than 2005 median household income for 31 states and the District of Columbia and lower in five states and Puerto Rico. In 14 states, differences were not statistically significant.
This was also the second consecutive year that U.S. median household income was higher than median household income in 2007, the year before the latest recession. It was also higher than before the recession in 20 states and the District of Columbia.
Median household income in 2018 was still lower than pre-recession median household income in nine states and Puerto Rico. In 21 states, differences were not statistically significant.
State Comparisons
Maryland ($83,242) was among the states with the highest median household income and West Virginia ($44,097) was among the lowest.


The median household income for the District of Columbia was $85,203 and for Maryland was $83,242, not statistically different from the median household income for the District of Columbia. The median household income for Puerto Rico was $20,296.
Income was lower than the U.S. median in 29 states and Puerto Rico and was higher in 18 states and the District of Columbia.
Between the 2017 ACS and the 2018 ACS, 14 states showed an increase in real median household income. Maine had a decrease of 3.3%.
25 Most Populous Metropolitan Areas
Median household income in 2018 ranged from $107,898 in the San Francisco-Oakland-Hayward, CA Metro Area to $54,912 in the Tampa-St. Petersburg-Clearwater, FL Metro Area.

Median household income increased in 10 of the most populous metropolitan areas between 2017 and 2018. None experienced a statistically significant decrease.
Race and Hispanic Origin
Median household income between 2017 and 2018 increased for all households across all major race and Hispanic origin groups.
Median household income ranged from $87,243 for Asian households (up 2.1%) to $41,511 for black households (up 1.5%).
Median household income for households with non-Hispanic white householders increased by 1.0% to $67,937 in 2018. Households with Hispanic householders increased by 1.5% to $51,404 in 2018.
The year-to-year percent changes between the groups were not significantly different from one another.

Age of Householder
Real median household income between 2017 and 2018 increased for households across most age groups.
It was highest for those ages 45 to 64 ($75,289) and those ages 25 to 44 ($68,817). It was lowest for those under age 25 ($33,389).
For those age 65 and older, the median income was $44,992, not statistically different from 2017.
Income Inequality
The Gini index for the United States from the 2018 ACS (0.485) was significantly higher than the 2017 ACS estimate (0.482).
The index increased in Alabama, Arkansas, California, Kansas, Nebraska, New Hampshire, New Mexico, Texas and Virginia.
The District of Columbia (0.524) and Puerto Rico (0.542) had the highest Gini indexes and Utah (0.427) was among the lowest.

Five states, the District of Columbia and Puerto Rico had Gini indexes higher than the index for the United States and 37 states with Gini indexes lower than the U.S. index.
The ACS is conducted every month, and income data is collected for the 12 months preceding the interview. Since the survey is continuous, adjacent ACS years have income reference months in common.
Comparing the 2017 ACS with the 2018 ACS is not an exact comparison of economic conditions in 2017 and 2018. For example, a respondent interviewed in June and asked about their income during the past 12 months would report income for five months in 2018 and seven months in 2017. A respondent interviewed in December would report income during 11 months of 2018 and one month of 2017.
Comparisons between 2017 and 2018 for Delaware and the Philadelphia-Camden-Wilmington, PA-NJ-DE-MD Metro Area are not made in this story.
Gloria Guzman is a survey statistician in the Income Statistics Branch of the Census Bureau’s Social, Economic and Housing Statistics Division.
FULL DOCUMENT: https://www.census.gov/library/stories/2019/09/us-median-household-income-up-in-2018-from-2017.html?utm_campaign=20190926msacos1ccstors&utm_medium=email&utm_source=govdelivery
ENERGY
U.S. Department of State. 09/26/2019. Senior State Department Official Previewing the Energy Resource Governance Initiative at the 74th Session of the United National General Assembly
MODERATOR: All right, guys. All of you know , right? Or do you not know ?
QUESTION: Yeah.
MODERATOR: Okay, good.
QUESTION: Hello.
SENIOR STATE DEPARTMENT OFFICIAL: Hi.
MODERATOR: I will let you – I’ll let you tell them who you are and what you do, and I think he has a few opening things and then we can go to questions.
SENIOR STATE DEPARTMENT OFFICIAL: Sure, great, thanks. So I’m . I lead that bureau. We really focus on energy issues as – where it’s really – these energy issues are a proxy for other foreign policy issues. We got a global perspective, have a variety of regional programs. We are very pleased that the Secretary today convened an event concerning what we call the Energy Resource Governance Initiative.
What we see is the world is growing, increased – that’ll require increased energy, 50 percent greater demand for energy in 2040 than we have today. Most of this new energy is going to be met by cleaner forms of electricity generation, renewables, and battery storage technologies, electric vehicles. These forms of energy are more minerals-intensive than other traditional fossil-based systems. Electric vehicles have multiple – four to six times more copper than an internal combustion engine, for example.
So you see this incredible demand for resources globally. You also see some countries that may be really – have considerable resource abundance may have serious governance challenges, capacity challenges. What we’re doing, what the Secretary spoke of through ERGI, is to bring countries that have a long-term history of responsible resource management and development together to – so these countries are Australia, Botswana, Peru, and the United States – to bring these countries together to develop really a toolkit, a roadmap on how our countries were able to advance responsible resource development, have that shared value approach to benefit the societies.
But this is – again, it’s a four-continent-wide – as the Australian foreign minister spoke, this is a multilateral approach stretching four continents, so it’s a diverse group of countries. What are the lessons we have to share? And then we also saw a variety of other countries who aspire to the same level of responsible resourcing of minerals. What we could do is develop this toolkit and also provide various degrees of capacity building, technical financing, et cetera to help create the above-ground conditions that will incent responsible best-class mining companies to go into their countries.
We’re very pleased – all of the countries that were present today have a long history – have resources that they want to develop, save for one. We’re very – we’re delighted that the Holy See came and spoke about these issues, recognizing that they have no resources to speak of, but they’ve been a champion in terms of governance issues for a very long time, and this is an initiative that they are committed to supporting.
So why don’t I pause there, there’s a lot to go through, and I’m looking forward to your questions.
MODERATOR: Okay. Anybody have one?
QUESTION: Not on this, but I wanted to – not on the event this morning, but on – what’s the latest on the Nord Stream 2 and your efforts to destroy it?
SENIOR STATE DEPARTMENT OFFICIAL: Well, we’ve – our position obviously is speaking to – we believe energy security is focused on diversification, to not be dependent and rely on any one source or type or energy, which is also, in the context of ERGI, why we have this diverse perspective and we look at responsible supply chains and minerals.
In the context of Nord Stream 2, I think it’s – we continue to evaluate developments and we look – watch with interest how Congress has really taken that issue on and considerable enthusiasm on a bipartisan basis. So we continue to track the developments. But in terms of any actions, I have nothing further to report.
QUESTION: Okay.
MODERATOR: Go ahead, Nick.
QUESTION: Can I ask you about —
SENIOR STATE DEPARTMENT OFFICIAL: Please.
QUESTION: — China’s import – continuing to import Iranian oil? Do you have a sense for how much they’re importing, and can you just talk a little bit about whether that is not particularly helpful in maintaining the maximum pressure campaign?
SENIOR STATE DEPARTMENT OFFICIAL: I think our maximum pressure – our campaign is continuing. It’s robust. We have discussions with all parties who would seek to import oil from nefarious actors, Iranian or others. We continue those discussions and our maximum pressure campaign is moving forward and robust and is quite effective.
QUESTION: Do you have a sense for how much China’s importing?
SENIOR STATE DEPARTMENT OFFICIAL: I don’t have numbers off the top of my head. Really, I was all geared up for ERGI. I can tell you how much overburden is created to generate a 200 megawatt wind farm if you’d like to talk about that.
MODERATOR: Go ahead.
QUESTION: (Inaudible) Japanese media.
SENIOR STATE DEPARTMENT OFFICIAL: Yes, hi.
QUESTION: Hi. The ASEAN countries depend on Middle East for oil import. But recent events in the Middle East highlighted that the ASEAN should diversify sources from Middle East. So my question is: How U.S. is going to work together with U.S. – ASEAN countries to diversify sources from the Middle East?
SENIOR STATE DEPARTMENT OFFICIAL: Yeah, I mean, I think that the strike on the Kingdom of Saudi Arabia – I guess that was a week ago – really was – of course it was an attack on Saudi Arabia. But it was really an attack on global energy consumers and especially those in the Indo-Pacific region, where some – more than 70 percent of Saudi production flows to those countries. So I think we certainly understand that criticality of diversification, as I said in my opening.
We have a variety of programs to help countries in the Indo-Pacific – diversification. But it’s really – our program under – our program called Asia EDGE. So I lead a program – a whole of government initiative focused on enhancing development and growth through energy in Asia. And we work on a partnership-based model, so countries will have various degrees of ambition on their own energy path, their own energy future. We work together with them to identify where do they want to go, under what timeframe, and then what do we need to do.
So a good example: The Philippines. We have a program there where they want to – they need energy, they want gas, but you just don’t flip the switch and develop – have the LNG tanker show up. You have to create a regulatory structure on how to do that. So we have technical experts that go and help them do that. You’re going to have to incorporate it into your grid matrix, so we bring them there as well. And then, of course, all the while we make sure that the private sector are aware of these opportunities.
Within the ASEAN context in particular, we are – have an advisory role on the ASEAN committee on – it’s ASCOPE, I’m trying to – the acronym escapes me. I think it’s the Committee on Petroleum or something. It’s basically all of the ASEAN national oil companies. We recently brought all of the ASCOPE members to Washington so that they have a better understanding of how we go about energy regulation in the United States and then took them all to Houston to meet with the private sector, to meet with regulators, to create this greater awareness on what is best practice, how to incorporate different types of energy. So it’s part of a learning, it’s capacity-building, and it’s leveraging our private sector to share those opportunities.
QUESTION: Thank you.
SENIOR STATE DEPARTMENT OFFICIAL: You’re welcome.
MODERATOR: All right.
QUESTION: Hi. Can I ask you about the potential fallout on the shipping industry as a result of these sanctions on, like, these Chinese entities, and in some cases, like, these companies? For example, the mother company of Costco is not – I understand is not sanctioned, but we hear that there are various mining companies already reviewing their charters with Costco. I mean, would you be worried about the potential fallout of this in the shipping market? Do you have any measures to sort of – in place to counter that impact if it gets much worse? Is that something that you’re considering, you’re sort of putting all of these sanctions, but they would have a ripple effect?
SENIOR STATE DEPARTMENT OFFICIAL: Well, I haven’t seen the reports about potential harm, ripple effects in that industry, but we constantly gauge unintended consequences. And we’ve certainly done that in the oil market context. We have clear awareness. And I think that our record has been quite successful in advancing our maximum pressure campaign without any harm. However, there was a lot of alarm at the outset that there would be – of the potential ramifications, and I think they just haven’t borne out to be that way. They’ve been quite successful. The economic impacts have been ameliorated, and I would suspect we would approach any sanctions with the same care.
MODERATOR: Anybody else? No? Okay. We have a few more of these this afternoon later in the day, so I will see you then.
QUESTION: Thank you.
SENIOR STATE DEPARTMENT OFFICIAL: Thank you, guys.
QUESTION: Thank you.
QUESTION: Thanks very much.
CUBA
U.S. Department of State. 09/26/2019. Public Designation of Raul Castro, Due to Involvement in Gross Violations of Human Rights
The Department is publicly designating Raul Modesto Castro Ruz, the First Secretary of the Central Committee of the Cuban Communist Party and First Secretary of the Cuban Revolutionary Armed Forces, under Section 7031(c) of the FY 2019 Department of State, Foreign Operations, and Related Programs Appropriations Act, due to his involvement in gross violations of human rights. Section 7031(c) provides that, in cases where the Secretary of State has credible information that foreign government officials have been involved in significant corruption or a gross violation of human rights, those individuals and their immediate family members are ineligible for entry into the United States.
The law also requires the Secretary of State to publicly or privately designate such officials and their immediate family members. In addition to the public designation of Raul Castro, the Department is also publicly designating his children, Alejandro Castro Espin, Deborah Castro Espin, Mariela Castro Espin, and Nilsa Castro Espin.
As First Secretary of the Cuban Communist Party, Raul Castro oversees a system that arbitrarily detains thousands of Cubans and currently holds more than 100 political prisoners. As First Secretary of Cuba’s Armed Forces, Castro is responsible for Cuba’s actions to prop up the former Maduro regime in Venezuela through violence, intimidation, and repression. In concert with Maduro’s military and intelligence officers, members of the Cuban security forces have been involved in gross human rights violations and abuses in Venezuela, including torture. Castro is complicit in undermining Venezuela’s democracy and triggering the hemisphere’s largest humanitarian crisis, forcing 15 percent of the Venezuelan population to flee the country and precipitating a food shortage and health crisis of unprecedented scale in this region.
The United States strongly supports the rights of the Cuban and Venezuelan people. We will continue to pursue all diplomatic and economic tools to help the Venezuelan people achieve the transition they deserve.
MIGRATION
U.S. Department of State. 09/26/2019. Report to Congress on Proposed Refugee Admissions for FY 2020
Today, the Department of State, along with the Department of Homeland Security and Department of Health and Human Services, submitted the President’s annual Report to Congress on Proposed Refugee Admissions for Fiscal Year (FY) 2020. The official Presidential Determination on Refugee Admissions Numbers for FY 2020 will be issued following consultation with Congress.
The United States anticipates receiving more than 368,000 new refugees and asylum claims in FY 2020. Of them, 18,000 would be refugees we propose to resettle under the new refugee ceiling; we also anticipate processing more than 350,000 individuals in new asylum cases.
***
At the core of the Trump Administration’s foreign policy is a commitment to make decisions based on reality, not wishes, and to drive optimal outcomes based on concrete facts.
Given the dire situation of the 71 million people displaced around the world, the mission of American diplomacy is more important than ever. Diplomatic tools – for example, foreign assistance, economic and political engagement, and alliance-building ‒ are essential to resolve the crisis points that drive displacement in the first place. Attacking problems at the source makes it possible to help many more vulnerable people, and to do so much more rapidly, than could be done through resettlement or asylum in the United States.
That’s why the United States has worked hard to resolve conflicts in Syria and Afghanistan, strengthen economies and governance in Central American countries, and support the legitimate government in Venezuela against Maduro’s tyranny. The Trump Administration has also put a new, practical focus on assisting refugees where they are concentrated: in places like Bangladesh, Colombia, and Turkey. Most displaced people seek to return home as soon as they can. Their efforts to rebuild their communities after a safe and voluntary return helps lead to the recovery and stability of affected areas, which serves America’s foreign policy interests.
Additionally, the United States is the most compassionate and generous nation in history. Our country hosts hundreds of thousands of people who have temporary and permanent protection under special immigration categories such as victims of trafficking, humanitarian parole, temporary protected status, and special immigrant juvenile status. These programs, in addition to our refugee and asylum programs, help uphold America’s legacy of caring for the most vulnerable. It is misguided to see our refugee admissions program as the singular measure of America’s humanitarian-based immigration efforts.
The current burdens on the U.S. immigration system must be alleviated before it is again possible to resettle large number of refugees. Prioritizing the humanitarian protection cases of those already in our country is simply a matter of fairness and common sense. Indeed, it would be irresponsible for the United States to go abroad seeking large numbers of refugees to resettle when the humanitarian and security crisis along the southern border already imposes an extraordinary burden on the U.S. immigration system.
This is why the diplomatic agreements the United States has achieved with our neighbors in the Western Hemisphere to address issues of illegal immigration and border security – including the Asylum Cooperation Agreements with Guatemala, El Salvador, and Honduras – are so important. They will allow the United States to refocus resources on the current backlog of asylum cases that now involves more than one million individuals.
Our refugee ceiling must also take into account our national security and foreign policy interests. In recent years, law enforcement has apprehended alleged terrorists who passed through our refugee program, reinforcing the need to remain vigilant against evildoers who would exploit American generosity. Additionally, as a means of serving U.S. foreign policy interests, this year’s refugee admissions proposal has specific allocations for people persecuted on account of their religious beliefs, Iraqis whose assistance to the United States has put them in danger, and legitimate refugees from Northern Triangle countries.
Finally, President Trump is taking new steps to make sure that the refugees that the United States welcomes are set up to succeed. The President is issuing an Executive Order on Enhancing State and Local Involvement in Refugee Resettlement to ensure that newly-arrived refugees are placed in communities where state and local governments are best-positioned to receive them. The federal government’s close cooperation with state and local governments is necessary to support refugees’ successful integration into American society and our labor force.
This refugee admissions proposal reaffirms America’s enduring commitment to assist the world’s displaced people, while fulfilling our first duty to protect and serve the American people.
ECONOMY REGULATION
FED. September 27, 2019. Speech. Law and Macroeconomics: The Global Evolution of Macroprudential Regulation. Vice Chair for Supervision Randal K. Quarles. At the “Law and Macroeconomics,” a conference at Georgetown University Law Center, Washington, D.C.
Good morning. I would like to thank Georgetown University Law Center and the conference organizers, Anna Gelpern and Adam Levitin, for the opportunity to speak to you.
I was particularly delighted to be asked to speak at today's conference because the topic is law and macroeconomics, a field that my experience has persuaded me is of the first importance, but ill understood, and surprisingly understudied. Now, this may at first blush sound like a beloved former president, venturing into a grocery store—"Golly, can you believe these scanners!?"—because the field of law and economics was already sturdily established when I was in law school back in the Coolidge Administration, and is now well over half a century old. It has been the source of some of the most innovative and influential legal scholarship over the lifetimes of everyone here, and in many ways the insights of the law and economics movement have become the default framework that policy makers and practitioners alike use when we think about the law conceptually, and often even at the level of granular application.
Yet, while we have called this law and economics, it would be more precise to call it law and microeconomics. Both law and microeconomics are centrally concerned with incentives—how are they constructed, how do they operate, how do legal or economic actors respond to them—and the interplay between these different ways to think about incentives has been a natural and fruitful focus of investigation in a broad range of legal studies: tort law, property law, criminal law, contract law, corporate law.
But both law and economics are also centrally concerned with systems, the performance and relationships of broad aggregates of laws or economic activity. Not merely how do individual actors react to changes in incentives, but how do large-scale combinations of actors respond to changes in systems: how are legal or economic systems constructed, how do they operate, how do those systems constrain wide areas of human activity. The interplay between those two ways of thinking about systems would seem to be as natural and fruitful a focus of investigation as is law and microeconomics, but it is only just beginning to be thought of as a field in itself.
For a concrete example, think about the often observed fact that corporate profit margins have been increasing steadily over the last few decades. Law is likely to have been a significant element in this evolution, but not any individual law. Rather an entire system of laws—laws relating to corporate governance, corporate combinations, taxation, litigation, labor—have evolved over an extended period of time. And, under this theory, one outcome of this system—higher corporate profit margins—would likely give firms greater scope to increase wages without increasing prices, thus offering a potential explanation for the flattening of the Phillips curve, the traditional macroeconomic relationship between the unemployment rate and inflation. For a policymaker who accepted this theory, his comfort in maintaining a very low rate of unemployment could depend significantly on his understanding of that underlying legal system and his estimation of how its evolution would likely proceed in the future.
Thus, the formal union of law and macroeconomics should seek to examine the interplay between a legal system and macroeconomic outcomes, above and beyond the connections a particular law may have with its impact on human behavior. Scholars and policymakers have spent our time primarily thinking about the impact of single laws, but it is appropriate to focus more broadly, especially since we have in fact repeatedly sought over the past century to revamp our system of laws to improve macroeconomic outcomes.
Consider the roaring debate in the half-dozen years after the 1929 market crash that led to the establishment of the foundations of federal financial regulation in the United States. Laws creating the Federal Deposit Insurance Corporation and a federal deposit insurance and receivership framework, establishing the Securities and Exchange Commission, and greatly expanding the responsibilities and capabilities of the Federal Reserve System were very purposefully intended to help restore confidence in the U.S. financial system as a necessary condition to foster a recovery from the devastation of the Great Depression. In essence, we designed and implemented a new system of financial regulatory laws to alter macroeconomic outcomes, not only to affect individual behavior. The debate around those laws, in the 1930s, was not an academic one, because the pain and suffering of that era was evident—at the time Congress was debating the Banking Act of 1935, which established the modern framework for the federal bank regulation and supervision, the unemployment rate in the United States was still 20 percent.1
I will leave to others the question of whether every detail of the laws passed in this period was equally effective, in the short or long term, in promoting macroeconomic stability. But we should recognize that rules to promote financial stability and a healthy economy have deep roots in the American legal tradition.
The Post-Crisis International Consensus
Building upon that strong tradition, I would like to focus this morning's remarks on the role that law and macroeconomics has played since the financial crisis in promoting a more stable economy. I am, of course, referring to macroprudential financial regulation.
Let's rewind the tape. After many decades of remarkable financial stability in the United States since the 1930s, the focus of financial oversight had moved away from systemic risks. Prior to the financial crisis, the better part of our regulatory framework was microprudential in nature—individual laws geared toward mitigating the fallout from idiosyncratic shocks to firms. This framework was designed to protect investors and depositors, viewed negative shocks as not originating from the financial system, and did not take into account risks that might be shared by financial firms.2 This is not to say that regulators did not understand the consequences of an interconnected system and the potential of contagion. For instance, the U.S. government, under the able leadership of Treasury Secretary Nicholas Brady, recognized and responded to the financial stability risks of the Latin American debt crisis of the 1980s. The United States had interests in stabilizing allies in Latin America, but a central part of the motivation was to contain potential risks to the U.S. economy.
The events of 2008–09 redefined our mission by more explicitly connecting macroeconomic and financial stability, as in the 1930s. Congress and the executive branch embraced a sweeping response, designing a system of laws to reflect a recognition that the cumulative, interconnected behavior of financial institutions had implications for financial stability and that even the behavior of a single large and complex institution could have implications for financial stability. This new system was also adopted at the international level. Starting with the G20 summit in Washington, D.C., in November 2008, the global community established the runway for a structural change. The subsequent G20 summit in London led to the establishment of the Financial Stability Board (FSB), with a strengthened mandate as a successor to the Financial Stability Forum. Subsequently, including at the following summit in Pittsburgh, world leaders agreed that the supervision of individual financial institutions had to account for the financial system as a whole, and it was recognized that shocks could originate from within the system and could spread to institutions with common exposures. In other words, the supervisory framework had to be macroprudential—focusing on mitigating systemic risk and accounting for macroeconomic consequences.3 This reorientation was a defining part of the 2010 Dodd-Frank Act, and internationally, in the Basel III Accord.
Section 165 of the Dodd-Frank Act, in particular, requires the Board to implement heightened capital and liquidity standards, concentration limits, and stress testing—all to further the macroprudential purpose of preventing or mitigating risks to the financial stability of the United States. As I will discuss later, the Board has followed through with rules such as the G-SIB surcharge, the liquidity coverage ratio, and single-counterparty credit limits, just to name a few; and, importantly, we have used macroeconomic considerations in calibrating some of these rules.
An Evolving Regulatory Perspective
Now, let's fast forward to the present. Over a decade has passed since the migration began toward a renewed focus on macroprudential regulation. Our evolution did not stop with the Pittsburgh G20 summit in 2009. Indeed, global financial standard-setters have continued to adapt and learn as they implemented and updated regulations in line with the global consensus that was reflected in Basel III. I would like to highlight three important regulatory paradigm shifts that follow from this renewed focus on macroprudential regulation.
Taking Stock of the Entire Banking Sector
First, in line with the pivot away from microprudential regulation, we have a renewed focus not only on the health of individual financial firms but on the amount of capital in the entire banking sector. Note that the idea of improving the stability of the financial system by regulating individual bank capital has been around for decades. Global policymakers began construction of the modern risk-based, bank capital framework in the 1980s, when the aforementioned Latin American debt crisis increased concerns that the capital held by large international banks was deteriorating. Since then, regulators, such as the Board, have continued to have one eye focused on the capital held at individual firms. Now, over a decade after the crisis, exercises such as stress testing have caused us to have the other eye focused on and assessing the amount of capital in the entire banking system.
Considering Macroeconomic Outcomes in Calibrations and Impact Analyses
The second paradigm shift is that regulators have improved their methods of conducting quantitative analysis of regulations. Such analysis, including conventional –cost-benefit analysis, traditionally did not take macroeconomic variables like gross domestic product (GDP) growth or the unemployment rate. That is no longer the case. Since regulators are given the task of maintaining the stability of the system as a whole, they must concern themselves with externalities and spillover effects to the broader economy. At the Federal Reserve, several regulatory initiatives have exemplified this change in quantitative analysis.
At the height of the financial crisis, the Federal Reserve created the first stress test, the Supervisory Capital Assessment Program (SCAP), to estimate potential losses at those banks, if economic and financial conditions worsened. Building on SCAP, the Federal Reserve moved to the current stress testing assessment—the Comprehensive Capital Analysis and Review (CCAR)—to evaluate whether the largest firms have sufficient capital to absorb potential losses and continue to lend under stressful conditions. In the CCAR process, the Federal Reserve simulates macroeconomic scenarios like a recession in which GDP falls and the unemployment rate rises significantly. In the 2019 stress test cycle, for example, we tested banks against a hypothetical global recession in which the unemployment rate in the United States rose to 10 percent.4 The stressed banks were required to show that they could continue to meet minimum capital requirements in the face of those hypothetical macroeconomic shocks.
Aside from CCAR, the FSB compiles an annual list of global systemically important banks (G-SIBs), which are subject to stricter capital requirements in the form of a capital surcharge. These banks must meet this higher capital standard based on the judgement that their potential failure would have a larger, systemwide impact on the economy. The goal, therefore, is to reduce a G-SIB's probability of failure so that its expected impact on the economy would be the same as that of a non-G-SIB.
Similarly, to reduce the risks of interconnectedness and contagion, the United States and other jurisdictions have implemented rules that limit the exposure that one bank may have to a single counterparty.
Finally, research on optimal bank capital levels by staff at regulatory and supervisory bodies around the world have factored in macroeconomic costs and benefits. Specifically, these models assume that higher capital requirements would reduce the probability of a financial crisis occurring but would increase the cost of bank lending, thereby lowering GDP growth. Not surprisingly, these models have produced a wide range of capital estimates given the wide range of underlying assumptions.
Combating Pro-cyclicality
The third paradigm shift at the Fed is combatting pro-cyclicality. To be sure, none of the regulatory developments that I have discussed so far screams macroeconomics quite as loudly as a time-varying, discretionary regulatory regime the express goal of which is to fight pro-cyclicality. Cyclicality—in this case, fluctuations in the economy based on the business cycle—is a concept that is near and dear to every macroeconomist's heart. In fact, theoretical studies of economic cycles go back to the early 1800s, and the National Bureau of Economic Research's tracker of the U.S. business cycle dates economic contractions and expansions back to the 1850s. Quite impressive. There's also more than just a handful of volumes of articles and book chapters written on the business cycle and countercyclical fiscal policy.
In the context of macroprudential regulation, pro-cyclicality represents a problem because banks tend to build up excessive credit during an economic expansion. Limiting pro-cyclicality means limiting both the highs and lows of a credit cycle.
Along with many other jurisdictions, the United States adopted a countercyclical capital buffer (CCyB) to address the issue. The U.S. CCyB is a capital buffer that ranges from zero percent to 2.5 percent of covered institutions' risk-weighted assets. Domestic regulators have discretion to switch the CCyB on or off anywhere within that range in order to prevent or mitigate the overheating of credit markets under their jurisdiction. In setting the buffer, the Federal Reserve takes into account, among other things, leverage in the financial sector, leverage in the nonfinancial sector, maturity and liquidity transformation in the financial sector, and asset valuation pressures. Notably, the CCyB is not calibrated bank-by-bank and is not calibrated asset-class-by-asset-class. Rather, regulators set the buffer based on their perception of the aggregate domestic credit cycle, whether it's too hot, too cold, or just right. Under the Board's current policy, we would activate the CCyB based on "when systemic vulnerabilities are meaningfully above normal."
Based on this policy, the CCyB is currently set at zero percent in the United States but has been turned on in France, Hong Kong, Sweden, the United Kingdom, and Norway. It is worth noting that, in the United Kingdom, the CCyB is set equal to a positive level—1 percent—in normal times. As a result, their buffer can be adjusted upward or downward based on the perceived risks of the time-varying credit cycle. As I have recently said, I see real merit in exploring the U.K. approach as a tool to promote financial stability.
Conclusion
Let me conclude by offering a few thoughts on three research topics that fall squarely in the intersection of law and macroeconomics.
Central Bank Mandates
First, while international agreements such as Basel III demonstrate that the international regulatory community has agreed on the high-level systematic changes and developed similar perspectives following the crisis, national governments gave different regulatory powers—in both degree and scope—to their central banks in pursuit of the new post-crisis consensus.5 In the United States, Congress did not change the Federal Reserve's dual mandate but did provide new responsibilities to promote financial stability. There was no change to the European Central Bank's monetary policy mandate, but it received direct supervisory authority over some of the Eurozone's largest banks through the Single Supervisory Mechanism and also continues to monitor financial sector risks. The Bank of Japan does not control Japan's macroprudential toolkit but does play an active role in monitoring systemic risk. The Bank of England, on the other hand, was explicitly tasked with a new financial stability mandate, and it oversees macroprudential regulation.
In line with the debates over central bank independence and macroeconomic outcomes, legal scholars who engage in cutting-edge research on institutional design may have thoughts on which model leads to the best outcomes for financial stability.
Financial Stability Monitoring
Second, in addition to giving varying degrees of power to their central banks, national governments also created new bodies that promote financial stability, such as the FSB and the Financial Stability Oversight Council (FSOC), to monitor systemic risk and identify systemically important institutions and activities. For example, the main issues on the FSB agenda for this year were developments in financial technology, nonbank financial intermediation, and evaluation of too-big-to-fail reforms.6 In the same vein, the FSOC produces annual reports that highlight such threats and vulnerabilities, including news ones such as cybersecurity.7
Given today's audience, I very much look forward to hearing your thoughts on these issues, particularly suggestions on ways in which our legal framework can be used to mitigate these risks and the extent to which additional macroeconomic tools should be developed to monitor or address evolving risks.
Due Process
Third and finally, since I have spent a good part of this speech talking about issues that are near and dear to every economist, I feel like it is only fair for me to wrap up by discussing an issue of equal, if not greater, emotional import to lawyers: due process. Specifically, I'd like to close by talking about the due process considerations associated with the aforementioned macroprudential policies. There is nothing improper about mitigating negative externalities through regulation, and that is an important purpose of much post-crisis financial regulation. However, it is also well-accepted that due process requires the fair, evenhanded application of laws so that individuals are not at the mercy of the arbitrary exercise of government power.8 As I have alluded to throughout my remarks, we are currently placing a much greater regulatory burden on a select group of banks—the largest and most complex firms—because we believe their failures would bring down the entire financial system.
Some might argue that, during the financial crisis, we dispensed with due process considerations while conducting version 1.0 of the stress tests. This is why I have strongly pushed for the recent shift toward greater transparency around the structure of the stress tests and the models themselves. It affords greater due process to the affected participants.
In the same vein, I would welcome greater legal scholarship on the due process considerations associated with bank supervision as a process distinct from bank regulation. By bank supervision, I refer to the processes and activities identified with examining banks, including checking compliance with laws and regulations, assessing bank capital and liquidity levels, assigning supervisory ratings to banks, and taking formal and informal enforcement actions. While it is important for bank supervision to be up to the task of assessing the world's largest banks, especially in light of the financial stability risks that I have been describing today, an equally important task is making sure that supervisors are acting fairly. Although questions of fairness are routine in law and economics, there is ample room to explore these issues as they relate to bank supervision.
While transparency and fairness are pillars of due process, I appreciate that there are other approaches worth considering on this matter. With this growing field of law and macroeconomics, I hope to see and implement many interdisciplinary solutions on the path forward.
Notes
1. Arguably, the history of law and macroeconomics has even deeper roots. Prior to the Banking Act of 1935, Congress had passed the National Bank Act of 1863 in response to the financial crisis that emerged during the early days of the American Civil War. Its purpose was to create a national banking system and establish a national currency. The following year, Congress passed the National Bank Act of 1864, which established the Office of the Comptroller of the Currency and gave the federal government the authority to supervise commercial banks. Some might even characterize the First and Second Banks of the United States as early efforts at law and macroeconomics.
2. See Claudio Borio, Towards a Macroprudential Framework for Financial Supervision and Regulation? (PDF) Bank of International Settlements Working Papers No. 128 (Basel, Switzerland: BIS, February 2003).
3. See Busch and van Rijin (2018), supra.
4. Board of Governors of the Federal Reserve System, 2019 Supervisory Scenarios for Annual Stress Tests Required under the Dodd-Frank Act Stress Testing Rules and the Capital Plan Rule (PDF) (Washington: Board of Governors, February 2019).
5. See Ed Balls, James Howat, and Anna Stansbury, Central Bank Independence Revisited: After the Financial Crisis, What Should a Model Central Bank Look Like? (PDF) Harvard Kennedy School M-RCBG Associate Working Paper No. 87 (Cambridge, MA: Harvard Kennedy School, 2018).
6. Randal K. Quarles, "The Financial Stability Board in 2019" (speech at the Joint Conference of the European Central Bank and the Journal of Money, Credit, and Banking, Frankfurt, Germany, March 2019).
7. See U.S Department of the Treasury, Financial Stability Oversight Council Annual Report 2018 (Washington: U.S. Treasury, 2018).
8. See Paul Tucker, Unelected Power: The Quest for Legitimacy in Central Banking and the Regulatory State (Princeton, NJ: Princeton University Press, 2018).
________________
ECONOMIA BRASILEIRA / BRAZIL ECONOMICS
DESEMPREGO
IBGE. 27/09/2019. PNAD Contínua: taxa de desocupação é de 11,8% e taxa de subutilização é 24,3% no trimestre encerrado em agosto de 2019
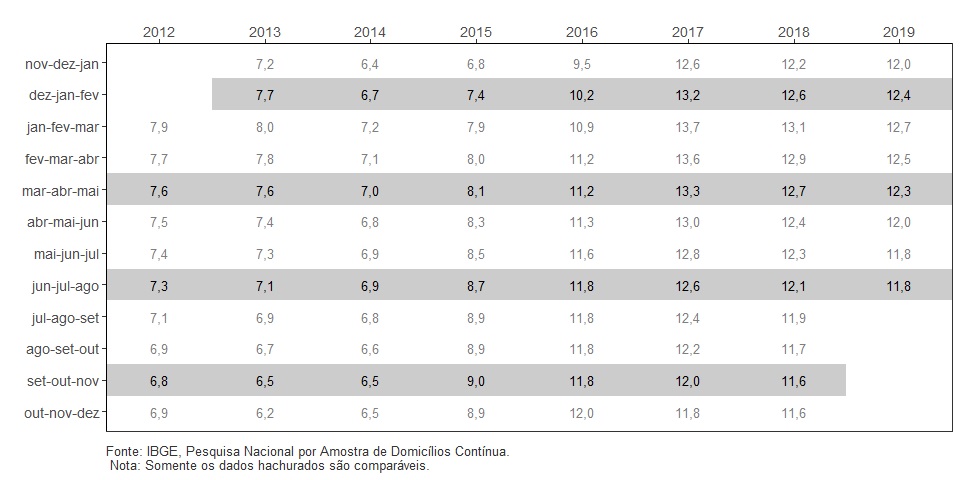
A taxa de desocupação (11,8%) no trimestre móvel encerrado em agosto de 2019, caiu 0,4 ponto percentual (p.p.) em relação ao trimestre de março a maio de 2019 (12,3%) e recuou 0,3 p.p. na comparação com o mesmo trimestre de 2018 (12,1%).
A população desocupada (12,6 milhões de pessoas) recuou (-3,2%, ou menos 419 mil pessoas) frente ao trimestre de março a maio de 2019 (13,0 milhões de pessoas) e ficou estatisticamente estável frente a igual trimestre de 2018 (12,7 milhões de pessoas).
A população ocupada (93,6 milhões) cresceu em ambas as comparações: 0,7%, (mais 684 mil pessoas) em relação ao trimestre anterior e 2,0% (mais 1.841 mil pessoas) em relação ao mesmo trimestre de 2018.
A população fora da força de trabalho (64,9 milhões de pessoas) permaneceu estável em ambas as comparações.
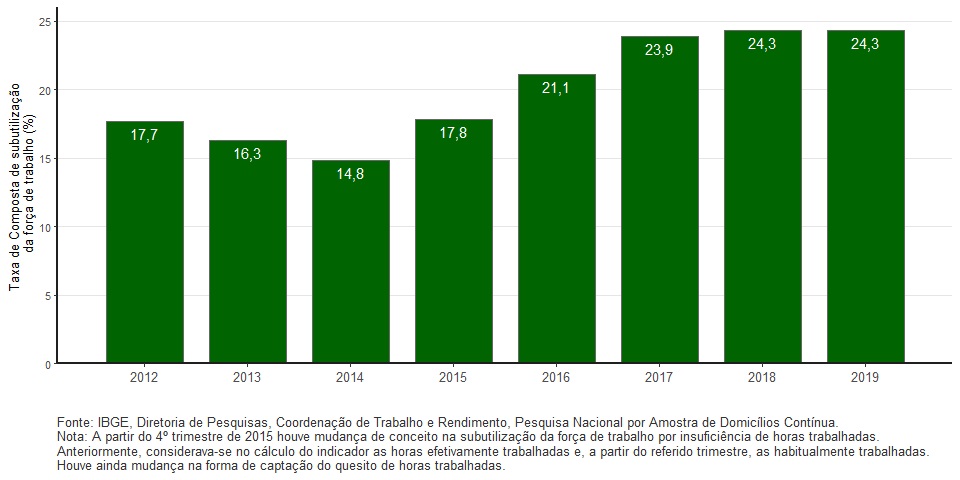
A taxa composta de subutilização da força de trabalho (24,3%) caiu 0,7 p.p. em relação ao trimestre móvel anterior (25,0%) e não variou em relação ao mesmo trimestre móvel de 2018 (24,3%).
A população subutilizada (27,8 milhões de pessoas) recuou (-2,7%, ou menos 769 mil pessoas), frente ao trimestre móvel anterior (28,5 milhões de pessoas) e ficou estatisticamente estável frente ao mesmo trimestre de 2018 (27,4 milhões de pessoas).
A população desalentada (4,7 milhões) recuou (-3,9%, ou menos 193 mil pessoas) em relação ao trimestre móvel anterior e ficou estável frente ao mesmo trimestre de 2018 (4,7 milhões).O percentual de desalentados em relação à população na força de trabalho ou desalentada (4,2%) caiu 0,2 p.p em relação ao trimestre anterior(4,4%) e ficou estatisticamente estável frente ao mesmo trimestre de 2018 (4,3%).
| Indicador / Período | Jun-jul-ago 2019 | Mar-abr-mai 2019 | Jun-jul-ago 2018 |
|---|---|---|---|
| Taxa de desocupação | 11,8% | 12,3% | 12,1% |
| Taxa de subutilização | 24,3% | 25,0% | 24,3% |
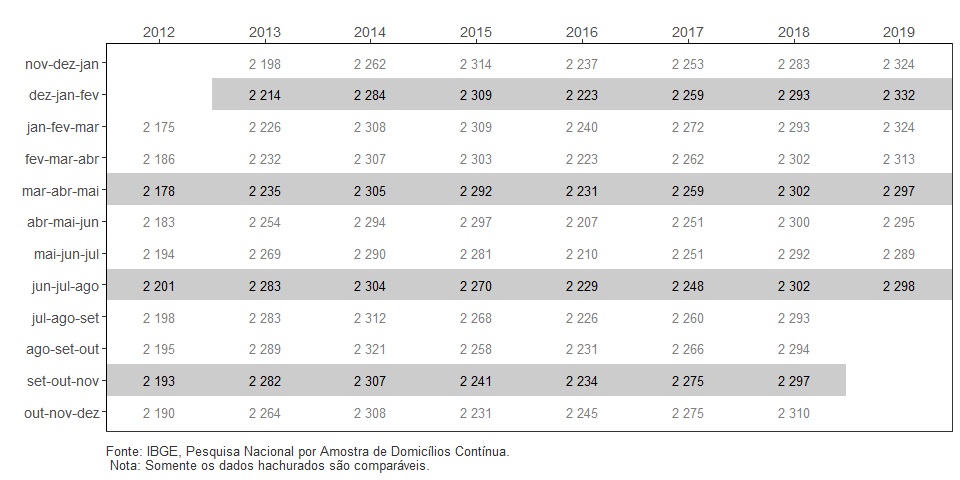
| Rendimento real habitual | R$2.298 | R$2.297 | R$2.302 |
| Variação do rendimento real habitual em relação a: | 0,1% (estabilidade) | -0,2% (estabilidade) | |
O número de empregados com carteira de trabalho assinada no setor privado (exclusive trabalhadores domésticos) chegou a 33,0 milhões, com estabilidade em ambas as comparações. A categoria dos empregados sem carteira de trabalho assinada no setor privado (11,8 milhões de pessoas) foi recorde da série histórica e cresceu nas duas comparações: 3,6% (ou mais 411 mil pessoas) em relação ao trimestre anterior e 5,9% (mais 661 mil pessoas) frente ao mesmo trimestre de 2018.
A categoria dos trabalhadores por conta própria chegou a 24,3 milhões de pessoas, novo recorde da série histórica. Houve estabilidade frente ao trimestre anterior e alta de 4,7% (mais 1,1 milhão de pessoas) em relação ao mesmo período de 2018.
O rendimento médio real habitual (R$ 2.298) no trimestre móvel terminado em agosto de 2019 ficou estável em ambas as comparações, assim como a massa de rendimento real habitual (R$ 209,9 bilhões) do mesmo período.
Taxa de Desocupação - Brasil - 2012/2019
O nível da ocupação (percentual de pessoas ocupadas na população em idade de trabalhar) foi estimado em 54,7%, crescendo e ambas as comparações: 0,2 p.p. frente ao trimestre móvel anterior (54,5%) e 0,6 p.p. em relação a igual trimestre de 2018 (54,1%).
A força de trabalho (pessoas ocupadas e desocupadas), estimada em 106,2 milhões de pessoas, ficou estável em relação ao trimestre móvel anterior e cresceu 1,7% (mais 1,7 milhão de pessoas) frente ao mesmo trimestre de 2018.
A força de trabalho potencial (8,0 milhões de pessoas) caiu 4,3% (menos 357 mil pessoas) em relação ao trimestre anterior e ficou estável frente a igual trimestre de 2018.
O contingente fora da força de trabalho, no trimestre de abril a junho de 2019 foi estimado em 64,9 milhões de pessoas e ficou estável em ambas as comparações.
Taxa Composta de subutilização - trimestres de abril a junho – 2012/2019 Brasil (%)
O número de subocupados por insuficiência de horas trabalhadas (7,2 milhões) ficou estavel em relação ao trimestre anterior e cresceu 8,5% (ou mais 568 mil pessoas subocupadas) em relação ao mesmo trimestre de 2018.
As categorias dos empregadores (4,3 milhões de pessoas) e dos trabalhadores domésticos (6,3 milhões de pessoas) ficaram estáveis em ambas as comparações.
O grupo dos empregados no setor público (inclusive servidores estatutários e militares), foi estimado em 11,7 milhões de pessoas também não teve variações estatisticamente significativa nas duas comparações.
Em relação ao trimestre móvel anterior, a ocupação cresceu em dois grupamentos de atividade: Indústria (2,3%, ou mais 272 mil pessoas) e Construção (2,8%, ou mais 181 mil pessoas). Os demais grupamentos não apresentaram variação significativa.
Na comparação com o mesmo trimestre móvel de 2018, houve aumento da ocupação em três grupamentos de atividade: Transporte, armazenagem e correio (4,9%, ou mais 226 mil pessoas), Informação, Comunicação e Atividades Financeiras, Imobiliárias, Profissionais e Administrativas (5,3%, ou mais 530 mil pessoas) e Outros serviços (5,5%, ou mais 261 mil pessoas). Os demais grupamentos não apresentaram variação significativa.
O rendimento médio real habitualmente recebido no trabalho principal de todos os grupamentos de atividade ficou estável em ambas as comparações.
Rendimento médio mensal real habitualmente recebido no mês de referência, de todos os trabalhos das pessoas ocupadas - Brasil - 2012/2019 - (R$)
Desemprego cai para 11,8% com informalidade atingindo maior nível da série histórica. Dos 684 mil novos ocupados, 87,1% estão no mercado de trabalho informal
A taxa de desocupação do país caiu novamente e ficou em 11,8% no trimestre encerrado em agosto, após ficar em 12,3% no trimestre finalizado em maio. Mesmo assim, o país ainda tem 12,6 milhões de pessoas em busca de trabalho. A queda no desemprego foi puxada pela entrada de 684 mil trabalhadores no mercado, totalizando 93,6 milhões de ocupados, o maior número desde 2012.
No entanto, esse aumento na quantidade de pessoas trabalhando foi acompanhado por recordes nos níveis de informalidade. De acordo com informações da Pesquisa Nacional por Amostra de Domicílios Contínua (PNAD Contínua), divulgada hoje pelo IBGE, 41,4% da população ocupada se encontra na informalidade, a maior proporção desde 2016, quando esse indicador passou a ser produzido. Dos 684 mil novos ocupados, 87,1% entraram no mercado de trabalho pela via informal.
Nesse grupo estão os trabalhadores sem carteira assinada (empregados do setor privado e domésticos), os sem CNPJ (empregadores e por conta própria) e os sem remuneração (auxiliam em trabalhos para a família).
Os empregados sem carteira assinada totalizaram 11,8 milhões de pessoas e os por conta própria somaram 24,3 milhões de trabalhadores no trimestre encerrado em agosto, os maiores contingentes da série histórica, iniciada em 2012.
A pesquisa mostrou também que apenas 62,4% da população ocupada contribuiu para a previdência oficial no trimestre encerrado em agosto. “Há um movimento de queda desde o início do ano”, disse a analista da PNAD Contínua, Adriana Beringuy.
Segundo o diretor adjunto de Pesquisa do IBGE, Cimar Azeredo, nesta época do ano a expectativa é de aumento expressivo da população ocupada, com impacto na massa de rendimento, que está estável em seu patamar mais alto, de R$ 209,9 bilhões. Já o rendimento médio ficou em R$ 2.298, também com estabilidade.
“Esse aumento na ocupação não foi suficiente para aumentar a massa de rendimento, porque o emprego gerado foi voltado para postos de trabalho na área informal. E é essa massa de rendimento que movimenta o mercado de trabalho de forma virtuosa”, explicou Cimar.
Entre os setores, a ocupação cresceu em relação ao trimestre anterior na indústria (2,3%, ou mais 272 mil pessoas) e na construção (2,8%, ou mais 181 mil pessoas). Na construção, foi o primeiro aumento significativo após sete trimestres, enquanto a indústria cresceu pelo segundo trimestre consecutivo, acumulando 545 mil novos postos de trabalho nesse período.
“No caso da construção, é um grupamento que sofreu muito com a crise. Essas obras paradas demitiram muitos trabalhadores de ‘chão de fábrica’. A gente precisa aguardar mais edições da pesquisa para entender se isso sinaliza uma recuperação”, avaliou Cimar.
Número de desalentados tem primeira queda em pouco mais de cinco anos
A taxa de subutilização caiu para 24,3%, puxada pelo aumento da ocupação e pela queda de 3,9% na população desalentada, que reúne 4,7 milhões que desistiram de procurar trabalho. É o primeiro recuo significativo de desalentados em pouco mais de cinco anos, desde o trimestre encerrado em fevereiro de 2014.
Já o número de subocupados por insuficiência de horas, aqueles que trabalham menos de 40 horas semanais e gostariam de trabalhar mais, está em 7,2 milhões de pessoas. Apesar de representar estabilidade em relação ao trimestre anterior, é o maior contingente desde 2012.
DOCUMENTO: https://agenciadenoticias.ibge.gov.br/agencia-sala-de-imprensa/2013-agencia-de-noticias/releases/25533-pnad-continua-taxa-de-desocupacao-e-de-11-8-e-taxa-de-subutilizacao-e-24-3-no-trimestre-encerrado-em-agosto-de-2019
INFLAÇÃO
FGV. IBRE. 27/09/19. Índices Gerais de Preços. IGP-M. IGP-M varia -0,01% em setembro
O Índice Geral de Preços – Mercado (IGP-M) variou -0,01% em setembro, percentual superior ao apurado em agosto, quando a taxa foi de -0,67%. Com este resultado, o IGP-M acumulada alta de 4,09% no ano e de 3,37% nos últimos 12 meses. Em setembro de 2018, o índice havia subido 1,52% no mês e acumulava alta de 10,04% em 12 meses.
O Índice de Preços ao Produtor Amplo (IPA) variou -0,09% em setembro, após queda de 1,14% em agosto. Na análise por estágios de processamento, a taxa do grupo Bens Finais variou -0,15% em setembro, contra -0,48% no mês anterior. A principal contribuição para este resultado partiu do subgrupo alimentos processados, cuja taxa passou de -0,28% para 0,41%, no mesmo período. O índice relativo a Bens Finais (ex), que exclui os subgrupos alimentos in natura e combustíveis para o consumo, subiu 0,31% em setembro, após cair 0,02% no mês anterior.
A taxa de variação do grupo Bens Intermediários passou de -0,72% em agosto para 0,22% em setembro. O principal responsável por este movimento foi o subgrupo materiais e componentes para a manufatura, cujo percentual passou de -0,80% para 0,29%. O índice de Bens Intermediários (ex), obtido após a exclusão do subgrupo combustíveis e lubrificantes para a produção, subiu 0,24% em setembro, contra queda de 0,56% em agosto.
O índice do grupo Matérias-Primas Brutas variou de -2,30% em agosto para -0,36% em setembro. Contribuíram para o avanço da taxa do grupo os seguintes itens: soja (em grão) (1,80% para 8,12%), minério de ferro (-7,47% para -6,86%) e milho (em grão) (-2,82% para 0,38%). Em sentido oposto, destacam-se os itens aves (3,23% para -3,04%), laranja (0,81% para -0,31%) e trigo (em grão) (1,33% para -0,01%).
O Índice de Preços ao Consumidor (IPC) registrou queda de 0,04% em setembro, após alta de 0,23% em agosto. Quatro das oito classes de despesa componentes do índice registraram recuo em suas taxas de variação. A principal contribuição partiu do grupo Alimentação (-0,04% para -0,80%). Nesta classe de despesa, vale citar o comportamento do item frutas, cuja taxa passou 2,94% para -4,22%.
Também apresentaram decréscimo em suas taxas de variação os grupos Habitação (0,87% para 0,36%), Saúde e Cuidados Pessoais (0,29% para 0,21%) e Vestuário (-0,01% para -0,05%). As principais influências para a desaceleração dos grupos partiram dos seguintes itens: tarifa de eletricidade residencial (4,11% para 1,28%), artigos de higiene e cuidado pessoal (0,16% para -0,27%) e acessórios do vestuário (1,04% para 0,09%).
Em contrapartida, os grupos Educação, Leitura e Recreação (-0,35% para 0,16%), Comunicação (0,25% para 0,53%) e Transportes (0,03% para 0,05%) apresentaram acréscimo em suas taxas de variação. Nestas classes de despesa, os maiores avanços foram observados para os seguintes itens: passagem aérea (-10,61% para 1,82%), tarifa de telefone móvel (0,00% para 1,15%) e etanol (1,25% para 1,61%).
O grupo Despesas Diversas repetiu a taxa de variação da última apuração que foi de 0,04%. Os destaques no sentido ascendente e descendente partiram, respectivamente, dos itens: alimentos para animais domésticos (-0,47% para 0,21%) e clínica veterinária (0,42% para -0,10%).
O Índice Nacional de Custo da Construção (INCC) subiu 0,60% em setembro, ante 0,34% no mês anterior. Os três grupos componentes do INCC registraram as seguintes variações na passagem de agosto para setembro: Materiais e Equipamentos (0,22% para 0,17%), Serviços (0,29% para 0,25%) e Mão de Obra (0,44% para 0,95%).
DOCUMENTO: https://portalibre.fgv.br/navegacao-superior/noticias/igp-m-varia-0-01-em-setembro.htm
CNI. 27/09/2019. Confiança do consumidor para de cair, diz pesquisa da CNI. INEC de setembro fica estável, mas mostra que aumentou a preocupação dos brasileiros com a inflação. Indicadores de endividamento e de situação financeira melhoraram em relação a junho
Depois de duas quedas consecutivas, o Índice Nacional de Expectativa do Consumidor (INEC) subiu para 47,3 pontos em setembro. Com o aumento de apenas 0,3 pontos em relação a junho, o indicador está 2 pontos acima do registrado em setembro do ano passado e é superior à média histórica, de 46,1 pontos.
As informações são da pesquisa divulgada nesta sexta-feira (27) de setembro, pela Confederação Nacional da Indústria (CNI). Os indicadores da pesquisa variam de zero a cem pontos. Quando estão abaixo dos 50 pontos mostram consumidores pouco confiantes.

“A maioria dos índices que compõem o INEC evoluiu positivamente entre junho e setembro de 2019”, diz o levantamento. O destaque foi o indicador de endividamento, que caiu de 51 pontos para 49,6 pontos, mostrando estabilidade do endividamento dos consumidores, depois do aumento registrado em junho. O indicador de situação financeira também melhorou e passou de 47,7 pontos em junho para 48,9 pontos em setembro.
A pesquisa mostra ainda que a inflação preocupa os brasileiros. O índice de expectativa de inflação subiu para 61,4 pontos neste mês. “É o terceiro aumento consecutivo do índice, o que revela preocupação crescente com a evolução dos preços”, avalia a CNI. O índice de expectativas de desemprego ficou em 56,4 pontos, estável na comparação com junho, mostrando que a população continua apreensiva com a evolução do desemprego.
CONSUMO E CRESCIMENTO - Além disso, o indicador de intenção de compras de maior valor, como móveis e eletrodomésticos, subiu de 51,7 pontos em junho para 52,2 pontos neste mês. Isso mostra que os brasileiros estão dispostos a aumentar o consumo nos próximos seis meses.
“O aumento do INEC pode não ter sido significativo em setembro, mas interrompe a sequência de duas quedas consecutivas. Além disso, é importante perceber que somente a maior preocupação com os preços limitou um aumento maior da confiança. Os demais índices que compõem o INEC, ou seja, os demais fatores relevantes para a decisão do consumo levantados na pesquisa, evoluíram de forma positiva entre junho e setembro”, afirma o economista da CNI Marcelo Azevedo.
O INEC antecipa tendências de consumo. Consumidores mais confiantes têm mais propensão a fazer compras. Com o aumento do consumo, as empresas são estimuladas a elevar a produção, fazer investimentos e criar empregos, o que é decisivo para o crescimento da economia.

REGIÕES - De acordo com a pesquisa, a confiança dos consumidores só piorou na região Sul, onde o INEC caiu pela terceira vez consecutiva e recuou de 49,3 pontos em junho para 47,8 pontos neste mês. Na região Norte/Centro-Oeste, o INEC aumentou de 47,7 pontos para 49,3 pontos. “Ou seja, os consumidores da região, que estavam sem confiança, agora estão próximos de mostrarem-se confiantes”, afirma a pesquisa. No Nordeste, o INEC ficou praticamente estável ao crescer 0,1 ponto, enquanto no Sudeste, aumentou 0,5 ponto.
Esta edição do INEC, feita em parceria com o Ibope Inteligência, ouviu 2 mil pessoas em 126 municípios entre os dias 19 e 22 deste mês.
INEC - Índice Nacional de Expectativa do Consumidor. Confiança do consumidor fica praticamente estável
O INEC passou de 47,0 pontos em junho de 2019 para 47,3 pontos em setembro. O crescimento de 0,3 ponto não representa mudança significativa da confiança do consumidor no período, mas interrompe sequência de duas quedas consecutivas. O índice continua acima da média histórica de 46,1 pontos e também é 2,0 pontos superior ao registrado em setembro de 2018.

DOCUMENTO: https://bucket-gw-cni-static-cms-si.s3.amazonaws.com/media/filer_public/a8/40/a84046da-1e99-49b8-bbee-c304d5d2ee03/inec_indicenacionaldeexpectativadoconsumidor_setembro2019.pdf
SERVIÇOS
FGV. IBRE. 27/09/19. Sondagens e Índices de Confiança. Sondagem de Serviços. Confiança de Serviços avança em setembro e encerra terceiro trimestre de forma positiva
O Índice de Confiança de Serviços (ICS), da Fundação Getulio Vargas, subiu 1,7 ponto em setembro, para 94,0 pontos, maior nível desde fevereiro de 2019 (96,5). O resultado mantém a tendência positiva também em médias móveis trimestrais, com alta de 0,9 ponto.
“A confiança de serviços volta a avançar em setembro, encerrando o terceiro trimestre de forma positiva. A alta no mês foi resultado da continuidade de uma percepção positiva do volume de serviços no momento presente e também do otimismo com os próximos meses. Esse resultado sugere que a recuperação gradual do setor deve se manter nos próximos meses, apesar do patamar ainda baixo. ”, analisa Rodolpho Tobler, economista da FGV IBRE.
A alta do ICS impactou 11 das 13 principais atividades pesquisadas, e foi determinada tanto pela melhora das expectativas quanto pelas avaliações sobre o momento atual. O Índice de Expectativas (IE-S) avançou 2,9 pontos, para 98,2 pontos, e o Índice de Situação Atual (ISA-S) variou 0,5 ponto, passando a 89,9 pontos.
Os dois quesitos do IE-S, indicador de tendência dos negócios nos próximos seis meses e indicador de demanda prevista nos próximos três meses, tiveram variações idênticas de 2,8 pontos.
Por sua vez, os quesitos do ISA-S, indicador de volume de demanda atual e indicador de situação atual dos negócios, variaram 0,4 e 0,6 ponto.
O Nível de Utilização da Capacidade Instalada (NUCI) do setor de serviços voltou a cair, desta vez a queda foi 1,1 ponto percentual para 80,7 pontos, o menor nível desde agosto de 2018 (80,6).
ICS acumulado no terceiro trimestre foi positivo
O resultado do ICS no terceiro trimestre foi positivo nos principais segmentos, com destaque nos segmentos Famílias e Transportes, quem avançaram 5,4 e 4,4 pontos no período. Apesar disso, o balanço dos nove primeiros meses do ano é de queda de 0,6 ponto no agregado do setor. A percepção sobre o momento atual vem melhorando nos últimos quatro meses, mas ainda se encontra no patamar baixo. O resultado de setembro sugere que a recuperação gradual da confiança do empresário do setor deve continuar nos próximos meses, condicionada à melhora do ambiente econômico.
DOCUMENTO: https://portalibre.fgv.br/navegacao-superior/noticias/confianca-de-servicos-avanca-em-setembro-e-encerra-terceiro-trimestre-de-forma-positiva.htm
CONTAS PÚBLICAS
MEconomia. PORTAL G1. 27/09/2019. Contas do governo têm déficit de R$ 16,8 bilhões em agosto. Com isso, houve melhora frente ao mesmo período do ano passado (-R$ 19,6 bilhões). Nos oito primeiros meses deste ano, rombo fiscal somou R$ 52 bilhões.
Por Alexandro Martello, G1 — Brasília
As contas do governo registraram déficit primário de R$ 16,852 bilhões em agosto deste ano, informou nesta sexta-feira (27) a Secretaria do Tesouro Nacional.
Quando as despesas do governo superam as receitas com impostos e contribuições, o resultado é deficitário. Quando acontece o contrário, há superávit. O conceito primário não engloba os gastos com juros da dívida pública.
De acordo com números oficiais, houve melhora em comparação ao mesmo período do ano passado – quando o rombo fiscal somou R$ 19,657 bilhões.
Contas do governo
Para meses de agosto, em R$ bilhões
2015
-5.706
-5.706
Fonte: Tesouro Nacional
Segundo o governo, a melhora no resultado das contas está relacionada, entre outros fatores, com o aumento da arrecadação – que registrou o melhor desempenho, para este período em cinco anos, por conta do maior nível de atividade econômica e do ingresso de receitas atípicas.
Ao todo, segundo o Tesouro, as receitas (após transferências aos estados e municípios) somaram R$ 117,315 bilhões em agosto deste ano – queda real de 1,3% na comparação com o mesmo período de 2018. As despesas totalizaram R$ 111,045 bilhões, com recuo real de 4,3% na mesma comparação.
Em todo ano passado, as contas do governo registraram déficit primário de R$ 120,258 bilhões, o equivalente a 1,7% do Produto Interno Bruto (PIB). Foi o quinto ano seguido em que as contas ficaram no vermelho.
Parcial do ano e meta fiscal
No acumulado dos oito primeiros meses deste ano, ainda segundo dados oficiais, as contas do governo registraram um rombo fiscal primário (sem contar gastos com juros) de R$ 52,124 bilhões.
Isso representa melhora frente ao mesmo período do ano passado (-R$ 58,739 bilhões) e, também, o melhor resultado para o período em quatro anos.
A melhora no resultado ajuda o governo no atingimento da meta fiscal para 2019, que é de um déficit primário de até R$ 139 bilhões nas suas contas.
Para cumprir a meta fiscal, cerca de R$ 21 bilhões em gastos ainda estão bloqueados no orçamento deste ano.
O rombo fiscal recuou no acumulado deste ano também por conta das dificuldades do governo em gastar os recursos. Isso ocorre devido ao excesso de vinculações de despesas e à evolução mais lenta de projetos.
Esse fenômeno é chamado de "empoçamento". Significa que os valores são autorizados, mas acabam não sendo gastos. No primeiro semestre, foram R$ 10,7 bilhões "empoçados".
Investimentos públicos
Segundo o governo, os investimentos totais somaram R$ 24,204 bilhões nos oito primeiros meses deste ano, com queda frente aos R$ 28,399 bilhões registrados no mesmo período do ano passado.
No caso dos investimentos somente em infraestrutura, o valor somou R$ 11,984 bilhões na parcial de 2019. Foram R$ 13,762 bilhões em igual período do último ano.
Rombo da Previdência
De acordo com a Secretaria do Tesouro Nacional, o déficit nas contas do Instituto Nacional do Seguro Social (INSS), sistema público que atende aos trabalhadores do setor privado, somou R$ 131,375 bilhões de janeiro a agosto deste ano, o que representa um crescimento de 6,5% na comparação com o mesmo período do ano passado – quando somou R$ 123,643 bilhões.
Para este ano, a estimativa do governo é que as contas do INSS registrem resultado negativo de R$ 218 bilhões. No ano passado, o déficit foi de R$ 195 bilhões.
Em razão dos seguidos déficits bilionários, o governo enviou ao Congresso uma proposta de reforma da Previdência. Entre outros pontos, o texto prevê idade mínima de 65 anos para homens e de 62 para mulheres poderem se aposentar. A proposta já foi aprovada, com alterações, em primeiro turno na Câmara dos Deputados e está em análise no Senado Federal.
Concessões, subsídios e dividendos
- as receitas com concessões somaram R$ 5,551 bilhões nos oito primeiros meses deste ano, contra R$ 10,236 bilhões no mesmo mês do ano passado.
- os dividendos recebidos de estatais somaram R$7,454 bilhões na parcial deste ano, contra R$ 6,265 bilhões no mesmo período de 2018.
- os subsídios e subvenções pagos pelo governo, por sua vez, somaram R$ 9,909 bilhões de janeiro a agosto deste ano, na comparação com R$ 12,273 bilhões em igual período de 2018.
MEconomia. 26/09/2019. ECONOMIA. Contas Públicas. Dívida Pública Federal registra R$39 bilhões em emissão liquida em agosto. Número é resultado da emissão de R$ 60 bilhões e resgates de R$ 21 bilhões, o estoque totalizou R$ 4,074 trilhões
O Tesouro Nacional divulgou nesta quinta-feira (26/9) o Relatório Mensal da Dívida Pública Federal (DPF) de agosto. As emissões da Dívida no último mês corresponderam a R$ 60,64 bilhões, enquanto os resgates totalizaram R$ 21 bilhões, resultando em emissão líquida de R$ 39,62 bilhões. A maior parte dessa emissão foi da Dívida Pública Mobiliária Federal interna (DPMFi), apenas R$ 0,32 bilhões foi referente a resgates líquidos da Dívida Pública Federal externa (DPFe).
Estoque
O estoque da dívida apresentou aumento de 2,03% em termos nominais, passando de R$ 3,993 trilhões, em julho, para R$ 4,074 trilhões, em agosto. A Dívida Pública Mobiliária Federal interna (DPMFi) teve seu estoque ampliado em 1,74%, passando de R$ 3,846 trilhões para R$ 3,913 trilhões, devido à emissão líquida no valor de R$ 39,94 bilhões e à apropriação positiva de juros no valor de R$ 27,02 bilhões.
As emissões de títulos da DPMFi alcançaram R$ 60,48 bilhões, sendo R$ 30,41 bilhões em títulos com remuneração prefixada, R$ 6,73 bilhões remunerados por índice de preços e R$ 23,32 bilhões em títulos indexados à taxa flutuante. Desse total, foram emitidos R$ 56,89 bilhões nos leilões tradicionais, R$ 1,98 bilhão relativos às vendas de títulos do programa Tesouro Direto e R$ 1,62 bilhão referentes às emissões diretas.
Com relação ao estoque da Dívida Pública Federal externa (DPFe), houve elevação de 9,55% sobre o estoque apurado em julho, encerrando o mês de agosto em R$ 160,87 bilhões, sendo R$ 146,31 bilhões referentes à dívida mobiliária e R$ 14,56 bilhões à dívida contratual. A variação do estoque no mês é devido a emissão líquida de R$ 39,62 e apropriação positiva de juros de R$ 41,37 bilhões.
Detentores
O estoque do grupo Previdência apresentou redução no mês, passando de R$ 998,89 bilhões para R$ 945,51 bilhões, entre julho e agosto. Com isso, a participação relativa do grupo caiu para 24,16%. Já as instituições financeiras, tiveram seu estoque ampliado em R$ 23,44 bilhões, alcançando R$ 897,43 bilhões no mês. Assim, a participação relativa passou de 22,72% para 22,93%.
Os fundos de investimento também elevaram o estoque, passando de R$ 972,83 bilhões para R$ 1,062 bilhões no mesmo período. Os não-residentes, por sua vez, apresentaram aumento de R$ 1,53 bilhões no estoque, o que reduziu a participação relativa do grupo de 12,31% para 12,14%. O grupo governo apresentou participação relativa de 3,97% em agosto e o estoque das seguradoras encerrou o mês em R$ 156,35 bilhões.
Sobre o fluxo de participação do grupo de não-residentes, o coordenador-geral de Operações da Dívida, Luis Felipe Vital, avaliou que os valores flutuam principalmente devido à variação da taxa de câmbio e a taxa nominal de juros, mas considerou que "o fluxo será maior e mais consistente quando as reformas de governo avançarem, o que tende a gerar um ambiente mais propício para o investimento estrangeiro".
Tesouro Direto
As emissões do Tesouro Direto em agosto atingiram R$ 1.975,10 milhões, enquanto os resgates corresponderam a R$ 2.101,50 milhões, o que resultou em resgate líquido de R$ 126,39 milhões. O título mais demandado pelos investidores foi o Tesouro Selic, que respondeu por 49,96% do montante vendido. Segundo o coordenador-geral Luis Felipe Vital, este é o segundo maior resgate líquido do programa, desde maio, devido ao pagamento de juros, e segundo ponto, foi ao resgate líquido do Tesouro Selic e IPCA+.
O estoque do Tesouro Direto alcançou R$ 58.134,58 milhões, o que representa um aumento de 0,56% em relação ao mês anterior. O título com maior representação no estoque é o Tesouro IPCA+, que corresponde a 35,42% do total, seguido pelo Tesouro Selic com 34,45%.
Em relação ao número de investidores, 224,395 novos participantes se cadastraram no Tesouro Direto em agosto. Desta forma, o total de investidores cadastrados chegou a 4.803.310, o que representa um incremento de 90,01% em relação ao mesmo mês do ano anterior. Este mês, 224 mil novos investidores cadastrados. Na avaliação de Vital, o programa Tesouro Direto vem se consolidando como uma modalidade democrática de investimento, com 67,5% de investidores aplicando até mil reais e com possibilidade de investir a partir de R$ 30.
Estimativas para setembro
Conforme a avaliação do Tesouro, as preocupações com desaceleração do crescimento global continuam impactando mercados emergentes. Em setembro, os juros locais cederam com mercado ajustando as expectativas de juros futuros. No mercado doméstico, houve fatores positivos em relação a queda das taxas de juros. Observando um mercado com queda na taxa de juros facilitando as taxas dos leilões futuros.
DOCUMENTO: http://www.economia.gov.br/noticias/2019/09/divida-publica-federal-registra-r-39-bilhoes-em-emissao-liquida-em-agosto
AVIAÇÃO
LATAM. DELTA. REUTERS. 26 DE SETEMBRO DE 2019. Delta vai comprar 20% da Latam por US$1,9 bilhão, venderá participação na Gol
Por Tracy Rucinski
CHICAGO, Estados Unidos (Reuters) - A Delta Air Lines anunciou nesta quinta-feira acordo para comprar participação de 20% na chilena Latam Airlines por 1,9 bilhão de dólares. Com a operação, o grupo norte-americano vai vender sua participação de longa data na companhia aérea brasileira Gol.
O acordo, que será financiado pela Delta com emissão recente de dívida e recursos em caixa, marca o maior investimento da companhia aérea norte-americana desde sua fusão com a Northwest Airlines, uma década atrás.
A Delta possui 12,3% das ações preferenciais da Gol e cerca de 1% do capital total. Aos preços desta quinta-feira, a fatia da companhia norte-americana na Gol tem um valor de mercado de cerca de 1 bilhão de reais.
No ano passado, Gol e Delta anunciaram parceria para voos do Brasil para a Flórida, nos Estados Unidos. A Delta também é parceira no programa de milhagem Smiles, controlado pela Gol.
Procurada pela Reuters, a Gol afirmou que o atual acordo de compartilhamento de voos com a empresa representa 0,3% da receita total da companhia aérea brasileira e 3,5% dos resgates de pontos do programa de fidelidade da sua controlada Smiles.
“Todos os clientes da Gol e da Delta que adquiriram passagens dentro desse acordo de compartilhamento de voos terão seus bilhetes honrados normalmente”, acrescentou a Gol em nota enviada na noite de quinta-feira.
A ação da Gol encerrou nesta quinta-feira em alta de 2,2%, a 34,23 reais. Nos Estados Unidos, os papéis da empresa fecharam em alta de 2,4%, mas desabaram mais de 9% no after hours. Na bolsa chilena, a ação da Latam teve alta de 2,36% nesta quinta-feira.
A Delta comprou em 2011 uma participação na Gol, pagando na época 22 reais por papel, um prêmio de 47% na ocasião, quando a companhia norte-americana injetou 100 milhões de dólares no grupo brasileiro.
Como resultado do acordo com a Delta, a Latam vai deixar a aliança de companhias aéreas Oneworld, da qual é membro de 2000.
A Delta não espera obstáculos regulatórios por sua aliança com a Latam, onde terá assento no conselho de administração. O plano prevê crescimento para ambas as companhias, que atualmente possuem sobreposição em apenas uma rota, afirmou o presidente-executivo da Delta, Ed Bastian.
“Eu acho que é uma grande adição”, disse o executivo.
A Delta vai fornecer à Latam um adicional de 350 milhões de dólares para ajudar a empresa na transição de saída da Oneworld para inserção na rede do grupo norte-americano.
Delta e Latam poderão começar operações de code share antes de receberem aprovações governamentais para a aliança, processo que Bastian afirmou que espera que leve entre 12 e 24 meses.
Como parte do acordo, a Delta também comprará quatro A350 da Latam e assumirá compromissos da companhia chilena para compra de outras 10 aeronaves do modelo previstas para serem entregues entre 2020 e 2025. O valor da aquisição não foi informado.
Além de participação na Gol, a Delta também tem fatias no Grupo Aeromexico, Air France KLM, China Eastern, Virgin Atlantic e na controladora da Korean Air Lines.
A empresa norte-americana também vinha negociando a compra de uma participação de 10% na Alitalia. Bastian disse que esta operação não muda com o acordo com a Latam.
Com reportagem adicional de Paula Arend Laier e Aluísio Alves, em São Paulo
LATAM. DELTA. REUTERS. 27 DE SETEMBRO DE 2019. Ação da Latam Airlines dispara 30% após acordo com Delta
Por Aislinn Laing
SANTIAGO (Reuters) - As ações do grupo Latam Airlines valorizavam-se cerca de 30% nesta sexta-feira, um dia depois que a Delta Air Lines anunciar que comprará uma participação de 20% na empresa por 1,9 bilhão de dólares, criando uma nova e importante parceria aérea e encerrando os laços da empresa chilena com a American Airlines.
Por volta de 10:15, os papéis tinha elevação de 28,47%, a 8.415,10 pesos chilenos, na bolsa de Santiago. Na máxima até o momento, os papéis foram negociados a 9 mil pesos.
O acordo surpresa com a maior companhia aérea da América Latina dará à Delta uma presença muito maior na região, um mercado em crescimento no qual a Latam voa para dezenas de destinos, incluindo cidades da Argentina, Peru e Brasil.
O acordo com a Latam é o maior da Delta desde que se fundiu com a Northwest Airlines há uma década.
Por Aislinn Laing
LATAM. DELTA. IBOVESPA. REUTERS. 27 DE SETEMBRO DE 2019. Ibovespa recua liderado por tombo da Gol após acordo Delta-Latam
SÃO PAULO (Reuters) - A bolsa paulista começava a sexta-feira no vermelho, com as ações da Gol (GOLL4.SA) liderando as perdas do Ibovespa após a Delta (DAL.N) anunciar acordo com a rival chilena Latam Airlines (LTM.SN), que contempla a venda da participação da norte-americana na companhia aérea brasileira.
Às 10:15, o Ibovespa .BVSP caía 0,07 por cento, a 105.242,58 pontos.
Por Paula Arend Laier
________________
LGCJ.: