US ECONOMICS
CUBA
US DEPARTMENT OF COMMERCE. US DEPARTMENT OF TREASURE. June 4, 2019. Commerce and Treasury Departments Implement Changes to Cuba Sanctions Rules
WASHINGTON – Today, the Department of the Treasury’s Office of Foreign Assets Control (OFAC) unveiled amendments to the Cuban Assets Control Regulations (CACR) to further implement the President’s foreign policy on Cuba. These amendments complement changes to the Department of Commerce’s Bureau of Industry and Security (BIS) Export Administration Regulations (EAR), which Commerce is also unveiling today. These regulatory changes were announced on April 17, 2019, and include restrictions on non-family travel to Cuba.
“Cuba remains communist, and the United States, under the previous administration, made too many concessions to one of our historically most aggressive adversaries,” said Commerce Secretary Wilbur Ross. “The Trump Administration recognizes the threat Cuba’s government poses in the region, and the Commerce Department is acting to limit commercial activity that provides revenue for the Cuban regime. Holding other countries accountable remains a focus for this Administration and we will remain vigilant.”
These actions mark a continued commitment towards implementing the National Security Presidential Memorandum signed by the President on June 16, 2017 titled “Strengthening the Policy of the United States Toward Cuba.” These policies continue to work to channel economic activities away from the Cuban military, intelligence, and security services. The Treasury changes will take effect on June 5, 2019 when the regulations are published in the Federal Register.
For the Treasury regulations, which can be found at 31 Code of Federal Regulations (CFR) part 515, see here. For the Commerce regulations, which can be found at 15 CFR parts 730-774, see here. Major elements of the changes in the revised regulations include:
Ending Group People-to-People Travel
- In accordance with the newly announced changes to non-family travel to Cuba, OFAC is amending the regulations to remove the authorization for group people-to-people educational travel. OFAC’s regulatory changes include a “grandfathering” provision, which provides that certain group people-to-people educational travel that previously was authorized will continue to be authorized where the traveler had already completed at least one travel-related transaction (such as purchasing a flight or reserving accommodation) prior to June 4, 2019.
Ending Exports of Passenger Vessels, Recreational Vessels, and Private Aircraft
- BIS, in coordination with OFAC, is amending its EAR to make passenger and recreational vessels and private and corporate aircraft ineligible for license exception and to establish a general policy of denial for license applications involving those vessels and aircraft.
- The BIS rule update will be effective today.
FULL DOCUMENT: https://www.commerce.gov/news/press-releases/2019/06/commerce-and-treasury-departments-implement-changes-cuba-sanctions
MÉXICO
US DEPARTMENT OF COMMERCE. June 3, 2019. Secretary Wilbur Ross Statement on Meeting with Mexico's Secretary of Economy
On June 3, 2019, Secretary of Commerce Wilbur Ross released the following statement following his meeting with Mexico's Secretary of Economy Graciela Márquez Colín at the U.S. Department of Commerce in Washington, D.C.:
Today, I met with Mexico’s Minister of Economy, Graciela Marquez, to discuss bilateral trade and United States’ upcoming plan to tariff Mexican goods at 5%. We also discussed next steps for the U.S.-Mexico-Canada Agreement. I reiterated the President’s message that Mexico needs to do more to help the U.S. address immigration across our shared border.
MONETARY POLICY
FED. June 04, 2019. Speech. Remarks. Chair Jerome H. Powell. At the "Conference on Monetary Policy Strategy, Tools, and Communications Practices" sponsored by the Federal Reserve, Federal Reserve Bank of Chicago, Chicago, Illinois
Good morning. I am very pleased to welcome you here today. This conference is part of a first-ever public review by the Federal Open Market Committee of our monetary policy strategy, tools, and communications. We have a distinguished group of experts from academics and other walks of life here to share perspectives on how monetary policy can best serve the public.
I’d like first to say a word about recent developments involving trade negotiations and other matters. We do not know how or when these issues will be resolved. We are closely monitoring the implications of these developments for the U.S. economic outlook and, as always, we will act as appropriate to sustain the expansion, with a strong labor market and inflation near our symmetric 2 percent objective. My comments today, like this conference, will focus on longer-run issues that will remain even as the issues of the moment evolve.
While central banks face a challenging environment today, those challenges are not entirely new. In fact, in 1999 the Federal Reserve System hosted a conference titled "Monetary Policy in a Low Inflation Environment." Conference participants discussed new challenges that were emerging after the then-recent victory over the Great Inflation.1 They focused on many questions posed by low inflation and, in particular, on what unconventional tools a central bank might use to support the economy if interest rates fell to what we now call the effective lower bound (ELB). Even though the Bank of Japan was grappling with the ELB as the conference met, the issue seemed remote for the United States. The conference received little coverage in the financial press, but a Reuters wire service story titled "Fed Conference Timing on Inflation Odd, but Useful" emphasized the remoteness of the risk.2 Participants at the conference could not have anticipated that only 10 years later, the world would be engulfed in a deep financial crisis, with unemployment soaring and central banks around the world making extensive use of new strategies, tools, and ways to communicate.
The next time policy rates hit the ELB—and there will be a next time—it will not be a surprise. We are now well aware of the challenges the ELB presents, and we have the painful experience of the Global Financial Crisis and its aftermath to guide us. Our obligation to the public we serve is to take those measures now that will put us in the best position deal with our next encounter with the ELB. And with the economy growing, unemployment low, and inflation low and stable, this is the right time to engage the public broadly on these topics.
The review has several parts, all of which are intended to open our monetary policy to critical examination. We are holding a series of Fed Listens events around the country to help us understand the perspectives of people from diverse backgrounds and with varied interests. This conference and many other engagements will help us bring to bear the best thinking from policymakers and experts. Beginning later this year, the FOMC will devote time at a series of our regular meetings to assess lessons from these events, supported by staff analysis performed throughout the Federal Reserve System. We will publicly report the outcome of our discussions. In the meantime, anyone who is interested in participating or learning more can find information on the Federal Reserve Board's website.3
Before turning to the specifics of the review, I want to focus a little more closely on the challenges we face today. For a reference point, at the time of the 1999 conference, the United States was eight years into an expansion; core inflation was 1.4 percent, and the unemployment rate was 4.1 percent—not so different from today.4 Macroeconomists were puzzling over the flatness of the Phillips curve, the level of the natural rate of unemployment, and a possible acceleration in productivity growth—questions that are also with us today.5
The big difference between then and now is that the federal funds rate was 5.2 percent—which, to underscore the point, put the rate 20 quarter-point rate cuts away from the ELB. Since then, standard estimates of the longer-run normal or neutral rate of interest have declined between 2 and 3 percentage points, and some argue that the effective decline is even larger.6 The combination of lower real interest rates and low inflation translates into lower nominal rates and a much higher likelihood that rates will fall to the ELB in a downturn.
As the experience of the past decade showed, extended ELB episodes can be associated with painfully high unemployment and slow growth or recession. Economic weakness puts downward pressure on inflation, which can raise real interest rates and reinforce the challenge of supporting needed job growth. In addition, over time, inflation has become much less sensitive to tightness in resource utilization. This insensitivity can be a blessing in avoiding deflation when unemployment is high, but it means that much greater labor market tightness may ultimately be required to bring inflation back to target in a recovery. Using monetary policy to push sufficiently hard on labor markets to lift inflation could pose risks of destabilizing excesses in financial markets or elsewhere.
In short, the proximity of interest rates to the ELB has become the preeminent monetary policy challenge of our time, tainting all manner of issues with ELB risk and imbuing many old challenges with greater significance. For example, the behavior of inflation7 now draws much sharper focus. When nominal interest rates were around 4 or 5 percent, a low-side surprise of a few tenths on inflation did not raise the specter of the ELB. But the world has changed. Core inflation is currently running a bit below 2 percent on a trailing 12-month basis. In this setting, a similar low-side surprise, if it were to persist, would bring us uncomfortably closer to the ELB. My FOMC colleagues and I must—and do—take seriously the risk that inflation shortfalls that persist even in a robust economy could precipitate a difficult-to-arrest downward drift in inflation expectations. At the heart of the review is the evaluation of potential changes to our strategy designed to strengthen the credibility of our symmetric 2 percent inflation objective.
The ELB problem also complicates the FOMC's efforts to achieve transparency and accountability. The Fed, like most major central banks, is insulated from short-term political pressures. In our democracy, that insulation carries with it an obligation for us to be transparent and publicly accountable. When policy rates reached the ELB during the crisis, central banks resorted to what were then new, untested tools to pursue their mandated goals. These tools are no longer new, but their efficacy, costs, and risks remain less well understood than the traditional approaches to central banking. My FOMC colleagues and I are committed to explaining why the use of these tools in the wake of the crisis was a prudent and effective approach to pursuing our congressional mandate and why tools like these are likely to be needed again. Our review is but one part of our efforts to engage with the public on these matters.
Let me turn to the specifics of the review, which is focused on three questions:
- Can the Federal Reserve best meet its statutory objectives with its existing monetary policy strategy, or should it consider strategies that aim to reverse past misses of the inflation objective?
- Are the existing monetary policy tools adequate to achieve and maintain maximum employment and price stability, or should the toolkit be expanded?
- How can the FOMC's communication of its policy framework and implementation be improved?
These questions are quite broad, and my colleagues and I come to them with open minds. We believe our current policy framework is working well, and we have made no decisions about particular changes. In fact, the review is still in its early stages.
The first question raises the issue of whether the FOMC should use makeup strategies in response to ELB risks. By the time of the 1999 conference, research was beginning to show that—in models, at least—such strategies could substantially reduce the unemployment and other costs of ELB spells.8 The simplest version goes like this: Suppose that a spell with interest rates near the ELB leads to a persistent shortfall of inflation relative to the central bank's goal. But what if the central bank promised credibly that it would deliberately make up for any lost inflation by stimulating the economy and temporarily pushing inflation modestly above the target? In the models, the prospect of future stimulus promotes anticipatory consumption and investment that could greatly reduce the pain of being at the ELB.9 Policymakers discussed this reasoning in the wake of the crisis, but neither the Fed nor any other major central bank chose to pursue such a policy.10 Why? For makeup strategies to work, households and businesses must go out on a limb, so to speak, raising spending in the midst of a downturn. In theory, they would do this based on their confidence that the central bank will deliver the makeup stimulus at some point—perhaps years in the future. In models, great confidence in central bankers is achieved by assumption. Despite the flattering nature of this assumption, crisis-era policymakers had major questions about whether their promise of good times to come would really have moved the hearts, minds, and pocketbooks of the public. Part of the problem was that the groundwork had not been laid in advance of the downturn—a problem we could hope to fix well before next time. Policymakers also had deeper concerns about the legitimacy and effectiveness of attempting to bind some future FOMC to take actions that could be objectionable from a short-term perspective when the time came to deliver.11
Research on makeup strategies has begun to grapple more seriously with the credibility questions.12 But important questions remain. To achieve buy-in by households and businesses, a comprehensible, credible, and actionable makeup strategy will need to be followed by years of central bank policy consistent with that strategy.
The second question asks about the adequacy of the Fed's toolkit for providing stimulus when facing the ELB. In the United States, we used several different formulations of both forward guidance and large‑scale purchases of longer-term securities.13 While views differ on the effectiveness of these policies, with their use, the unemployment rate fell steadily and inflation expectations remained well anchored, outcomes that were favorable overall when viewed against the recoveries of many other advanced economies. My own view is that these policies provided meaningful support for demand, but that they should not be thought of as a perfect substitute for our traditional interest rate tool. In any case, we have a responsibility to thoroughly evaluate what mix of these tools is likely to work best when the next ELB episode arrives.
Perhaps it is time to retire the term "unconventional" when referring to tools that were used in the crisis. We know that tools like these are likely to be needed in some form in future ELB spells, which we hope will be rare. We now have a significant body of evidence regarding the effectiveness, costs, and risks of these tools, including those used by the FOMC and others tried elsewhere. Our plans must take advantage of this growing understanding as assessments are refined.
The third question concerns improving communication, which I discussed earlier from the standpoint of governance and accountability. But transparency also plays a central role in policy effectiveness through its effects on the expectations of households and businesses. Of course, this was the major insight behind the transparency revolution in central banking over the past few decades. Today, central banks publicly share a large and ever-increasing amount of information about policy. But policymakers and commentators inside and outside central banks sometimes question whether all of the transparency adds up to effective communication.14
The FOMC's famous dot plot is one example. A focus on the median forecast amounts to emphasizing what the typical FOMC participant would do if things go as expected. But we have been living in times characterized by large, frequent, unexpected changes in the underlying structure of the economy.15 In this environment, the most important policy message may be about how the central bank will respond to the unexpected rather than what it will do if there are no surprises. Unfortunately, at times the dot plot has distracted attention from the more important topic of how the FOMC will react to unexpected economic developments. In times of high uncertainty, the median dot might best be thought of as the least unlikely outcome.
Let me conclude by saying that I look forward to our discussions here and to the ongoing work of the review that lies ahead. We need the best tools and strategies possible for dealing with the challenges we now face, and we must communicate them in a clear and credible way. My colleagues and I welcome your best thinking on these issues.
References
- Bank of Japan (2016). "New Framework for Strengthening Monetary Easing: 'Quantitative and Qualitative Monetary Easing with Yield Curve Control,' " (PDF) announcement, September 21.
- Bernanke, Ben S. (2017). "Monetary Policy in a New Era," (PDF) paper presented at "Rethinking Macroeconomic Policy," a conference held at the Peterson Institute of International Economics, Washington, October 12–13.
- Bernanke, Ben S., Michael T. Kiley, and John M. Roberts (2019). "Monetary Policy Strategies for a Low-Rate Environment," (PDF) Finance and Economics Discussion Series 2019-009. Washington: Board of Governors of the Federal Reserve System, February.
- Eggertsson, Gauti B., and Michael Woodford (2003). "The Zero Bound on Interest Rates and Optimal Monetary Policy," (PDF) Brookings Papers on Economic Activity, no. 1, pp. 139–211.
- English, William B., J. David López-Salido, and Robert J. Tetlow (2015). "The Federal Reserve's Framework for Monetary Policy: Recent Changes and New Questions," IMF Economic Review, vol. 63 (April), pp. 22–70.
- Greenspan, Alan (1998). "Question: Is There a New Economy?" speech delivered at the Haas Annual Business Faculty Research Dialogue, University of California, Berkeley, September 4.
- Hebden, James, and J. David López-Salido (2018). "From Taylor's Rule to Bernanke's Temporary Price Level Targeting," (PDF) Finance and Economics Discussion Series 2018-051. Washington: Board of Governors of the Federal Reserve System, July.
- Herbst-Bayliss, Svea (1999). "Fed Conference Timing on Inflation Odd, but Useful," Reuters News, October 20.
- Kiley, Michael T., and John M. Roberts (2017), "Monetary Policy in a Low Interest Rate World," (PDF) Brookings Papers on Economic Activity, Spring, pp. 317–72.
- Mertens, Thomas M., and John C. Williams (2019). Monetary Policy Frameworks and the Effective Lower Bound on Interest Rates (PDF), Staff Report 877. New York: Federal Reserve Bank of New York, January.
- Nessén, Marianne, and David Vestin (2005). "Average Inflation Targeting," Journal of Money, Credit and Banking, vol. 37 (October), pp. 837–63.
- Olson, Peter, and David Wessel (2016a). "Federal Reserve Communications: Survey Results." (PDF) Washington: Hutchins Center on Fiscal and Monetary Policy at Brookings, November.
- ——— (2016b). "Survey Finds Mixed Feelings on Fed Communication," Wall Street Journal, November 21. (Also reprinted and available on the Brookings Institution site at https://www.brookings.edu/opinions/survey-finds-mixed-feelings-on-fed-communication.)
- Powell, Jerome H. (2018). "Monetary Policy in a Changing Economy," speech delivered at "Changing Market Structure and Implications for Monetary Policy," a symposium sponsored by the Federal Reserve Bank of Kansas City, held in Jackson Hole, Wyo., August 23–25.
- Rachel, Lukasz, and Lawrence H. Summers (2019). "On Falling Neutral Real Rates, Fiscal Policy, and the Risk of Secular Stagnation," (PDF) paper presented at the Brookings Papers on Economic Activity Conference, Spring, held at the Brookings Institution, Washington, March 7–8.
- Reifschneider, David, and John C. Williams (2000), "Three Lessons for Monetary Policy in a Low Inflation Era," Journal of Money, Credit and Banking, vol. 32 (November), pp. 936–66.
- Wiley-Blackwell (2000). Journal of Money, Credit and Banking, vol. 32 (November), pp. 707–1109.
- Wolman, Alexander L. (2005). "Real Implications of the Zero Bound on Nominal Interest Rates," Journal of Money, Credit and Banking, vol. 37 (March),pp. 273–96.
NOTES
- The proceedings of the conference were published in the November 2000 issue of Journal of Money, Credit and Banking.
- Herbst-Bayliss (1999).
- More on Fed Listens events and related information is available on the Board's website at https://www.federalreserve.gov/monetarypolicy/review-of-monetary-policy-strategy-tools-and-communications-fed-listens-events.htm.
- The inflation rate referenced is the October 12-month percent change in the price index for personal consumption expenditures excluding food and energy.
- The discussion of all these issues was centered on Fed Chair Alan Greenspan's (1998) "New Economy" hypothesis that the United States had undergone fundamental changes for the better, leading to the otherwise puzzling outcomes.
- See, for example, the estimates of the neutral rate reported on the New York Fed's website at https://www.newyorkfed.org/research/policy/rstar. Rachel and Summers (2019) give reasons why the effective change may be larger.
- For example, based on the Federal Reserve staff's Greenbook forecast, across forecasts prepared for 59 FOMC meetings between 1997 and 2004, one-third of the year ahead, four-quarter inflation forecast errors were 0.5 percentage point or greater in absolute value. Error tended to be on the low side, and 45 percent of low-side misses were greater than 0.5 percentage point in absolute value.
- See Reifschneider and Williams (2000) and references therein. For a more recent review of this subject, see Bernanke, Kiley, and Roberts (2019) and Mertens and Williams (2019). Return to text
- Eggertsson and Woodford (2003), for example, show that optimal policy at the ELB entails a commitment to reflate the price level during subsequent economic expansions. See also Wolman (2005) for a discussion of the effectiveness of price-level targeting at the ELB. For a discussion of the relationship between price-level targeting and average-inflation targeting, see Nessén and Vestin (2005). The strategy in Reifschneider and Williams (2000), for instance, involves a central bank following a Taylor rule modified to make up for shortfalls in policy accommodation during ELB episodes. Kiley and Roberts (2017) study a strategy in which policymakers aim for inflation higher than 2 percent during normal times to compensate for below-target inflation during ELB episodes. Also see Bernanke (2017) for a strategy in which low inflation is made up if it occurs when the federal funds rate is at or near the ELB. See also Bernanke, Kiley, and Roberts (2019) and Mertens and Williams (2019).
- The Bank of Japan (2016) came closest, announcing in September 2016 an "inflation-overshooting commitment" (p. 1). The commitment did not, however, come with any explicit goal for a degree or duration of overshoot.
- These issues were discussed by the FOMC at several points, especially during 2011 (see the 2011 FOMC transcripts, available on the Board's website at https://www.federalreserve.gov/monetarypolicy/fomchistorical2011.htm).
- See, for example, English, López-Salido, and Tetlow (2015); Hebden and López-Salido (2018); Bernanke, Kiley, and Roberts (2019); and Mertens and Williams (2019).
- For details on formulations used by the United States for forward guidance and large-scale purchases of longer-term securities as well as other references, see, for example, https://www.federalreserve.gov/monetarypolicy/bst_openmarketops.htm and https://www.federalreserve.gov/monetarypolicy/expiredtools.htm.
- A 2016 Brookings conference titled "Understanding Fedspeak" (see https://www.brookings.edu/events/understanding-fedspeak) raised several aspects of this issue. For example, Olson and Wessel (2016a) presented results of a survey of those who follow the Fed closely; in an op-ed (2016b), they noted that "Some 73 percent of academics said Fed communications helps the markets; only 44 percent of private-sector Fed watchers agreed."
- For more on changes in the underlying structure of the economy, see Powell (2018).
________________
ORGANISMS
IMF
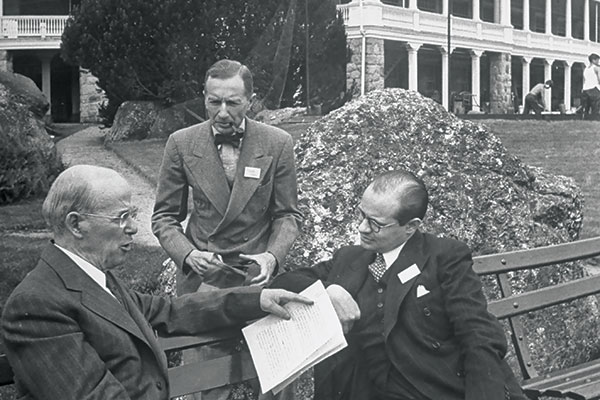
IMF. FINANCE & DEVELOPMENT, JUNE 2019, VOL. 56, NO. 2 PDF VERSION. The IMF Today and Tomorrow. To meet future challenges, the IMF must have strong backing from its members
MARTIN WOLF is associate editor and chief economics commentator at the Financial Times.
Dear Colleague,
In the opening feature of our June issue, Martin Wolf, associate editor and chief economics commentator at the Financial Times, writes about the IMF of today and tomorrow. Throughout the piece, Wolf details eight significant ways in which the world has changed over the past few decades, including a shift in global economic power, an increase in great-power rivalry, a turn toward populist politics, a slow down in globalization, and the role of technology, among others—then offering up a way forward for the 75-year-old institution.
"If the world of cooperative globalization is to survive and the IMF is to maintain its role within it, a great deal must change. Some of these changes are within the Fund’s control. Others call for a new global consensus," writes Wolf. "In the end, the Fund is the world’s servant. It can guide, but it cannot shape the world. As the world goes, so will the IMF." Read more.
Finally, if you have ideas for future F&D articles or interviews, please write to me at rkanani@imf.org. I read them all, so don't be shy.
Have a great week,
Rahim
Rahim Kanani
Digital Editor, F&D Magazine
International Monetary Fund
“Protection will lead to great prosperity and strength.”
—US President Donald Trump, inaugural address, January 20, 2017
“We have come to recognize that the wisest and most effective way to protect our national interests is through international cooperation—that is to say, through united effort for the attainment of common goals.”
—US Treasury Secretary Henry Morgenthau, Jr., closing address
at Bretton Woods Conference, July 22, 1944
“For everything to stay the same, everything must change.”
—Giuseppe Tomasi di Lampedusa,
The Leopard
The world is changing. The IMF is changing with it. The question, however, is not only how it needs to change if it is to remain relevant. It is also whether the political environment will allow it to remain relevant. The IMF is built on a commitment to cooperation among member countries. That commitment is on the wane. But the countries of the world might rediscover its importance. If so, they will find the Fund an invaluable instrument. The IMF cannot ensure that outcome. But it can, and must, prepare for it. To its credit, it is doing so.
The world that surrounds the Fund has changed, or is changing, in several crucial respects.
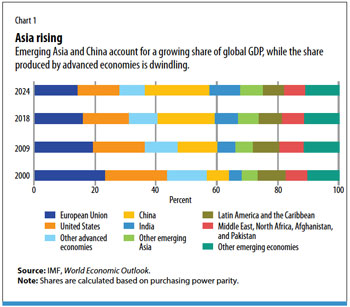
The first and most important change is a shift in global economic, and therefore political, power. In 2000, advanced economies generated 57 percent of global output, measured by purchasing power parity. By 2024, according to IMF forecasts, that share will fall to 37 percent. Meanwhile, China’s share will jump to 21 percent from 7 percent, and the rest of emerging Asia will account for 39 percent of global output, compared with 14 percent for the United States and 15 percent for the European Union (see Chart 1).
The second transformation is an increase in great-power rivalry as relations deteriorate between Western powers and a rising China. The United States has labeled China a “strategic competitor.” The European Union, more narrowly, has called it an “economic competitor in the pursuit of technological leadership.” Either way, cooperation seems certain to become more difficult.
The third change is a turn toward populist politics, not least within advanced economies. One feature of this populism is suspicion toward technocratic expertise. This affects not just the credibility of domestic technocratic institutions, including independent central banks and finance ministries, but also of international technocratic institutions, among which the IMF is arguably the most significant.
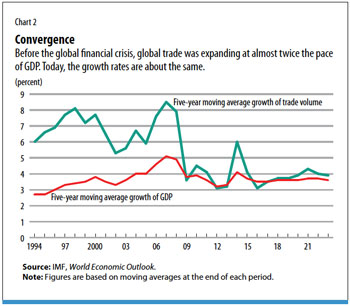
The fourth change consists of the slowdown, or even reversal, of globalization. This is markedly true in some areas of finance, such as a dramatic decline in the foreign claims of euro area banks (Lund and others 2017). But it is also true in trade: prior to the transatlantic financial crisis, the volume of world trade grew almost twice as fast as world output. Now trade and output are growing at about the same rate. Recently we have even seen the emergence of outright protectionism in the United States (see Chart 2).
The fifth change involves technology. Technological progress has been the driving force of economic growth. But the role of the internet and recent advances in artificial intelligence have brought new vulnerabilities and upheavals, including cyberattacks and massive shifts in labor markets.
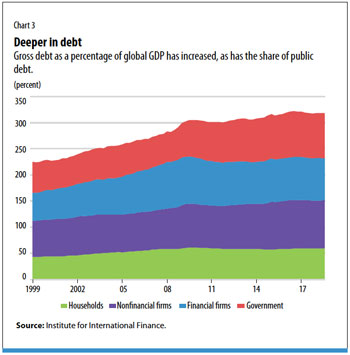
The sixth change is an increase in financial fragility. This has been gathering over decades. Substantial efforts have been made to reduce this fragility, not least by the IMF. But the ratio of debt to gross output has increased, and debt has shifted from the private to the public sector and to some degree from advanced to emerging market economies. Further financial disruptions are quite possible (see Chart 3).
The seventh change is the phenomenon dubbed “secular stagnation” by Harvard University’s Lawrence Summers at an IMF conference in 2013. Weak demand, indicated by a combination of low inflation and ultralow real and nominal interest rates, appears to be structural and so is likely to persist. Room for an effective conventional—or even conventionally unconventional—policy response to a downturn might be very limited.
The final change is the rising salience of climate change as a policy issue. This is likely to have important effects on development strategies and macroeconomic policies in all countries, particularly in poorer and more vulnerable ones.
All this creates a highly challenging environment for the IMF, which has also been changing. Indeed, its most durable characteristic has been its ability to adapt to successive changes in the world. This partly reflects the high quality of its staff and its usually competent management.
Yet the IMF is also handicapped by a limited capacity to influence the actions either of countries with robust balance of payments positions or of the United States, the issuer of the world’s reserve currency, the dollar. This is not a new issue: it was recognized—and remained unresolved—at the Bretton Woods conference in 1944 (Steil 2013). The Fund also makes mistakes, not least because it is heavily influenced by the conventional wisdom of professional economists and powerful countries. It seriously underestimated the perils of financial liberalization, both domestic and external. This was true despite the prescient warnings of Raghuram Rajan, the IMF’s economic counsellor from 2003 to 2006.
Learning from mistakes
It is, however, reasonable to expect the Fund to learn from mistakes. It has done so. After the transatlantic crisis, it reevaluated the impact of government spending cuts and tax increases on growth. The quality of its surveillance of financial risks has also vastly improved in its flagshipGlobal Financial Stability Report and World Economic Outlook and in work on member countries. An important step has been its recognition that liberalizing flows of capital across borders carries risks as well as benefits.
No crisis has been more troublesome than the one in the euro area. It put the IMF in the difficult position of dealing with a central bank and countries it could not control. The Fund worked with euro area institutions on country programs that had some successes but also significant shortcomings, notably in the case of Greece. One result was to reform the IMF’s lending framework for countries with high sovereign debt and, above all, to end exemptions—in the case of systemic crises—from mandatory debt sustainability as a condition for Fund support.
The IMF’s stepped-up engagement with fragile states is significant as well. It requires new and imaginative approaches to securing necessary political and institutional transformation.
With these steps, the Fund has updated its old agenda of maintaining macroeconomic stability. But it has also taken up several new challenges, including income and wealth inequality, gender inequality, corruption, and climate change. These challenges are outside the Fund’s historical areas of competence. But they are vital in themselves and to important constituencies in member countries, and they have important macroeconomic implications. Softening the IMF’s image can be helpful, especially in a political environment that has become difficult for international financial institutions. And, in some respects, the Fund’s work has been vital, especially on fossil fuel subsidies and the cost of corruption.
Challenges to come
If the world of cooperative globalization is to survive and the IMF is to maintain its role within it, a great deal must change. Some of these changes are within the Fund’s control. Others call for a new global consensus.
A big internal task is to take on the intellectual challenges of our unstable world economy. Particularly significant is the need to reconsider monetary, fiscal, and structural policies, globally and within influential countries, in the context of ultralow interest rates, low inflation, large debt overhangs, and secular stagnation. What are policymakers to do when the next downturn comes? How—if at all—might mass restructuring of private or sovereign debt be managed? Is there any validity in unorthodox perspectives such as “modern monetary theory”? The Fund needs to become even more deeply engaged in these topics if it is to prepare for what lies ahead. But it must also get more closely engaged in other difficult areas. The political economy of protectionism is one example. The impact of artificial intelligence is another.
Above all, the IMF must remain relevant to all its members. The only plausible way to do that is to produce work of the highest intellectual quality and integrity, especially in surveillance. This may irritate the subjects of the Fund’s judgments from time to time. But it will sustain the reputation and influence of the IMF among its members. A question in this context is whether it needs more staff expertise in the politics of change: it is all very well to preach the ending of subsidies, but how is that to be accepted? Another question is whether more staff should reside permanently in member countries. A detailed review of the IMF’s way of working would make good sense.
The most important challenges for the IMF of tomorrow are, however, those created by our changing world. Three stand out.
First, voting shares should be aligned with each member’s economic importance. EU members (including the United Kingdom) currently have 29.6 percent of votes; the United States, 16.5 percent; Japan, 6.2 percent; and Canada, 2.2 percent. By contrast, China has a mere 6.1 percent and India 2.6 percent. These figures are wildly out of keeping with the relative weight of these economies. True, advanced economies still dominate global finance and issue all the significant reserve currencies. But this will probably not last. If institutions such as the IMF are to remain globally relevant, voting shares must be reweighted, especially toward Asia, as Edwin Truman (2018) of the Peterson Institute for International Economics has persuasively argued. Otherwise, China will surely establish its own version of the IMF, just as it has already launched the Asian Infrastructure Investment Bank and the New Development Bank.
Second, the IMF’s financial firepower must be increased substantially, particularly in a world of relatively free capital flows. Its lending capacity is currently just $1 trillion. Compare that with global foreign exchange reserves of $11.4 trillion. The disparity demonstrates the inadequacy of IMF resources and the perceived costliness of gaining access to them. Of course, there is moral hazard associated with expanding the safety net. But moral hazard does not eliminate the case for insurance, fire brigades, or central banks. The same applies to the Fund.
Finally, if the institution is to be credibly global, its top job cannot be permanently left in the hands of a European, however admirable some of those Europeans have been. Global institutions need the best global leaders. Those leaders should be chosen not by a process of lowest-common-denominator horse trading, but openly and transparently, with candidates required to submit their platforms for the future development of the institution.
Will to cooperate
As IMF Managing Director Christine Lagarde has said, “The 44 nations gathering at Bretton Woods were determined to set a new course—based on mutual trust and cooperation, on the principle that peace and prosperity flow from the font of cooperation, on the belief that the broad global interest trumps narrow self-interest.” It is the marriage of professionalism with this will to cooperate that has made the IMF a cornerstone institution.
Perhaps the Fund’s most striking quality is its adaptability. It will surely need that adaptability in the years to come. But even more, it will need a world where the dominant powers believe in what the IMF embodies: professionalism, multilateralism, and above all, cooperation. If this is not the world in which it operates, it will struggle. In the end, the Fund is the world’s servant. It can guide, but it cannot shape the world. As the world goes, so will the IMF.
References
- Lund, Susan, Eckart Windhagen, James Manyika, Philipp Härle, Jonathan Woetzel, and Diana Goldshtein. 2017. “The New Dynamics of Financial Globalization.” McKinsey Global Institute, New York.
- Steil, Benn. 2013. The Battle of Bretton Woods: John Maynard Keynes, Harry Dexter White, and the Making of a New World Order . Princeton, NJ: Princeton University Press.
- Truman, Edwin M. 2018. “ IMF Quota and Governance Reform Once Again.” PIIE Policy Brief, Peterson Institute for International Economics, Washington, DC.
FULL DOCUMENT: https://www.imf.org/external/pubs/ft/fandd/2019/06/the-future-of-the-imf-wolf.htm?utm_medium=email&utm_source=govdelivery
________________
ECONOMIA BRASILEIRA / BRAZIL ECONOMICS
VENEZUELA
PR. MRE. REUTERS. 4 DE JUNHO DE 2019. Bolsonaro recua e recebe credencial de embaixadora venezuelana representante de Guaidó
Embaixadora venezuelana María Teresa Belandria, representante no país do autoproclamado presidente interino da Venezuela, Juan Guaidó 11/02/2019 REUTERS/Ueslei Marcelino
BRASÍLIA (Reuters) - O presidente Jair Bolsonaro recebeu nesta terça-feira a credencial de embaixadora venezuelana María Teresa Belandria, representante no país do autoproclamado presidente interino da Venezuela, Juan Guaidó, em um recuo depois que o governo havia retirado o convite à enviada do líder de oposição.
A confirmação da apresentação da credencial por Belandria ocorreu pouco antes do início de cerimônia no Palácio do Planalto, às 10h30. Belandria foi a primeira da lista de nove novos embaixadores, e não falou com a imprensa.
A decisão de incluir a embaixadora venezuelana na cerimônia foi tomada na noite de segunda-feira por Bolsonaro em reunião com o ministro das Relações Exteriores, Ernesto Araújo, de acordo com uma fonte.
Na semana passada, o porta-voz da Presidência, Otavio Rêgo Barros, chegou a afirmar que a recepção dela estava em aberto e esperando o momento oportuno.
O governo havia decidido desconvidar a representante no Brasil de Guaidó da cerimônia de entrega de credenciais diplomáticas, à medida que os militares —que compõem cerca de um terço do gabinete de Bolsonaro— têm sido cautelosos em provocar o presidente venezuelano, Nicolás Maduro.
Por Ricardo Brito e Lisandra Paraguassu
INFLAÇÃO
FGV. IBRE. 04/06/19. Índices Gerais de Preços. IPC-S Capitais. Inflação pelo IPC-S recua em todas as sete capitais pesquisadas
O IPC-S de 31 de maio de 2019 variou 0,22%,ficando 0,12 ponto percentual (p.p) abaixo da taxa registrada na última divulgação. Com este resultado, o indicador acumula alta de 2,44% no ano e 4,99% nos últimos 12 meses.
A tabela a seguir, apresenta as variações percentuais dos municípios das sete capitais componentes do índice, nesta e nas apurações anteriores.

DOCUMENTO: https://portalibre.fgv.br/navegacao-superior/noticias/noticias-1554.htm
INDÚSTRIA
IBGE. 04/06/2019. Em abril, produção industrial varia 0,3%
Em abril de 2019, a produção industrial nacional variou 0,3% frente a março (série com ajuste sazonal), eliminando, assim, parte do recuo de 1,4% observado em março. No confronto com abril de 2018 (série sem ajuste sazonal), a indústria caiu 3,9%, após também registrar queda no mês anterior (-6,2%).
| Abril 2019 /Março 2019 | 0,3% |
| Abril 2019 / Abril 2018 | -3,9% |
| Acumulado em 2019 | -2,7% |
| Acumulado em 12 meses | -1,1% |
| Média Móvel Trimestral | - 0,1% |
Assim, o setor industrial acumulou perda de 2,7% nos quatro primeiros meses de 2019. O indicador acumulado nos últimos doze meses, ao assinalar recuo de 1,1% em abril de 2019, permaneceu com a trajetória descendente iniciada em julho de 2018 (3,3%). Com esses resultados, o setor industrial ainda se encontra 17,3% abaixo do nível recorde alcançado em maio de 2011.
| Indicadores da Produção Industrial por Grandes Categorias Econômicas Brasil - Abril de 2019 | ||||
|---|---|---|---|---|
| Grandes Categorias Econômicas | Variação (%) | |||
| Abril 2019/Março 2019* | Abril 2019/Abril 2018 | Acumulado Janeiro-Abril | Acumulado nos Últimos 12 Meses | |
| Bens de Capital | 2,9 | -0,6 | -3,1 | 1,8 |
| Bens Intermediários | -1,4 | -6,1 | -3,1 | -1,5 |
| Bens de Consumo | 3,1 | -0,3 | -1,5 | -1,0 |
| Duráveis | 3,4 | 1,2 | -2,2 | 0,6 |
| Semiduráveis e não Duráveis | 2,6 | -0,7 | -1,3 | -1,4 |
| Indústria Geral | 0,3 | -3,9 | -2,7 | -1,1 |
| Fonte: IBGE, Diretoria de Pesquisas, Coordenação de Indústria *Série com ajuste sazonal | ||||
20 dos 26 ramos industriais mostram expansão
No acréscimo de 0,3% da atividade industrial, na passagem de março para abril de 2019, três das quatro grandes categorias econômicas e 20 dos 26 ramos pesquisados mostraram expansão na produção. Entre as atividades, as principais influências positivas foram registradas por veículos automotores, reboques e carrocerias (7,1%), máquinas e equipamentos (8,3%), outros produtos químicos (5,2%) e produtos alimentícios (1,5%), com todos revertendo o comportamento negativo observado em março último: -2,8%, -0,1%, -3,9% e -5,0%, respectivamente. Outras contribuições positivas relevantes vieram de bebidas (3,4%), de metalurgia (1,7%), de couro, artigos para viagem e calçados (5,4%), de produtos têxteis (5,8%), de equipamentos de informática, produtos eletrônicos e ópticos (4,0%) e de produtos de borracha e de material plástico (1,9%). Por outro lado, entre os seis ramos que reduziram a produção nesse mês, o desempenho de maior importância para a média global foi registrado por indústrias extrativas, que recuou 9,7%, marcando, dessa forma, o quarto resultado negativo consecutivo e acumulando nesse período redução de 25,7%. Vale citar, também, o impacto negativo assinalado pelo setor de coque, produtos derivados do petróleo e biocombustíveis (-2,0%), que recuou pelo segundo mês seguido e acumulou perda de 5,0% nesse período.
Entre as grandes categorias econômicas, ainda na comparação com o mês imediatamente anterior, bens de consumo duráveis (3,4%), bens de capital (2,9%) e bens de consumo semi e não-duráveis (2,6%) assinalaram as taxas positivas em abril de 2019. Com esses resultados, o primeiro segmento eliminou o recuo de 0,6% observado em março; o segundo completou o terceiro mês consecutivo de crescimento na produção, período em que acumulou expansão de 9,1%; e o último voltou a crescer após cair 0,9% no mês anterior. Por outro lado, o setor produtor de bens intermediários (-1,4%) apontou a única taxa negativa nesse mês e marcou o quarto recuo seguido, acumulando redução de 4,2%.
Média Móvel Trimestral varia -0,1%
Ainda na série com ajuste sazonal, a evolução do índice de média móvel trimestral para o total da indústria mostrou decréscimo de 0,1% no trimestre encerrado em abril de 2019 frente ao nível do mês anterior e manteve a trajetória predominantemente descendente iniciada em agosto de 2018. Entre as grandes categorias econômicas, ainda em relação ao movimento deste índice na margem, bens intermediários, ao recuar 1,4%, apontou a queda mais acentuada nesse mês e o terceiro resultado negativo consecutivo, acumulando nesse período redução de 2,6%. Por outro lado, os setores produtores de bens de capital (2,9%), de bens de consumo duráveis (2,2%) e de bens de consumo semi e não-duráveis (0,8%) assinalaram os avanços em abril de 2019, com o primeiro intensificando a expansão verificada no mês anterior (1,3%), quando interrompeu quatro meses seguidos de taxas negativas; o segundo registrando o terceiro mês consecutivo de crescimento e acumulando nesse período ganho de 5,1%; e o último mantendo a trajetória predominantemente ascendente iniciada em janeiro de 2019.
Indústria cai 3,9% em relação a abril de 2018
Na comparação com igual mês do ano anterior, o setor industrial mostrou queda de 3,9% em abril de 2019, com resultados negativos em três das quatro grandes categorias econômicas, 13 dos 26 ramos, 40 dos 79 grupos e 52,8% dos 805 produtos pesquisados. Vale citar que abril de 2019 (21 dias) teve o mesmo número de dias úteis do que igual mês do ano anterior (21). Entre as atividades, indústrias extrativas (-24,0%) exerceu a maior influência negativa na formação da média da indústria, pressionada, em grande medida, pela menor fabricação dos itens minérios de ferro, refletindo, em grande parte, os efeitos do rompimento de uma barragem de rejeitos de mineração na região de Brumadinho (MG) ocorrido em janeiro de 2019. Vale destacar, também, as contribuições negativas assinaladas pelos ramos de produtos alimentícios (-4,8%), de coque, produtos derivados do petróleo e biocombustíveis (-4,1%), de impressão e reprodução de gravações (-27,1%), de manutenção, reparação e instalação de máquinas e equipamentos (-13,0%), de outros equipamentos de transporte (-13,4%) e de equipamentos de informática, produtos eletrônicos e ópticos (-6,5%).
Em termos de produtos, os impactos negativos mais importantes nesses ramos foram, respectivamente, açúcar cristal, VHP e refinado de cana-de-açúcar, tortas, bagaços, farelos e outros resíduos da extração do óleo de soja, carnes de bovinos frescas ou refrigeradas, farinha de trigo e carnes e miudezas de aves frescas ou refrigeradas; óleos combustíveis e álcool etílico; livros, brochuras ou impressos sob encomenda, CDs e impressos padronizados para uso comercial; serviços de manutenção e reparação de máquinas e equipamentos para usos industriais, de estruturas flutuantes e de máquinas motrizes não-elétricas; embarcações para transporte de pessoas ou cargas (inclusive petroleiros e plataformas), aviões, vagões de passageiros e para transporte de mercadorias e partes e peças para veículos ferroviários; e televisores, computadores pessoais portáteis (laptops, notebooks, tablets e semelhantes), transmissores ou receptores de telefonia celular, antenas e computadores pessoais de mesa.
Por outro lado, ainda na comparação com abril de 2018, entre os doze setores que apontaram ampliação na produção, as principais influências no total da indústria foram registradas por máquinas e equipamentos (4,4%), veículos automotores, reboques e carrocerias (1,9%), bebidas (5,2%) e produtos de metal (5,4%), impulsionados, em grande medida, pela maior produção de rolamentos de esferas, agulhas, cilindros ou roletes para equipamentos industriais, máquinas para o setor de celulose, empilhadeiras propulsoras, ventiladores e coifas para uso industrial (exaustores), silos metálicos para cereais e aparelhos de ar-condicionado de paredes e de janelas (inclusive os do tipo split system), no primeiro; de autopeças, reboques e semirreboques e automóveis, no segundo; de cervejas, chope e preparações em xarope para elaboração de bebidas para fins industriais, no terceiro; e de construções pré-fabricadas de metal, recipientes de ferro e aço para transporte ou armazenagem de gases, artefatos de alumínio para uso doméstico, aparelhos de barbear, estruturas de ferro e aço em chapas ou em outras formas, caldeiras geradoras de vapor e pontes e elementos de pontes de ferro e aço, no quarto.
Ainda no confronto com igual mês do ano anterior, bens intermediários (-6,1%) assinalou, em abril de 2019, o recuo mais acentuado entre as grandes categorias econômicas. Os setores produtores de bens de consumo semi e não-duráveis (-0,7%) e de bens de capital (-0,6%) também apontaram taxas negativas, mas que foram menos elevadas do que a média nacional (-3,9%). Por outro lado, o segmento de bens de consumo duráveis (1,2%) marcou o único resultado positivo nesse mês.
A produção de bens intermediários apontou redução de 6,1% em abril de 2019 frente a igual período do ano anterior, oitava taxa negativa consecutiva nesse tipo de comparação e a mais elevada desde outubro de 2016 (-7,2%). O resultado desse mês foi explicado, principalmente, pelos recuos nos produtos associados às atividades de indústrias extrativas (-24,0%), de produtos alimentícios (-12,9%), de coque, produtos derivados do petróleo e biocombustíveis (-2,0%), de produtos de borracha e de material plástico (-1,7%) e de celulose, papel e produtos de papel (-0,9%), enquanto as pressões positivas foram registradas por metalurgia (1,9%), veículos automotores, reboques e carrocerias (2,5%), produtos de metal (2,9%), outros produtos químicos (1,3%), produtos têxteis (4,6%), produtos de minerais não-metálicos (0,8%) e máquinas e equipamentos (0,4%). Ainda nessa categoria econômica, vale citar também os resultados positivos assinalados pelos grupamentos de insumos típicos para construção civil (0,4%), que voltou a crescer após recuar 4,1% em março último; e de embalagens (5,1%), que mostrou o quarto avanço seguido nesse tipo de comparação e que foi o mais acentuado dessa sequência.
O segmento de bens de consumo semi e não-duráveis, ao recuar 0,7% no índice mensal de abril de 2019, apontou o segundo resultado negativo seguido, mas com queda bem menos elevada do que a registrada no mês anterior (-5,3%). O desempenho nesse mês foi explicado principalmente pela queda verificada no grupamento de carburantes (-9,1%), influenciado pela menor fabricação de álcool etílico e gasolina automotiva. Vale citar também o resultado negativo assinalado pelo subsetor de não-duráveis (-2,2%), pressionado, em grande parte, pela redução na produção de livros, brochuras ou impressos sob encomenda e medicamentos. Por outro lado, os subsetores de alimentos e bebidas elaborados para consumo doméstico (1,5%) e de semiduráveis (1,6%) apontaram as taxas positivas nessa categoria, impulsionados, em grande medida, pela maior produção de cervejas, chope, sucos concentrados de frutas, carnes e miudezas de aves congeladas, produtos embutidos ou de salamaria e outras preparações de carnes, sorvetes e picolés, pães e massas alimentícias secas, no primeiro; e de calçados de material sintético feminino, conjuntos de uso feminino (de malha ou não), artefatos de alumínio para uso doméstico, calçados de plástico moldado feminino, camisas, blusas e semelhantes de uso feminino (de malha), camisetas de malha, calçados de borracha moldado e calças, bermudas, jardineiras, shorts e semelhantes de uso masculino (de malha ou não), no segundo.
O setor produtor de bens de capital, ao recuar 0,6% em abril de 2019, marcou o segundo resultado negativo consecutivo, mas com queda bem menos acentuada do que a verificada no mês anterior (-11,1%). Na formação do índice desse mês, o segmento foi influenciado, em grande parte, pelo recuo observado no grupamento de bens de capital para equipamentos de transporte (-2,9%), pressionado, principalmente, pela menor fabricação de embarcações para transporte de pessoas ou cargas (inclusive petroleiros e plataformas), veículos para o transporte de mercadorias, aviões, caminhões e vagões de passageiros e para transporte de mercadorias. As demais taxas negativas foram registradas por bens de capital de uso misto (-6,8%), para energia elétrica (-11,9%) e agrícolas (-8,8%). Por outro lado, os impactos positivos foram assinalados pelos grupamentos de bens de capital para fins industriais (8,1%) e para construção (5,3%).
O segmento de bens de consumo duráveis mostrou avanço de 1,2% em abril de 2019 frente a igual período do ano anterior, após recuar 15,5% em março último. Nesse mês, o setor foi particularmente impulsionado pelo crescimento na fabricação de eletrodomésticos da “linha branca” (9,8%) e de automóveis (1,3%). Vale citar também as expansões assinaladas por motocicletas (2,8%) e outros eletrodomésticos (12,6%). Por outro lado, os principais impactos negativos foram verificados em eletrodomésticos da “linha marrom” (-9,8%) e móveis (-2,1%).
Em 2019, Indústria acumula retração de 2,7%
No índice acumulado para janeiro-abril de 2019, frente a igual período do ano anterior, o setor industrial mostrou redução de 2,7%, com resultados negativos nas quatro grandes categorias econômicas, 19 dos 26 ramos, 52 dos 79 grupos e 56,0% dos 805 produtos pesquisados. Entre as atividades, indústrias extrativas (-11,8%) exerceu a maior influência negativa na formação da média da indústria, pressionada, em grande medida, pelos itens minérios de ferro e óleos brutos de petróleo. Vale destacar também as contribuições negativas assinaladas pelos ramos de produtos alimentícios (-2,4%), de equipamentos de informática, produtos eletrônicos e ópticos (-11,3%), de produtos farmoquímicos e farmacêuticos (-8,2%), de manutenção, reparação e instalação de máquinas e equipamentos (-9,8%), de outros equipamentos de transporte (-11,3%), de produtos de borracha e de material plástico (-3,2%), de impressão e reprodução de gravações (-15,7%), de produtos de madeira (-7,3%) e de celulose, papel e produtos de papel (-2,3%), influenciadas, principalmente, pelos itens açúcar VHP, cristal e refinado de cana-de-açúcar, sucos concentrados de laranja, tortas, bagaços, farelos e outros resíduos da extração do óleo de soja, óleo de soja em bruto, carnes e miudezas de aves frescas ou refrigeradas, farinha de trigo e carnes de bovinos frescas ou refrigeradas; televisores e computadores pessoais portáteis (laptops, notebooks, tablets e semelhantes); medicamentos; serviços de manutenção e reparação de máquinas e equipamentos para usos industriais, de estruturas flutuantes e de máquinas e equipamentos para prospecção e extração mineral; aviões, embarcações para transporte de pessoas ou cargas (inclusive petroleiros e plataformas) e vagões de passageiros e para transporte de mercadorias; peças e acessórios de plástico e de borracha para indústria automobilística, pneus novos para automóveis, artigos descartáveis de plástico, artigos de plástico para uso doméstico, tubos ou canos de plásticos para construção civil e conexões, juntas, cotovelos e outros acessórios de plástico para tubos; livros, brochuras ou impressos sob encomenda, CDs, rótulos adesivos de papel impressos, impressos para fins publicitários ou promocionais em papel e DVDs; madeira serrada, aplainada ou polida e painéis de fibras de madeira; e pastas químicas de madeira (celulose).
Por outro lado, entre as sete atividades que apontaram ampliação na produção, as principais influências no total da indústria foram registradas por bebidas (5,0%), coque, produtos derivados do petróleo e biocombustíveis (1,7%) e produtos de metal (5,3%), impulsionadas, em grande parte, pelos itens cervejas e chope, na primeira; óleo diesel, na segunda; e construções pré-fabricadas de metal, pontes e elementos de pontes de ferro e aço, recipientes de ferro e aço para transporte ou armazenagem de gases, aparelhos de barbear, artefatos de alumínio e de ferro e aço para uso doméstico, estruturas de ferro e aço em chapas ou em outras formas, revólveres e pistolas, caldeiras geradoras de vapor e artefatos diversos de ferro e aço trefilados, na terceira.
Em bases quadrimestrais, o setor industrial, ao recuar 2,7% nos quatro primeiros meses de 2019, intensificou a queda verificada no último quadrimestre de 2018 (-1,5%) e permaneceu com a clara perda de ritmo iniciada no primeiro quadrimestre de 2018 (4,4%), todas as comparações contra igual período do ano anterior. A redução na intensidade da produção industrial também foi observada em três das quatro grandes categorias econômicas, com destaque para bens de capital, que passou de 3,5% no último quadrimestre de 2018 para -3,1% no período janeiro-abril de 2019, pressionada, em grande parte, pela menor fabricação de bens de capital para equipamentos de transporte (de 8,0% para -3,8%) e agrícolas (de 23,6% para -5,1%). Os setores produtores de bens intermediários (de -2,0% para -3,1%) e de bens de consumo semi e não-duráveis (de -1,2% para -1,3%) também fizeram esse movimento entre os dois períodos, enquanto o segmento de bens de consumo duráveis (de -2,9% para -2,2%) foi o único que mostrou redução na magnitude de perda.
Produção industrial tem leve alta em abril, mas acumula queda de 2,7% no ano. Produção da indústria extrativa cai 9,7% em abril e tem o quarto mês negativo no ano
A produção da indústria nacional cresceu 0,3% em abril, na comparação com março, porém o setor ainda acumula queda de 2,7% nos quatro primeiros meses do ano, segundo a Pesquisa Industrial Mensal, divulgada hoje pelo IBGE. Na comparação com abril do ano passado, a indústria caiu 3,9%. Com esses resultados, a produção está 17,3% abaixo do nível recorde alcançado em maio de 2011.
A maior influência negativa partiu do setor extrativo, pressionado pela redução na produção de minério de ferro, decorrente do rompimento da barragem em Brumadinho (MG), em janeiro. Com isso, a indústria extrativa caiu 9,7%, e teve o quarto resultado negativo seguido na comparação com o mês anterior, acumulando -25,7% no ano. Em relação a abril de 2018, o recuo foi de 24%.
“Há um efeito de queda em sequência do setor por conta de Brumadinho, e isso vem trazendo impactos negativos na indústria como um todo”, explica o gerente da pesquisa, André Macedo, complementado que o crescimento na indústria geral seria de 1,2% se o setor extrativo não fosse considerado na pesquisa.
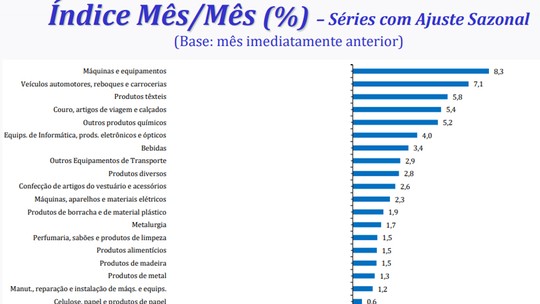
Produção industrial (mês/mês anterior)
Clique e arraste para zoom
Fonte: IBGE - Pesquisa Industrial Mensal - Produção Física
Ante março, houve crescimento em 20 das 26 atividades pesquisadas, o resultado mais disseminado para o setor industrial desde junho de 2018, quando 22 das 26 atividades tiveram alta. “Isso em um mês após a intensa queda promovida pela greve dos caminhoneiros. A indústria havia crescido 12,5% em junho do ano passado”, relembra Macedo.
Entre as altas na passagem de março para abril, destaque para o crescimento de 7,1% em veículos, 8,3% em máquinas e equipamentos, 5,2% em produtos químicos e 1,5% em alimentos. Esses setores reverteram os resultados negativos de março.
“Veículos automotores vêm mostrando um comportamento de maior volatilidade, em função de uma demanda doméstica que não consegue acompanhar essa produção. Ainda há a crise na Argentina afetando as exportações desse setor, então se regula a produção para atender a demanda”, diz Macedo.
A ligeira alta de abril foi influenciada pelos resultados positivos em três das quatro grandes categorias econômicas em relação a março. Houve altas de 3,4% em bens de consumo duráveis, 2,9% em bens de capital e de 2,6% em bens de consumo semi e não duráveis. Já o setor de bens intermediários caiu 1,4%, a quarta queda seguida, acumulando -4,2% nesse período.
Sobre a indústria de transformação como um todo, Macedo diz que há uma constante que contribui para justificar a queda do setor industrial no ano. “São fatores que a gente já comenta para o setor industrial, associados à demanda em ritmo menor e à taxa de desocupação do mercado de trabalho”.
DOCUMENTO: https://agenciadenoticias.ibge.gov.br/agencia-sala-de-imprensa/2013-agencia-de-noticias/releases/24726-em-abril-producao-industrial-varia-0-3
CNI. PORTAL G1. 03/06/2019. Atividade industrial cresce 1,1% em abril, informa CNI. No mesmo período, nível de uso do parque fabril subiu para 77,8%, maior patamar desde agosto do ano passado. Segundo a entidade, emprego industrial ficou estável em abril.
A Confederação Nacional da Indústria (CNI) informou nesta segunda-feira (3), com base em indicadores industriais, que as horas trabalhadas na produção industrial cresceram 1,1% em abril em comparação com o mês de março.
Neste mesmo período, a utilização da capacidade instalada (nível de uso do parque fabril) subiu 0,6 ponto percentual e atingiu 77,8%, o maior índice desde agosto de 2018, após ajuste sazonal.
"As horas trabalhadas na produção [indicador do nível de atividade] estão oscilando desde o fim de 2017 e mostram uma leve tendência de alta desde o fim do ano passado", observou a entidade.
Faturamento
O faturamento da indústria, por sua vez, teve alta de 3,3% em abril ante março, nas séries sem influências sazonais. Apesar do aumento, não se conseguiu reverter a queda de 4,9% em março na comparação com fevereiro, acrescentou a CNI.
Já o emprego na indústria cresceu 0,1% em abril frente a março, na série livre de influências sazonais. A entidade avaliou que o emprego continua estável, com pequenas oscilações, desde março de 2017, quando terminou uma longa trajetória de queda no indicador.
A massa salarial dos trabalhadores do setor aumentou 0,5% em abril, contra o mês anterior, e o rendimento médio do trabalhador cresceu 0,9% em abril ante março, nas séries livres de influências sazonais.
"Enquanto o índice de massa salarial vinha de três quedas consecutivas, com recuo acumulado de 3,9%, o rendimento cresce pelo segundo mês consecutivo. Apesar da alta, o indicador vem de uma trajetória de retração ao longo de 2018", concluiu a Confederação Nacional da Indústria.
COMÉRCIO EXTERIOR BRASILEIRO
MEconomia. 03/06/2019. Balança comercial. Exportações brasileiras crescem 5,6% em maio
Importações tiveram crescimento de 7,8% no mês, indicando melhora da atividade econômica
O secretário de Comércio Exterior substituto do Ministério da Economia, Herlon Brandão, comentou nesta segunda-feira (3/6), em entrevista coletiva, os resultados da balança comercial de maio de 2019. “Tivemos crescimento da corrente de comércio, que é a soma das exportações e das importações, e isso sinaliza uma melhora da atividade econômica, ao contrário do que vinha acontecendo nos últimos meses com as vendas externas em queda’, afirmou Brandão.
Em maio de 2019, a exportação alcançou US$ 21,394 bilhões. Em relação a maio de 2018, as vendas externas brasileiras tiveram crescimento de 5,6%; e em relação a abril de 2019, o aumento foi de 3,7%, pela média diária.
As importações em maio último totalizaram US$ 14,972 bilhões. Sobre o mesmo período de 2018, as compras brasileiras no exterior tiveram crescimento de 7,8%, e de 4,9% sobre abril de 2019, também pela média diária.
Assim, a corrente de comércio, que é a soma de exportações e importações, foi de US$ 36,366 bilhões no período, o que representa um acréscimo de 6,5%, em relação a maio de 2018. Já o saldo comercial do mês teve superávit de US$ 6,422 bilhões, valor 0,9% superior, pela média diária, ao alcançado em igual período de 2018 (US$ 6,073 bilhões).

No acumulado do ano, as exportações já chegam a US$ 93,543 bilhões, com queda de 1,1%, pela média diária, em relação aos cinco primeiros meses do ano passado.
De acordo com Herlon Brandão, a pequena redução da exportação de janeiro a maio deste ano foi motivada pela queda dos preços internacionais, já que as quantidades exportadas foram maiores. Cresceram em quantidade as exportações de petróleo, minério de ferro e carnes, por exemplo.
As importações, nos cinco primeiros meses de 2019, somaram US$ 70,737 bilhões. Houve aumento de 0,8%, pela média diária, sobre o mesmo período anterior (US$ 69,476 bilhões).
Já a corrente de comércio alcançou US$ 164,280 bilhões, representando queda de 0,3% sobre o mesmo período anterior, pela média diária, quando totalizou US$ 163,189 bilhões.
O saldo comercial está superavitário em US$ 22,806 bilhões, valor 6,8% inferior, pela média diária, ao alcançado em igual período de 2018 (US$ 24,237 bilhões)
Segundo Brandão, o pequeno aumento das importações foi reflexo da compra em maior quantidade de combustíveis, insumos, além de adubos e fertilizantes. “Cerca de 80% das nossas importações são referentes a insumos e outros bens ligados à atividade produtiva”, explicou o secretário de Comércio exterior substituto.
Compradores
Em relação aos mercados compradores de produtos brasileiros, um dos principais destaques de maio foram os EUA. As vendas brasileiras para aquele mercado cresceram 60% em relação a maio de 2018; e 18% em relação aos cinco primeiros meses do ano passado.
“A relação comercial do Brasil com os EUA é muito forte. Os EUA são o maior destino dos bens industrializados que o Brasil produz. Exportamos para eles, principalmente, siderúrgicos, combustíveis, aviões e peças para aviões”, explicou Brandão.
Em maio, as importações brasileiras dos EUA também aumentaram 25%, principalmente, por conta de motores e geradores elétricos, gasolina e combustíveis, já que o país é o maior fornecedor externo do produto ao Brasil.
MERCADO DE CAPITAIS
MEconomia. 03/06/2019. Ministério da Economia lança grupo para intensificar o mercado de capitais. Financiamento. Modelo dará sequência ao trabalho realizado em 2018 pelo GTMK
Para dar sequência nas discussões de medidas com o mercado privado e potencializar as ações construídas ao longo de 2018 pelo Grupo de Trabalho sobre Mercado de Capitais e Poupança a Longo Prazo (GTMK), o Ministério da Economia (ME) lançou nesta segunda-feira (3/6), a Iniciativa Mercado de Capitais (IMK), em evento realizado na sede do Banco Central (BC), em São Paulo.
Desenhado em moldes semelhantes ao extinto GTMK, a nova iniciativa será desenvolvida em conjunto pelo Ministério da Economia, Banco Central, Comissão de Valores Mobiliários (CVM) e Superintendência de Seguros Privados (Susep). "O GTMK completou um ciclo e suas ações, agora, podem ser potencializadas. Partimos para uma nova iniciativa, muito bem-vinda ", explicou o secretário especial de Fazenda, Waldery Rodrigues Júnior, durante o lançamento.
De acordo com ele, somente na Secretaria Especial de Fazenda há cerca de 30 medidas em formulação para impulsionar a economia. "O mercado de capitais no Brasil está bem aquém do potencial da economia do país. Há um baixíssimo nível de poupança e houve má alocação de recursos no passado", salientou. Ele informou ainda que o governo já começou a combater esses problemas, por exemplo, solicitando a devolução de recursos dos bancos públicos ao Tesouro Nacional.
Produtos do GTMK 2018
Waldery Rodrigues destacou que o GTMK teve o mérito de implementar medidas e deixar outras em condições de serem implantadas em 2019. Como exemplo destas, citou as mudanças na lei das empresas S/A para favorecer o financiamento de pequenas e médias empresas – medida incluída na MP da Liberdade Econômica; e a alteração da legislação de debêntures incentivadas, com o objetivo de ampliar o nível de financiamento em infraestrutura, a ser incluída em Projeto de Lei em fase de finalização.
Ainda no balanço dos produtos herdados do GTMK, o secretário citou o "fast track" para debêntures incentivadas com benefícios socioambientais . "Parafraseando o ministro Paulo Guedes, temos pouco tempo para acertar, por isso precisamos de medidas rápidas e de alta eficiência", observou.
Desburocratizar o mercado
Para o presidente do BC, Roberto Campos Neto, é preciso desburocratizar o mercado financeiro para que todos possam ter acesso. "Essa modernização trará reflexos positivos no crescimento de longo prazo da economia brasileira", apontou.
Também presente ao lançamento, o secretário de Política Econômica do Ministério da Economia, Adolfo Sachsida, apontou a importância das medidas microeconômicas para resolver o problema de produtividade que atinge o país há mais de três décadas.
"O primeiro problema do Brasil é fiscal e está sendo endereçado pela Nova Previdência”, afirmou. “O segundo, de produtividade, depende de iniciativas como a de hoje. Combater a má alocação de recursos, diminuindo distorções de mercado, é fundamental para o crescimento de longo prazo".
Novas medidas
A nova pauta apresentada pelo GT focará no aperfeiçoamento do sistema regulatório das Fintechs (empresas inovadoras que trabalham com sistema financeiro), por meio do sandbox – modelo em que as autoridades financeiras concedem autorizações temporárias e dispensas de regras às empresas que desenvolvam projetos inovadores, mediante o cumprimento de critérios e limites previamente pactuados. O objetivo é desenvolver as inovações sem perder de vista a segurança dos consumidores e a integridade do mercado.
Nos próximos dias, será publicado um comunicado conjunto, envolvendo Ministério da Economia, BC, CVM e Susep, com princípios para um modelo de sandbox regulatório brasileiro. Nesse documento, haverá um compromisso entre os reguladores de desenvolver mecanismos de cooperação para projetos inovadores que envolvam atividades regulamentadas por mais de uma autoridade financeira.
O grupo também informou que entrará no debate a regulamentação da Nota Comercial (criada pela Lei 10.303/2001), estabelecendo um arcabouço jurídico próprio que as diferencie das notas promissórias.
Atualmente, por não contarem com disciplina própria no ordenamento jurídico do país, a CVM vem entendendo que as notas comerciais se aplicam ao regime das notas promissórias. Entretanto, as promissórias devem ser emitidas sob a forma cartular, o que é de difícil compatibilização com a dinâmica do mercado de capitais.
A hipoteca reversa, apresentada no mês de abril pelo Ministério da Economia, também estará no foco do novo GTMK.
Participaram ainda da abertura do evento, a superintendente da Susep, Solange Paiva Vieira, o presidente da CVM, Marcelo Santos Barbosa, e o presidente da Associação Brasileira das Entidades dos Mercados Financeiros e de Capitais (Anbima), Carlos Ambrósio.
ENERGIA
ANP. 03 de Junho de 2019. Produção de petróleo e gás em abril cresce em relação a março e a 2018
Tanto a produção de petróleo quanto a de gás no Brasil cresceram, em abril, pela segunda vez consecutiva, em comparação com março e com o mesmo mês de 2018. Somadas, totalizaram 3,314 de milhões de barris de óleo equivalente por dia (boe/d).
Em abril, a produção de petróleo foi de 2,604 milhões de barris por dia (bbl/d), com um aumento de 1,7% em relação a março e de 0,3% se comparada com o mesmo mês do ano anterior. A produção de gás natural chegou 113 milhões de metros cúbicos por dia (m³/d), um incremento de 1,3% em relação ao mês anterior e de 3,8% se comparada ao mesmo mês no ano passado.
Os dados de produção de abril estão disponíveis na página do Boletim Mensal da Produção de Petróleo e Gás Natural.
Pré-sal
A produção do pré-sal aproximou-se um pouco mais dos 60% da produção nacional total, chegando a 59,8%, contra 59,4% no mês anterior. Cresceu, em abril, 2,3% em relação ao mês anterior e 10,9% na comparação com o mesmo mês de 2018. É a segunda vez consecutiva que a produção do pré-sal cresce mais de 10% em relação ao mesmo período de 2018. Em março, o aumento foi de 11%.
Em abril, a produção, oriunda de 94 poços, foi de 1,572 milhões de barris de petróleo por dia (bbl/d) e de 64,9 milhões de metros cúbicos de gás natural por dia (m³/d). O total foi de 1,980 milhão de barris de óleo equivalente por dia (boe/d).
Aproveitamento do gás natural
O aproveitamento do gás natural em abril manteve-se estável em relação a março, correspondendo a 94,7% do total produzido. Foram disponibilizados ao mercado 55,3 milhões de metros cúbicos por dia (m³/dia). A queima de gás aumentou 2,8% se comparada com o mês anterior, e 76,5% se comparada ao mesmo mês de 2018.
A queima de gás totalizou 6,0 milhões de metros cúbicos por dia (m³/d). A principal justificativa para o aumento em abril foi a continuidade dos comissionamentos das plataformas FPSO P-76 e P-77, ambas localizadas no campo de Búzios.
Campos produtores
O campo de Lula, na Bacia de Santos, foi o que mais produziu petróleo e gás, com uma média de 873 mil de barris de petróleo por dia (bbl/d) e de 37,2 milhões de metros cúbicos de gás natural por dia (m³/dia).
Origem da produção
Os campos marítimos produziram 96,0% do petróleo e 83,1% do gás natural. Os campos operados pela Petrobras produziram 94,6% do petróleo e do gás natural. A produção nacional ocorreu em 7.186 poços, sendo 671 marítimos e 6.515 terrestres.
Destaques
Estreito, na Bacia Potiguar, teve o maior número de poços produtores: 1.117. Marlim Sul, na Bacia de Campos, foi o campo marítimo com maior número de poços produtores: 72.
Da Plataforma FPSO Cidade de Maricá, produzindo no Campo de Lula por meio de sete poços a ela interligados, foram extraídos 148,2 mil barris por dia (bbl/d) e foi a instalação com maior produção de petróleo.
A instalação Polo Arara, nos Campos de Arara Azul, Araracanga, Carapanaúba, Cupiúba, Rio Urucu e Sudoeste Urucu, produziu 8,9 milhões de metros cúbicos por dia (m³/d), por meio de 38 poços a ela interligados, e foi a instalação com maior produção de gás natural.
Campos de Acumulações Marginais
Esses campos produziram 69,6 barris de petróleo por dia (bbl/d) e 6,6 mil metros cúbicos de gás natural por dia (m³/d). O Campo de Iraí, operado pela Petroborn, foi o maior produtor com 38,9 barris de óleo equivalente por dia boe/d.
Outras informações
Em abril de 2019, 306 áreas concedidas, duas áreas de cessão onerosa e cinco de partilha, operadas por 34 empresas, foram responsáveis pela produção nacional. Destas, 79 são marítimas e 234 terrestres. Do total das áreas produtoras, 12 são relativas a contratos de áreas contendo Acumulações Marginais.
O grau API médio foi de 27,6 sendo 37,8 % da produção considerada óleo leve (>=31°API), 52,1 % óleo médio (>=22 API e <31 10="" api="" e="" leo="" p="" pesado="">
As bacias maduras terrestres (campos/testes de longa duração das bacias do Espírito Santo, Potiguar, Recôncavo, Sergipe e Alagoas) produziram 107,7 mil barris de óleo equivalente por dia (boe/d), sendo 84,6 mil barris por dia (bbl/d) de petróleo e 3,7 milhões de metros cúbicos por dia (m³/d) de gás natural. Desse total, 100,8 mil barris de óleo equivalente por dia (boe/d) foram produzidos pela Petrobras e 6,9 mil barris de óleo equivalente por dia (boe/d), por concessões não operadas pela Petrobras, dos quais: 372 boe/d em Alagoas, 3.578 boe/d na Bahia, 27 boe/d no Espírito Santo, 2.725 boe/d no Rio Grande do Norte e 205 boe/d em Sergipe.
________________
LGCJ.: