US ECONOMICS
CHINA
U.S. Department of State. 06/18/2020. Briefing with Assistant Secretary for East Asian and Pacific Affairs David Stilwell On Readout of Secretary Pompeo’s Meeting With Poliburo Member Yang Jiechi. David R. Stilwell, Assistant SecretaryBureau of East Asian and Pacific Affairs. Via Teleconference
MS ORTAGUS: Apologies, everybody, for the late afternoon notice. Dave Stilwell is still in Hawaii, I’m in California with the Secretary, but we wanted to make sure that you had a chance today to hear directly and on the record from Assistant Secretary Dave Stilwell on Secretary Pompeo’s meeting yesterday with Chinese Communist Party Politburo Member Yang Jiechi.
As you know, Assistant Secretary Stilwell was a part of the Secretary’s delegation in Hawaii for this important exchange of views on U.S.-China relations. Assistant Secretary Stilwell will offer brief opening remarks and answer your questions. Please remember that while this call is on the record, the briefing – the contents of the briefing – is embargoed until the end of the call. And again, please keep your line muted if you’re not called upon. Okay, Dave, go right ahead.
ASSISTANT SECRETARY STILWELL: Morgan, thank you for that. And it was a great trip to Hawaii, and I know we did our best to get something out of it. I’m not going to go into specifics on exactly what was discussed, although I note that the Ministry of Foreign Affairs has done just that. And I don’t feel the need to argue with Zhao Lijian on that, but I will give you as much as diplomatic decorum allows – the ideas, the back and forth, and the outcomes from what we just accomplished in the last two days in Hawaii.
Overall, given all the current circumstances with the relationship, the PRC side could not be described as really forthcoming in this. The U.S. side went to great effort to provide an environment for candid and productive discussions.
As you know, the U.S. seeks a constructive and results-oriented relationship that is fair and reciprocal, and we’ve been very clear about that. That implies not just conversations, but we have to have actions. The actions that we’ve seen out of the PRC of late – and you all know this as you watch the beat – have been not really constructive as we look at India, the South China Sea, Hong Kong issues, and just go around the perimeter. In the periphery (inaudible) things like trade have not lived up to the billing, unfortunately.
So as we try to deal with these topics of concern, we need to make sure we take advantage of all opportunities to come to an agreement where we can and to work through those issues that we don’t necessarily agree on at the time. So I leave it to you to – I’m not going to go into detail on exactly what was discussed, but whether or not they were productive or not, I will look at what comes up in the next couple of weeks: Do we see a reduction in aggressive behavior or not? That’s not to say that we didn’t try, but as you know, in any relationship both sides get a vote on these things.
So we are working hard. As you know, the President is not pulling punches anymore. He is basically doing what he has to do to protect U.S. interests, starting off with obviously the trade deal and the (inaudible) following through on that. But in areas of mutual concern, such as North Korea, we note the issues going on there right now. We would like to have somewhere we can find cooperation. We also are looking for their positive engagement in trilateral arms talks. China is a nuclear power, as are Russia and the U.S., and it would be good to – we encourage them and we’d like them to participate in these talks that prevent the – an unfortunate outcome.
And obviously corona. We insist on the Chinese disclosing all they know about how this pandemic began, to share all the information that they have that leads to saving lives. This is not about saving face; it’s about saving lives. And we insist that they live up to their agreements with the WHO and with the international health regulations to make open as – show (inaudibe) this is beyond politics.
And so we have to understand and assess that as I talk about a constructive and results-oriented relationship that the words are fine but will be judged by the deeds. And if we have words of peace but we have aggressive actions, then we’re going to have to increase the pressure to manage that.
And the best way we do that is not just the U.S. alone. This is not a U.S.-China event. It’s not a U.S.-China issue. This is China versus lots of others. We just saw a very strong G7 statement on Hong Kong that demonstrates that it’s the world that’s concerned with this behavior. And so the objective of these talks was to help the Chinese Government understand that their actions are actually working against them and that if they come to the table with a reasonable proposal, the U.S. is obviously going to greet it reasonably and look for ways to work toward a positive outcome.
I’ll quit there and look forward to your questions.
MR HARUTUNIAN: Okay, the first question is from the line of Shaun Tandon. And if I could remind everyone to mute their line if you’re not speaking. Thank you.
QUESTION: Hi, thanks for doing this. Could I expand just on the last point that you made, to say that if they have reasonable proposals that you’ll treat it reasonably. Were the proposals that were put forward by the Chinese – do you think that there’s anything actually constructive that came out of this? And how much of this do you think was in the election context with the – how Americans are talking about China right now ahead of the elections? Is that something that the Chinese raised? Is that something that was discussed? Thanks.
ASSISTANT SECRETARY STILWELL: Yes, good question. You can’t get away from the – our own domestic politics and the election on this. It clearly is in view in Beijing. They are talking about it. As far as reasonable proposals, again, I can’t get into details, but as I mentioned, some of the main topics that are bubbling with – in the South China Sea. We all know the U.S. position on freedom of navigation and excessive claims. How about a reasonable proposal to go back to an agreement in 1997 that says that China will allow Hong Kong – agreed to have autonomy for 50 years, and that terminating that at 23, that’s unreasonable.
And so we discussed all of that, and as I mentioned that we look for not just words but deeds and follow-up. We are looking forward to reconsideration of the domestic security legislation, national security legislation that they are imposing on Hong Kong. And the results of that are going to be similar to what we saw last summer, I believe, with the attempt to impose an extradition law on Hong Kong. The people of Hong Kong have a voice and they will use it, and they till now have had a choice that they could exercise in their two-systems setup that allowed for democratic processes. And so as they see those processes, they see that freedom and that democracy go away, they can’t help but express their concerns. Over.
MR HARUTUNIAN: Next question is from the line of —
QUESTION: (Inaudible.)
MR HARUTUNIAN: I’m sorry, please mute your line if you’re not speaking. The next question is from the line of Will Mauldin, Wall Street Journal.
QUESTION: Hi, thank you so much for having this. I was just following up because you mentioned a lack of reasonable proposals from the Chinese side. Does that mean there were no reasonable proposals on any major areas of dispute between the two countries? And if that’s the case, does that mean there was no substantial progress to speak of in any area that’s of major disagreement between the two countries? How would you phrase that? Thank you.
ASSISTANT SECRETARY STILWELL: Well, what I would say is that the U.S. position on these things has been clear to date, and it will – it was made very clear during the meeting – again, things like corona, North Korea, something as important as trilateral arms cooperation, and the like. And there is no misunderstanding of what the U.S. is asking, and as I said earlier, it’s not just the U.S. With the G7 and others, there are others, not just the U.S. – Australia being an obvious one – who are expressing the same concerns, and that should trigger in the minds of the folks in Beijing the need to reassess the direction they’re going.
Our position on this has been consistent, and so any – as you saw – as you may have seen in the MFA statement where they kind of read out a very one-sided proposal – or one-sided readout of what we talked about. We’re going to do our best to leave the diplomatic process to its own devices, but I would expect that you would see the Chinese side taking action that comports with the discussions we had. I’m not saying there was agreement, but we made very clear our position, so we’ll see in the next week or two or however long it takes if they begin to live up to their commitments. Over.
QUESTION: So it’s unclear if there was any significant progress in any of the major areas?
ASSISTANT SECRETARY STILWELL: I would – I mean, I’ll refrain from characterizing it that way. Yeah.
MR HARUTUNIAN: If we could refrain from follow-up questions just to allow everybody to ask a question, I’d appreciate it. Next question from the line of Nike Ching.
QUESTION: Thank you very much for the call. How do you describe the trust level between the U.S. and Chinese top diplomats? And you mentioned South China Sea. At a time when China is intensifying the frequency and sending aircraft carriers in the Indo-Pacific region and a time when Chinese military planes are intensifying the frequency to enter Taiwan’s airspace, in your view, what is the Chinese calculation? Thank you.
ASSISTANT SECRETARY STILWELL: The relationships between counterparts – my counterparts, the Secretary’s counterparts – are developed. I mean, the U.S. can’t be accused of not investing significant effort in making sure this relationship has the opportunity to be productive.
But again, the other side gets a choice in how they operate, and trust is a function of words and deeds. You have to have – obviously, you say the right things, but the deeds are zero in an equation where words times deeds equals trust, but the deeds, if the follow-through is not there, if, as in 2015, the Chinese leadership says that they don’t – they’re not going to militarize the islands of the South China Sea and they go and do that, I think, again, you don’t have to be a math major to understand that that is not conducive to trust. Subsequent interactions with the Chinese, especially with the Secretary and at my level and others – again, we get commitments and yet – I won’t say always, but frequently those commitments either are not – we don’t see follow-through, or if we do see follow-through, it’s limited and not necessarily of use.
As far as South China Sea militarization, sinking fishing ships and more provocative behavior around Taiwan, hard to say given all that’s going on, given how the world is struggling with corona, why anybody would take advantage of that or try to take advantage of that. Although I would note that Taiwan’s handling of the coronavirus was laudable, it was world-class. In fact, they knew long before anybody that there should be deep concern about any reports of that sort of epidemic inside China. So they were the first to close their borders and then start actively looking for signs of the pandemic.
And so – but meantime, the world is still reeling from this problem, and I don’t see how this would inspire a green light toward more provocative behavior. I mean, India is trying to focus on dealing with the disease. That doesn’t mean, though, that – certainly, it doesn’t mean the U.S. is distracted. You’re seeing activities from INDOPACOM and others that demonstrate that, no, we’re still as capable as we ever were. Over.
MR HARUTUNIAN: Next question is from the line of Nick Schifrin.
Nick, go ahead.
MR BROWN: He might be on mute.
MR HARUTUNIAN: Okay. Let’s skip Nick for the minute. Next question, Matt Lee.
QUESTION: Hi there, thanks. You mentioned that the Chinese readout was very one-sided, and I just got to ask: I mean, what do you expect them to do? I mean, this is your opportunity now to give your side. So what do you think was one-sided about their readout, being as specific as you possibly can? Or are you going to let them drive the narrative on specific?
And then my substantive question is: The Secretary tweeted a couple hours ago that Yang had recommitted to Phase 1 of the trade deal, but then the President just tweeted a little while ago saying that complete decoupling from China is still a possibility. And I’m just wondering, if you can’t reconcile those two or don’t want to take a stab at reconciling those two, just what exactly was the Secretary meaning when he said that the Chinese had recommitted? And do you expect them to actually do that? Thank you.
ASSISTANT SECRETARY STILWELL: That’s a good question. MFA statement – if you haven’t seen it, take a look at it. Obviously, the time I’m spending with you all is longer than that. But as I opened with, diplomatic conversations are effective when they – the details of those conversations are left soft or quiet, and that it gives everybody room to adjust, right, rather than cornering one side and enforcing them to either take unhelpful or unwanted actions or no action at all.
Again, I’m not telling you anything you don’t know. You sit in the State Department press bullpen. But allowing diplomacy to take its course is good, while at the same time, though, I believe in the spirit of openness that I would – I appreciate your chance to share with you the need – or the outcomes of these events so you can generally track what’s happened.
So, however, as I look at the MFA statement, it’s fairly typical with what we’ve been seeing in this wolf warrior environment – very shrill, one-sided, sometimes not realistic, and all the rest. So again, look at the – I will try my best to share as much as I can. I’m not going to go to the level of detail he did.
As far as the difference between what the Secretary and the President are saying, I’ll just note that the trade deal – the Chinese have recommitted to that numerous times, not just in the recent past, but since the last year when it was signed, and they insist that they will follow through. This is a good acid test to see if they will be cooperative partners; if they will, again, use words and deeds to build this trust in the trade realm, which I think is probably the most basic aspect of this relationship, because, as you know, trade, when done properly, benefits both sides equally.
Now, if you put up barriers and those things at – which is what we’re working through that certainly don’t comport with WTO and a global trade system, that’s where you end up having to have these trade talks to reinforce the need for it to be fair and even.
So again, I can’t really speculate on the difference between the S and the POTUS remarks, just note that we have seen a consistent commitment by the Chinese side to live up to its agreement. Over.
MR HARUTUNIAN: Back to Nick Schifrin.
QUESTION: Hey, Dave. Sorry about that, guys. I apologize. And I’m sorry, because I got kicked off, if I ask a question that’s already been asked. But two quick ones, hopefully.
One is: Both sides are saying that the other side asked for the meeting. Assuming that you’re maintaining that the Chinese asked for the meeting, did they have any kind of opening offers at all?
And then two, on the media reports of what we’re all covering right now in terms of Ambassador Bolton, there is a dichotomy between policy on things like Xinjiang and what Bolton quotes the President saying about leaders in Xinjiang. Does that dichotomy hurt your —
MS ORTAGUS: Hey, we’re not going to even hear the – we’re not going to – Nick, we’re not going to get into the Bolton stuff. He’s not going to answer that. So you can ask another question, or we can go to the next person.
QUESTION: Okay. Well, I asked about the origin of the meeting, so are you maintaining that they requested the meeting, and given that, did they have any kind of opening offer at all?
ASSISTANT SECRETARY STILWELL: Thanks, Nick, and yeah, always good to hear from you. We did an event like this last August. It was in the media as well. Just a short blurb came out of that, as far as the nature.
Again, and this is not about one-upmanship or – I’m proud to be part of a diplomatic tradition where we don’t really feel the need to kiss and tell and the rest. But I will note that the activities happened here. So as far as who asked who, again, I’d – not going to – I mean, I could offer you in another setting or elsewhere the – how this went down, but the point is that the Secretary traveled and went to great effort to host and to hear their proposals, and you can imagine which side is feeling the pressure more. Over.
MR HARUTUNIAN: Next question, John Hudson.
QUESTION: Hi, thanks a lot. You mentioned that the Chinese were not forthcoming. Could you just talk a little bit about what you – how you were disappointed in their not being forthcoming? And then what were they not forthcoming about?
ASSISTANT SECRETARY STILWELL: Well, I would go back to the actions in a results-oriented relationship, and this is one of our – I’m not going to answer the question right now. However, if you watch outcomes over the next couple weeks, you can see for yourself whether U.S. concerns – which have been expressed very publicly, not just this week in Hawaii but over the weeks coming out of D.C. – about this provocative behavior, and then just a long list of things: How about reciprocity? How about journalists who can’t report freely in the PRC and yet complain shrilly when they – or anything is done to Chinese journalists in the U.S.? The relationship needs to be more reciprocal. And we raised quite a few of these issues, and I’ll leave it to you to determine whether or not they are going to comply or not. Just watch the outcomes here in the next couple weeks and see.
I’m hopeful. Again, as I – we leave diplomatic space by not talking about this in detail where they feel like they’re boxed in. We leave them the diplomatic space to make decisions that demonstrate that they understand the need for this relationship to be more reciprocal and “win-win,” to use their term, on both sides. And so I always remain optimistic. I am often disappointed, but again, we’ll see if the presentation – if our interactions this week had the desired effect. Over.
MR HARUTUNIAN: Michele Kelemen, NPR.
QUESTION: Hi, thanks. How would you describe the atmosphere of the talks? And did they talk at all about plans for U.S. personnel to return to the embassy in Beijing and to consulates in China? I’ve heard concerns that U.S. Government officials have had to go through quarantine procedures that are – that the Chinese are imposing on them. Thanks.
ASSISTANT SECRETARY STILWELL: Well, we’ve been out of China for a long time, and the folks that are left there have been really doing a lot of great work to make sure that our diplomatic activities remain the same. And yeah, we are doing our best to get folks back and reconstitute now.
I would note that the – that we’re seeing another bloom of corona in Beijing, and so I’ve got to say I would hope that their numbers and their reporting is more accurate than what we saw in the case of Wuhan and other places in the PRC, but that remains to be seen. Our folks are trained well – like we are all here – as far as maintaining social distance and handwashing and mask wear and all that stuff.
But yep, brave diplomats are going to go back into the fray there and re-establish our presence there as quickly as we can. What was the first part of that?
QUESTION: Oh, sorry, I had my mute on. It was about the atmosphere of the talks in Hawaii.
ASSISTANT SECRETARY STILWELL: Yeah. I’ll just simply note that the overall – describe the relationship overall as intense, and it – this is terra incognita for the Chinese. They never had an American government actually stand up and insist that they follow through on their commitments. And so that’s probably a fair characterization, is they’re getting used to a U.S. Government that will, again, insist on defending the interests of the American people.
MR HARUTUNIAN: Nick Wadhams.
QUESTION: Hi, thanks very much. Can you talk a little bit more about – I understand you don’t want to say who initiated this meeting or who requested it, but there is that fundamental contradiction out there, and can you just give us a sense of how this whole thing —
MS ORTAGUS: No.
QUESTION: — came about?
MS ORTAGUS: It’s asked – no, Nick, that’s asked and answered. Why don’t you try for a different question?
QUESTION: Okay. Did they – did the Chinese give you any indication or any – do you believe now that Chinese coronavirus numbers continue to be underrepresented, both currently and in the past, in terms of number of infections? And did you make any progress or are you feeling more optimistic now about the possibility that you’ll get access to the virus samples, to the labs, and things like that that you’ve requested in the past?
ASSISTANT SECRETARY STILWELL: Thanks, that’s a good question. Optimistic or not, we definitely made our position known, again, on what we expect. And not just the U.S., it’s everybody. This is part of a trend of agreeing to things that are in the interest of global security and global health, agreeing to those and yet not finding a way to follow through on them. It’s happened a number of times. So as far as numbers, it would be good to have folks on the ground to do confirmation. Now, you must understand the difficulty in that. You’ve got a raging epidemic and then later pandemic in Wuhan, in Hubei Province, and who knows where else. But that transparency and the relative secretive nature of the Chinese Communist Party did not allow for confirmation. This would have been very important in giving the world all the advance notice it needed to defend itself from what turned out to be a really nasty disease. So we still insist on transparency, sharing samples and all the rest.
But back to your question on numbers. Credibility is important, and once you lose credibility it’s very difficult to get it back. So I believe that any numbers you see after – I mean, you saw some very credible non-politicized assessments coming out of scientific journals and all that noting that the numbers reported out of the PRC were impossible. They were impossibly low and they were impossibly linear, and so – I’ve seen estimates of somewhere around 10 times. It claimed 80,000 infections, initially 3,500 deaths, which they upgraded to 4,200 or whatever – we’re thinking about multiply by 10. So once that credibility is lost, you’re going to have to find a way to re-establish that, and I think the only way you can do that is by bringing in neutral observers to help understand exactly what happened there. And we still insist that that happens. We’d hope the WHO would also take that lead and insist that folks get on the ground to help out.
MR HARUTUNIAN: Joel Gehrke, Washington Examiner.
QUESTION: Hi, thanks for doing this. Looking across the region, we’ve seen China’s moves vis-a-vis Hong Kong, the fighter sorties around Taiwan, and now the border clash on the China-Indian border. Can you assess, especially after this meeting, that there’s a coherent policy uniting all of those different aggressive actions, and what’s the boundary or the limiting principle of those actions from what you can tell? Do you have a sense of how far they’re willing to go in any of those areas? Did you communicate any U.S. warnings regarding those areas, maybe especially regarding India? And on the other hand, did they seek to draw any red lines for the U.S.?
ASSISTANT SECRETARY STILWELL: I’m not going to speculate, but I will point you to several articles that I’ve seen that note that there – one explanation for creating multiple fronts like this is an assessment in Beijing that the world is distracted and is focused entirely on survival, right, recovering from the corona pandemic, which then possibly is seen as an opportunity to take advantage of distraction. And I’m not going to offer an official U.S. Government position on that, but there are some – numerous explanations out there for that.
What we’re doing, we’re obviously watching the India-China border dispute very closely. It – this activity is similar to activity we’ve seen in the past on border disputes with the PRC, and again, I would point you to those – I think it was 2015 when Xi Jinping traveled to India the first time. The PLA invaded this contested area deeper and longer, with more people, than ever before historically. Again, whether that was a negotiating tactic or a – just a punch in the nose to demonstrate their superiority, I don’t know. But then we saw the Doklam issue down near Bhutan, where we saw similar concerns. I wish I knew. Again, we don’t have a lot of visibility and we don’t have a lot of open dialogue with our Chinese counterparts, and honestly I’d like to see more of that if we can. Over.
MR HARUTUNIAN: All right, we’re up at 30 minutes and have time for one more question. Arshad Mohammed, please, go ahead. And I’m sorry that we didn’t get to everybody.
QUESTION: You said at the outset that the Chinese were not very forthcoming, and you’ve said several times that we should watch to see their actions over the next several weeks. My question is: One, did you get any commitments at all from the Chinese that you would expect them to act on in these coming weeks? And secondly, did you discern any concern from China about North Korea’s recent behavior, and do you see any reason that there may be common ground between Washington and Beijing on North Korea?
ASSISTANT SECRETARY STILWELL: Let me answer the second question first. Yes, this increasing – the opportunities for cooperative behavior with PRC of late are – seem to be fewer and fewer. But there are areas of obvious cooperation, and North Korea seems to be the obvious one, and if the U.S. and China can both work together on this, it seems that North Korea would understand the importance and the need to get back to the table and discuss their nuclear program and other (inaudible). So yeah, there are areas where cooperation is entirely possible. It was an area, especially as I mentioned earlier, we’ll see if – we made our points very clear. They made theirs. There wasn’t a lot of dispute. I think it’s going to come down to how it’s executed. And as for the rest, I’ll leave it to the Deputy Secretary Steve Biegun, who is – he owns the North Korea portfolio.
On commitments, I’ll point to trade, as I mentioned earlier, that there was a very clear commitment to following through on the Phase 1 trade agreement. So that seems to be an effort to get that credibility back, where we committed to do it, we actually did it, and therefore the credibility is building. As for the rest, I’m not going to foreclose the possibility that they might actually hear what we have to say and understand our – how serious we are about these other issues of concern. And we remain optimistic as much as we can. The history doesn’t necessarily support that, but eventually I think they’re going to understand that there – there’s got to be give and take in any relationship. It can’t be all take, so to make a truly constructive and reciprocal relationship, the President and this administration’s insisting that China live up to its commitments. Over.
MS ORTAGUS: All right. Thanks so much, everybody. I apologize, I know we had some more people in the queue, but we’re already over 30 minutes, and sorry we had to throw this together last minute, but we have many more briefings scheduled for you tomorrow. Thanks, Dave Stilwell, for doing this. Much appreciated. Bye.
POLITICS
U.S. Department of State. 06/18/2020. I Was In The Room Too. Michael R. Pompeo, Secretary of State
I’ve not read the book, but from the excerpts I’ve seen published, John Bolton is spreading a number of lies, fully-spun half-truths, and outright falsehoods. It is both sad and dangerous that John Bolton’s final public role is that of a traitor who damaged America by violating his sacred trust with its people. To our friends around the world: you know that President Trump’s America is a force for good in the world.
EMPLOYMENT
DoL. BLS. June 19, 2020. STATE EMPLOYMENT AND UNEMPLOYMENT -- MAY 2020
Unemployment rates were lower in May in 38 states and the District of Columbia,
higher in 3 states, and stable in 9 states, the U.S. Bureau of Labor Statistics
reported today. All 50 states and the District had jobless rate increases from
a year earlier. The national unemployment rate declined by 1.4 percentage points
over the month to 13.3 percent but was 9.7 points higher than in May 2019.
Nonfarm payroll employment increased in 46 states, decreased in Hawaii and the
District of Columbia, and was unchanged in 3 states in May 2020. Over the year,
nonfarm payroll employment decreased in all 50 states and the District.
This news release presents statistics from two monthly programs. The civilian
labor force and unemployment data are modeled based largely on a survey of
households. These data pertain to individuals by where they reside. The employment
data are from an establishment survey that measures nonfarm employment, hours,
and earnings by industry. These data pertain to jobs on payrolls defined by where
the establishments are located. For more information about the concepts and
statistical methodologies used by these two programs, see the Technical Note.
Unemployment
Nevada had the highest unemployment rate in May, 25.3 percent, followed by Hawaii,
22.6 percent, and Michigan, 21.2 percent. The rates in Delaware (15.8 percent),
Florida (14.5 percent), Massachusetts (16.3 percent), and Minnesota (9.9 percent)
set new series highs. (All state series begin in 1976.) Nebraska had the lowest
unemployment rate, 5.2 percent. In total, 24 states and the District of Columbia
had unemployment rates lower than the U.S. figure of 13.3 percent, 12 states had
higher rates, and 14 states had rates that were not appreciably different from
that of the nation. (See tables A and 1.)
In May, the largest unemployment rate decreases occurred in Mississippi (-5.7
percentage points), Kentucky (-5.6 points), and Indiana (-5.2 points). Rates
declined over the month by at least 2.0 percentage points in an additional 18
states and the District of Columbia. The over-the-month jobless rate increases
occurred in Minnesota (+1.2 percentage points), Connecticut (+1.1 points), and
Florida (+0.7 point). Nine states had rates that were not notably different from
those of a month earlier, though some had changes that were at least as large
numerically as the significant changes. (See table B.)
The largest unemployment rate increases from May 2019 occurred in Nevada (+21.3
percentage points), Hawaii (+19.9 points), and Michigan (+17.0 points), with
another 12 states experiencing increases of 10.0 points or more. The smallest
over-the-year rate increases occurred in Nebraska (+2.1 percentage points) and
the District of Columbia (+3.4 points). (See table C.)
Nonfarm Payroll Employment
Nonfarm payroll employment increased in 46 states, decreased in Hawaii and the
District of Columbia, and remained unchanged in 3 states in May 2020. The largest
job gains occurred in Texas (+237,800), Pennsylvania (+198,300), and Florida
(+182,900). The largest percentage increases occurred in Vermont (+6.4 percent),
Michigan (+5.2 percent), and Montana and Pennsylvania (+4.0 percent each).
Employment decreased in Hawaii (-6,000, or -1.1 percent) and the District (-9,100,
or -1.2 percent). (See tables D and 3.)
All 50 states and the District of Columbia had over-the-year decreases in nonfarm
payroll employment in May. The largest job declines occurred in California
(-2,267,100), New York (-1,794,000), and Texas (-917,800). The smallest declines
occurred in Wyoming (-26,900), South Dakota (-33,100), and Alaska (-40,700). The
largest percentage declines occurred in Hawaii (-20.1 percent), Michigan (-19.2
percent), and New York (-18.3 percent). The smallest percentage declines occurred
in Utah (-4.8 percent), Arizona (-5.7 percent), and Idaho (-5.9 percent). (See
table E.)
__________________________________________________________________________________
| |
| Coronavirus (COVID-19) Pandemic Impact on May 2020 |
| Establishment and Household Survey Data |
| |
| BLS has continued to review all estimation and methodological procedures for |
| the establishment survey, which included the review of data, estimation |
| processes, the application of the birth-death model, and seasonal adjustment. |
| Business births and deaths cannot be adequately captured by the establishment |
| survey as they occur. Therefore, the Current Employment Statistics (CES) |
| program uses a model to account for the relatively stable net employment |
| change generated by business births and deaths. Due to the impact of COVID-19, |
| the relationship between business births and deaths is no longer stable. |
| Typically, reports with zero employment are not included in estimation. For |
| the April final estimates, CES included a portion of these reports in the |
| estimates and made modifications to the birth-death model. For the May 2020 |
| preliminary estimates, in addition to the inclusion of reported zeros and the |
| modification of the model, the establishment survey included a portion of the |
| reports that returned to reporting positive employment from reporting zero |
| employment. For more information, see www.bls.gov/web/empsit/cesbd.htm. |
| |
| In the establishment survey, workers who are paid by their employer for all |
| or any part of the pay period including the 12th of the month are counted as |
| employed, even if they were not actually at their jobs. Workers who are |
| temporarily or permanently absent from their jobs and are not being paid are |
| not counted as employed, even if they are continuing to receive benefits. The |
| length of the reference period does vary across the respondents in the |
| establishment survey; one-third of businesses have a weekly pay period, |
| slightly over 40 percent a bi-weekly, about 20 percent semi-monthly, and a |
| small amount monthly. |
| |
| For the May 2020 estimates of household employment and unemployment from the |
| Local Area Unemployment Statistics (LAUS) program, BLS continued to implement |
| level-shift outliers in the employment and/or unemployment inputs to the |
| models, based on statistical evaluation of movements in each area's inputs. |
| Both the Current Population Survey inputs, which serve as the primary inputs |
| to the LAUS models, and the nonfarm payroll employment and unemployment |
| insurance claims covariates were examined for outliers. The resulting |
| implementation of level shifts preserved movements in the published estimates |
| that the models otherwise would have discounted, without requiring changes |
| to how the models create estimates at other points in the time series. |
| |
| Effective with the April 2020 revised and May 2020 preliminary data, BLS |
| modified the LAUS seasonal adjustment process to isolate level shifts from |
| the estimation of seasonal factors. This mitigated distortions that had been |
| present in the preliminary data for April 2020, which had resulted from the |
| complex relationships between level shifts in the household survey and |
| covariate inputs to the state models. In addition, due to the increasing |
| complexity of the outlier treatments, use of the Reproducing Kernel Hilbert |
| Space filter to smooth the seasonally adjusted estimates was suspended. These |
| changes to the seasonal adjustment and smoothing procedures resulted in some |
| unusually large monthly revisions to the LAUS seasonally adjusted estimates |
| for April 2020. |
| |
| In future cycles, the complex relationships between level shifts in the inputs |
| and the revisions to the covariate inputs are likely to result in revisions |
| to LAUS data for the prior month of larger magnitudes than the historical |
| norms. This includes both the seasonally adjusted and not seasonally adjusted |
| data. |
| |
| The "Frequently asked questions" document at |
| www.bls.gov/cps/employment-situation-covid19-faq-may-2020.pdf extensively |
| discusses the impact of a misclassification in the household survey on the |
| national estimates for May 2020. This misclassification continued to be |
| widespread geographically, with BLS analysis indicating that all states again |
| were affected to at least some degree. However, according to usual practice, |
| the data from the household survey are accepted as recorded. To maintain data |
| integrity, no ad hoc actions are taken to reclassify survey responses. Hence, |
| the household survey estimates of employed and unemployed people that serve |
| as the primary inputs to the state models were affected to varying degrees |
| by the misclassification, which in turn affected the official LAUS estimates |
| for May 2020. |
| |
| Household data for Puerto Rico are not modeled, but rather are derived from |
| a monthly household survey similar to the Current Population Survey. Due to |
| the effects of the pandemic and efforts to contain the virus, Puerto Rico had |
| not been able to conduct its household survey for March or April 2020. |
| Although data collection resumed for May 2020, BLS has not had sufficient |
| opportunity to evaluate the resulting estimates or begin the process of |
| interpolating data for the missing months, which will be necessary for |
| seasonal adjustment. Hence, no estimates for Puerto Rico are being |
| published by BLS in conjunction with this news release. |
|__________________________________________________________________________________|
Table A. States with unemployment rates significantly different
from that of the U.S., May 2020, seasonally adjusted
--------------------------------------------------------------
State | Rate(p)
--------------------------------------------------------------
United States (1) ...................| 13.3
|
Alabama .............................| 9.9
Arizona .............................| 8.9
Arkansas ............................| 9.5
California ..........................| 16.3
Colorado ............................| 10.2
Connecticut .........................| 9.4
Delaware ............................| 15.8
District of Columbia ................| 8.9
Florida .............................| 14.5
Georgia .............................| 9.7
|
Hawaii ..............................| 22.6
Idaho ...............................| 8.9
Illinois ............................| 15.2
Iowa ................................| 10.0
Kansas ..............................| 10.0
Kentucky ............................| 11.0
Maine ...............................| 9.3
Maryland ............................| 9.9
Massachusetts .......................| 16.3
Michigan ............................| 21.2
|
Minnesota ...........................| 9.9
Mississippi .........................| 10.6
Missouri ............................| 10.1
Montana .............................| 9.0
Nebraska ............................| 5.2
Nevada ..............................| 25.3
New Jersey ..........................| 15.2
New Mexico ..........................| 9.2
New York ............................| 14.5
North Dakota ........................| 9.1
|
Rhode Island ........................| 16.3
South Dakota ........................| 9.4
Tennessee ...........................| 11.3
Utah ................................| 8.5
Virginia ............................| 9.4
Washington ..........................| 15.1
Wyoming .............................| 8.8
--------------------------------------------------------------
(1) Data are not preliminary.
(p) = preliminary.
Table B. States with statistically significant unemployment rate changes
from April 2020 to May 2020, seasonally adjusted
-------------------------------------------------------------------------
| Rate |
|-----------|-----------| Over-the-month
State | April | May | change(p)
| 2020 | 2020(p) |
-------------------------------------------------------------------------
Alabama ........................| 13.8 | 9.9 | -3.9
Alaska .........................| 13.5 | 12.6 | -.9
Arizona ........................| 13.4 | 8.9 | -4.5
Arkansas .......................| 10.8 | 9.5 | -1.3
Colorado .......................| 12.2 | 10.2 | -2.0
Connecticut ....................| 8.3 | 9.4 | 1.1
District of Columbia ...........| 11.7 | 8.9 | -2.8
Florida ........................| 13.8 | 14.5 | .7
Georgia ........................| 12.6 | 9.7 | -2.9
Hawaii .........................| 23.8 | 22.6 | -1.2
| | |
Idaho ..........................| 11.8 | 8.9 | -2.9
Illinois .......................| 17.2 | 15.2 | -2.0
Indiana ........................| 17.5 | 12.3 | -5.2
Iowa ...........................| 11.0 | 10.0 | -1.0
Kansas .........................| 11.9 | 10.0 | -1.9
Kentucky .......................| 16.6 | 11.0 | -5.6
Louisiana ......................| 15.1 | 13.3 | -1.8
Maine ..........................| 10.4 | 9.3 | -1.1
Michigan .......................| 24.0 | 21.2 | -2.8
Minnesota ......................| 8.7 | 9.9 | 1.2
| | |
Mississippi ....................| 16.3 | 10.6 | -5.7
Montana ........................| 11.9 | 9.0 | -2.9
Nebraska .......................| 8.7 | 5.2 | -3.5
Nevada .........................| 30.1 | 25.3 | -4.8
New Hampshire ..................| 17.1 | 14.5 | -2.6
New Jersey .....................| 16.3 | 15.2 | -1.1
New Mexico .....................| 11.9 | 9.2 | -2.7
New York .......................| 15.3 | 14.5 | -.8
Ohio ...........................| 17.6 | 13.7 | -3.9
Oklahoma .......................| 14.7 | 12.6 | -2.1
| | |
Pennsylvania ...................| 16.1 | 13.1 | -3.0
Rhode Island ...................| 18.1 | 16.3 | -1.8
South Dakota ...................| 10.9 | 9.4 | -1.5
Tennessee ......................| 15.5 | 11.3 | -4.2
Texas ..........................| 13.5 | 13.0 | -.5
Utah ...........................| 10.4 | 8.5 | -1.9
Vermont ........................| 16.5 | 12.7 | -3.8
Virginia .......................| 11.2 | 9.4 | -1.8
Washington .....................| 16.3 | 15.1 | -1.2
West Virginia ..................| 15.9 | 12.9 | -3.0
Wisconsin ......................| 13.6 | 12.0 | -1.6
Wyoming ........................| 9.6 | 8.8 | -.8
-------------------------------------------------------------------------
(p) = preliminary.
Table C. States with statistically significant unemployment rate changes
from May 2019 to May 2020, seasonally adjusted
-------------------------------------------------------------------------
| Rate |
|-----------|-----------| Over-the-year
State | May | May | change(p)
| 2019 | 2020(p) |
-------------------------------------------------------------------------
Alabama ........................| 3.0 | 9.9 | 6.9
Alaska .........................| 6.2 | 12.6 | 6.4
Arizona ........................| 4.8 | 8.9 | 4.1
Arkansas .......................| 3.5 | 9.5 | 6.0
California .....................| 4.1 | 16.3 | 12.2
Colorado .......................| 2.8 | 10.2 | 7.4
Connecticut ....................| 3.7 | 9.4 | 5.7
Delaware .......................| 3.7 | 15.8 | 12.1
District of Columbia ...........| 5.5 | 8.9 | 3.4
Florida ........................| 3.2 | 14.5 | 11.3
| | |
Georgia ........................| 3.6 | 9.7 | 6.1
Hawaii .........................| 2.7 | 22.6 | 19.9
Idaho ..........................| 2.9 | 8.9 | 6.0
Illinois .......................| 4.1 | 15.2 | 11.1
Indiana ........................| 3.3 | 12.3 | 9.0
Iowa ...........................| 2.7 | 10.0 | 7.3
Kansas .........................| 3.1 | 10.0 | 6.9
Kentucky .......................| 4.3 | 11.0 | 6.7
Louisiana ......................| 4.5 | 13.3 | 8.8
Maine ..........................| 3.0 | 9.3 | 6.3
| | |
Maryland .......................| 3.7 | 9.9 | 6.2
Massachusetts ..................| 2.9 | 16.3 | 13.4
Michigan .......................| 4.2 | 21.2 | 17.0
Minnesota ......................| 3.2 | 9.9 | 6.7
Mississippi ....................| 5.4 | 10.6 | 5.2
Missouri .......................| 3.1 | 10.1 | 7.0
Montana ........................| 3.5 | 9.0 | 5.5
Nebraska .......................| 3.1 | 5.2 | 2.1
Nevada .........................| 4.0 | 25.3 | 21.3
New Hampshire ..................| 2.5 | 14.5 | 12.0
| | |
New Jersey .....................| 3.3 | 15.2 | 11.9
New Mexico .....................| 4.9 | 9.2 | 4.3
New York .......................| 4.0 | 14.5 | 10.5
North Carolina .................| 4.0 | 12.9 | 8.9
North Dakota ...................| 2.4 | 9.1 | 6.7
Ohio ...........................| 4.1 | 13.7 | 9.6
Oklahoma .......................| 3.2 | 12.6 | 9.4
Oregon .........................| 3.9 | 14.2 | 10.3
Pennsylvania ...................| 4.2 | 13.1 | 8.9
Rhode Island ...................| 3.6 | 16.3 | 12.7
| | |
South Carolina .................| 3.1 | 12.5 | 9.4
South Dakota ...................| 3.3 | 9.4 | 6.1
Tennessee ......................| 3.5 | 11.3 | 7.8
Texas ..........................| 3.4 | 13.0 | 9.6
Utah ...........................| 2.7 | 8.5 | 5.8
Vermont ........................| 2.3 | 12.7 | 10.4
Virginia .......................| 2.8 | 9.4 | 6.6
Washington .....................| 4.4 | 15.1 | 10.7
West Virginia ..................| 4.7 | 12.9 | 8.2
Wisconsin ......................| 3.3 | 12.0 | 8.7
Wyoming ........................| 3.5 | 8.8 | 5.3
-------------------------------------------------------------------------
(p) = preliminary.
Table D. States with statistically significant employment changes from
April 2020 to May 2020, seasonally adjusted
--------------------------------------------------------------------------------------
| | | Over-the-month change(p)
State | April | May |---------------------------
| 2020 | 2020(p) | Level | Percent
--------------------------------------------------------------------------------------
Alabama ......................| 1,865,800 | 1,908,000 | 42,200 | 2.3
Alaska .......................| 281,300 | 287,800 | 6,500 | 2.3
Arizona ......................| 2,691,800 | 2,756,000 | 64,200 | 2.4
Arkansas .....................| 1,162,800 | 1,184,200 | 21,400 | 1.8
California ...................| 14,979,000 | 15,120,600 | 141,600 | .9
Colorado .....................| 2,471,100 | 2,539,900 | 68,800 | 2.8
Connecticut ..................| 1,408,200 | 1,434,000 | 25,800 | 1.8
Delaware .....................| 387,900 | 392,300 | 4,400 | 1.1
District of Columbia .........| 738,300 | 729,200 | -9,100 | -1.2
Florida ......................| 7,893,500 | 8,076,400 | 182,900 | 2.3
| | | |
Georgia ......................| 4,120,500 | 4,200,100 | 79,600 | 1.9
Hawaii .......................| 528,800 | 522,800 | -6,000 | -1.1
Idaho ........................| 688,700 | 713,000 | 24,300 | 3.5
Illinois .....................| 5,322,300 | 5,384,500 | 62,200 | 1.2
Indiana ......................| 2,743,700 | 2,831,200 | 87,500 | 3.2
Iowa .........................| 1,395,500 | 1,411,300 | 15,800 | 1.1
Kansas .......................| 1,290,200 | 1,314,400 | 24,200 | 1.9
Kentucky .....................| 1,620,700 | 1,651,100 | 30,400 | 1.9
Louisiana ....................| 1,722,400 | 1,755,200 | 32,800 | 1.9
Maine ........................| 532,800 | 547,100 | 14,300 | 2.7
| | | |
Maryland .....................| 2,408,800 | 2,438,600 | 29,800 | 1.2
Massachusetts ................| 3,022,100 | 3,080,700 | 58,600 | 1.9
Michigan .....................| 3,401,100 | 3,579,300 | 178,200 | 5.2
Mississippi ..................| 1,040,800 | 1,070,900 | 30,100 | 2.9
Missouri .....................| 2,566,700 | 2,616,400 | 49,700 | 1.9
Montana ......................| 425,100 | 442,100 | 17,000 | 4.0
Nebraska .....................| 945,400 | 953,200 | 7,800 | .8
Nevada .......................| 1,139,000 | 1,171,700 | 32,700 | 2.9
New Hampshire ................| 572,000 | 583,600 | 11,600 | 2.0
New Jersey ...................| 3,410,600 | 3,497,400 | 86,800 | 2.5
| | | |
New Mexico ...................| 762,300 | 767,800 | 5,500 | .7
New York .....................| 7,902,400 | 8,000,400 | 98,000 | 1.2
North Carolina ...............| 3,996,200 | 4,063,300 | 67,100 | 1.7
Ohio .........................| 4,704,000 | 4,831,100 | 127,100 | 2.7
Oklahoma .....................| 1,556,500 | 1,579,000 | 22,500 | 1.4
Oregon .......................| 1,689,700 | 1,712,200 | 22,500 | 1.3
Pennsylvania .................| 4,993,100 | 5,191,400 | 198,300 | 4.0
Rhode Island .................| 410,300 | 423,400 | 13,100 | 3.2
South Carolina ...............| 1,921,800 | 1,989,400 | 67,600 | 3.5
South Dakota .................| 402,500 | 406,500 | 4,000 | 1.0
| | | |
Tennessee ....................| 2,755,000 | 2,848,900 | 93,900 | 3.4
Texas ........................| 11,604,700 | 11,842,500 | 237,800 | 2.0
Utah .........................| 1,442,800 | 1,483,200 | 40,400 | 2.8
Vermont ......................| 245,800 | 261,500 | 15,700 | 6.4
Virginia .....................| 3,661,800 | 3,681,600 | 19,800 | .5
Washington ...................| 2,966,800 | 3,052,700 | 85,900 | 2.9
West Virginia ................| 617,500 | 630,800 | 13,300 | 2.2
Wisconsin ....................| 2,518,100 | 2,593,000 | 74,900 | 3.0
--------------------------------------------------------------------------------------
(p) = preliminary.
Table E. States with statistically significant employment changes from
May 2019 to May 2020, seasonally adjusted
--------------------------------------------------------------------------------------
| | | Over-the-year change(p)
State | May | May |---------------------------
| 2019 | 2020(p) | Level | Percent
--------------------------------------------------------------------------------------
Alabama ......................| 2,068,800 | 1,908,000 | -160,800 | -7.8
Alaska .......................| 328,500 | 287,800 | -40,700 | -12.4
Arizona ......................| 2,923,000 | 2,756,000 | -167,000 | -5.7
Arkansas .....................| 1,275,200 | 1,184,200 | -91,000 | -7.1
California ...................| 17,387,700 | 15,120,600 | -2,267,100 | -13.0
Colorado .....................| 2,776,100 | 2,539,900 | -236,200 | -8.5
Connecticut ..................| 1,685,400 | 1,434,000 | -251,400 | -14.9
Delaware .....................| 465,000 | 392,300 | -72,700 | -15.6
District of Columbia .........| 796,200 | 729,200 | -67,000 | -8.4
Florida ......................| 8,926,800 | 8,076,400 | -850,400 | -9.5
| | | |
Georgia ......................| 4,603,200 | 4,200,100 | -403,100 | -8.8
Hawaii .......................| 654,400 | 522,800 | -131,600 | -20.1
Idaho ........................| 757,900 | 713,000 | -44,900 | -5.9
Illinois .....................| 6,122,400 | 5,384,500 | -737,900 | -12.1
Indiana ......................| 3,172,100 | 2,831,200 | -340,900 | -10.7
Iowa .........................| 1,585,900 | 1,411,300 | -174,600 | -11.0
Kansas .......................| 1,424,500 | 1,314,400 | -110,100 | -7.7
Kentucky .....................| 1,938,000 | 1,651,100 | -286,900 | -14.8
Louisiana ....................| 1,991,200 | 1,755,200 | -236,000 | -11.9
Maine ........................| 634,400 | 547,100 | -87,300 | -13.8
| | | |
Maryland .....................| 2,768,300 | 2,438,600 | -329,700 | -11.9
Massachusetts ................| 3,685,700 | 3,080,700 | -605,000 | -16.4
Michigan .....................| 4,429,300 | 3,579,300 | -850,000 | -19.2
Minnesota ....................| 2,981,200 | 2,599,600 | -381,600 | -12.8
Mississippi ..................| 1,158,000 | 1,070,900 | -87,100 | -7.5
Missouri .....................| 2,900,000 | 2,616,400 | -283,600 | -9.8
Montana ......................| 483,700 | 442,100 | -41,600 | -8.6
Nebraska .....................| 1,026,000 | 953,200 | -72,800 | -7.1
Nevada .......................| 1,417,000 | 1,171,700 | -245,300 | -17.3
New Hampshire ................| 683,500 | 583,600 | -99,900 | -14.6
| | | |
New Jersey ...................| 4,186,900 | 3,497,400 | -689,500 | -16.5
New Mexico ...................| 852,100 | 767,800 | -84,300 | -9.9
New York .....................| 9,794,400 | 8,000,400 | -1,794,000 | -18.3
North Carolina ...............| 4,568,100 | 4,063,300 | -504,800 | -11.1
North Dakota .................| 439,600 | 398,000 | -41,600 | -9.5
Ohio .........................| 5,588,700 | 4,831,100 | -757,600 | -13.6
Oklahoma .....................| 1,702,900 | 1,579,000 | -123,900 | -7.3
Oregon .......................| 1,938,100 | 1,712,200 | -225,900 | -11.7
Pennsylvania .................| 6,055,200 | 5,191,400 | -863,800 | -14.3
Rhode Island .................| 503,300 | 423,400 | -79,900 | -15.9
| | | |
South Carolina ...............| 2,182,400 | 1,989,400 | -193,000 | -8.8
South Dakota .................| 439,600 | 406,500 | -33,100 | -7.5
Tennessee ....................| 3,114,700 | 2,848,900 | -265,800 | -8.5
Texas ........................| 12,760,300 | 11,842,500 | -917,800 | -7.2
Utah .........................| 1,558,200 | 1,483,200 | -75,000 | -4.8
Vermont ......................| 315,600 | 261,500 | -54,100 | -17.1
Virginia .....................| 4,049,700 | 3,681,600 | -368,100 | -9.1
Washington ...................| 3,461,200 | 3,052,700 | -408,500 | -11.8
West Virginia ................| 722,200 | 630,800 | -91,400 | -12.7
Wisconsin ....................| 2,980,700 | 2,593,000 | -387,700 | -13.0
Wyoming ......................| 290,500 | 263,600 | -26,900 | -9.3
--------------------------------------------------------------------------------------
(p) = preliminary.
FULL DOCUMENT: https://www.bls.gov/news.release/pdf/laus.pdf
INTERNATIONAL TRANSACTIONS
DoC. BEA. June 19, 2020. U.S. International Transactions, First Quarter 2020 and Annual Update. Current Account Deficit Narrows by 0.1 Percent in First Quarter
Current Account Balance, First Quarter
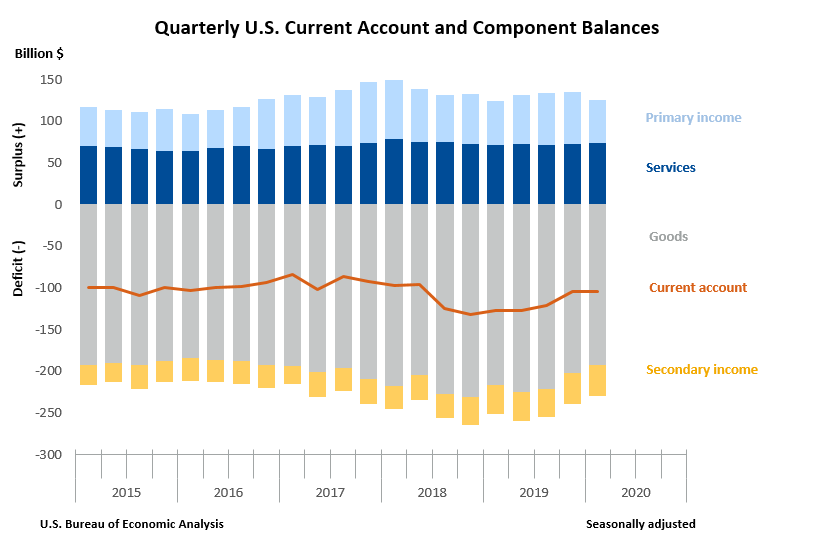
The U.S. current account deficit, which reflects the combined balances on trade in goods and services and income flows between U.S. residents and residents of other countries, narrowed by $0.1 billion, or 0.1 percent, to $104.2 billion in the first quarter of 2020, according to statistics from the U.S. Bureau of Economic Analysis (BEA). The revised fourth quarter deficit was $104.3 billion.
The first quarter deficit was 1.9 percentage of current dollar gross domestic product, up less than 0.1 percentage point from the fourth quarter.
The $0.1 billion narrowing of the current account deficit in the first quarter mainly reflected a reduced deficit on goods that was largely offset by a reduced surplus on primary income and an expanded deficit on secondary income.
Coronavirus (COVID-19) Impact on First Quarter 2020 International Transactions
The declines in first quarter 2020 current account transactions are, in part, due to the impact of COVID-19, as many businesses were operating at limited capacity or ceased operations completely, and the movement of travelers across borders was restricted. In the financial account, currency swaps between the U.S. Federal Reserve System and several foreign central banks contributed to record levels of U.S. acquisition of assets and U.S. incurrence of liabilities. The full economic effects of the COVID-19 pandemic cannot be quantified in the statistics for the first quarter because the impacts are generally embedded in source data and cannot be separately identified. For more information on the impact of COVID-19 on the statistics, see the technical note that accompanies this release.
Current Account Transactions (tables 1-5)
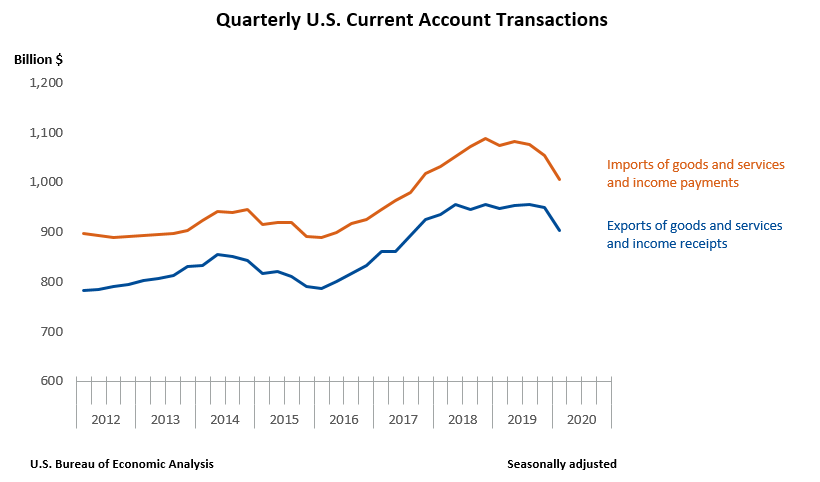
Exports of goods and services to, and income received from, foreign residents decreased $47.5 billion, to $902.3 billion, in the first quarter. Imports of goods and services from, and income paid to, foreign residents decreased $47.7 billion, to $1.01 trillion.
Trade in Goods (table 2)
Exports of goods decreased $8.4 billion, to $403.0 billion, mostly reflecting decreases in capital goods, mainly civilian aircraft, and in consumer goods, mainly jewelry and collectibles. Imports of goods decreased $18.6 billion, to $595.3 billion, mostly reflecting decreases in consumer goods, mainly cell phones and other household goods, and in capital goods, mainly computers, telecommunications equipment, and other industrial machinery.
Trade in Services (table 3)
Exports of services decreased $11.7 billion, to $209.4 billion, and imports of services decreased $12.2 billion, to $136.1 billion. The decreases in both exports and imports mainly reflected decreases in travel, primarily other personal travel, and in transport, primarily air passenger transport.
Primary Income (table 4)
Receipts of primary income decreased $27.8 billion, to $255.1 billion, and payments of primary income decreased $18.3 billion, to $202.7 billion. The decreases in both receipts and payments mostly reflected decreases in direct investment income, mainly earnings.
Secondary Income (table 5)
Receipts of secondary income increased $0.3 billion, to $34.8 billion, and payments of secondary income increased $1.5 billion, to $72.4 billion. The increases in both receipts and payments mainly reflected increases in private transfers, primarily private sector fines and penalties.
Capital Account Transactions (table 1)
Capital transfer payments increased $0.9 billion, to $3.0 billion in the first quarter, primarily reflecting an increase in investment grants.
Financial Account Transactions (tables 1, 6, 7, and 8)
Net financial account transactions were −$201.1 billion in the first quarter, reflecting net U.S. borrowing from foreign residents.
Financial Assets (tables 1, 6, 7, and 8)
First quarter transactions increased U.S. residents’ foreign financial assets by $722.7 billion. Transactions increased portfolio investment assets by $144.7 billion, resulting from large and partly offsetting transactions in equity securities and debt securities, and other investment assets, mostly currency and deposits, by $614.6 billion. Transactions in deposits included $353.9 billion in foreign currency acquired by the Federal Reserve System from central bank liquidity swaps with foreign central banks. Transactions decreased direct investment assets, mostly debt instruments, by $36.3 billion, and reserve assets by $0.2 billion.
Liabilities (tables 1, 6, 7, and 8)
First quarter transactions increased U.S. liabilities to foreign residents by $902.0 billion. Transactions increased direct investment liabilities, mainly equity, by $47.8 billion; portfolio investment liabilities by $21.3 billion, resulting from large and mostly offsetting transactions in equity securities and debt securities; and other investment liabilities, mostly currency and deposits and loans, by $832.9 billion. Transactions in deposits included $387.3 billion in interbank deposits received by the U.S. branches of foreign banks from affiliated foreign banks. These were mainly the U.S. dollars that foreign central banks obtained through the swaps described in the assets section above, which they then lent to foreign banks.
Financial Derivatives (table 1)
Net transactions in financial derivatives were −$21.8 billion in the first quarter, reflecting net borrowing from foreign residents.
Updates to Fourth Quarter 2019 International Transactions Accounts Balances
Billions of dollars, seasonally adjusted | ||
| Preliminary estimate | Revised estimate | |
|---|---|---|
| Current account balance | -109.8 | −104.3 |
| Goods balance | −202.8 | −202.5 |
| Services balance | 62.9 | 72.7 |
| Primary income balance | 67.3 | 62.0 |
| Secondary income balance | −37.3 | −36.5 |
| Net financial account transactions | −71.8 | −29.3 |
Annual Update of the International Transactions Accounts (table 9)
The statistics in this release reflect the annual update of the U.S. international transactions accounts (ITAs). With this update, BEA has incorporated newly available and revised source data, changes in definitions and classifications, methodological and source data improvements, and updated seasonal adjustments. In addition, table presentations for the ITAs have been expanded to provide additional detail. Statistics are revised for the first quarter of 1999 to the fourth quarter of 2019.
Key changes introduced in this annual update are summarized below. Additional information on these changes is published in “Preview of the 2020 Annual Update of the International Economic Accounts” in the April 2020 issue of the Survey of Current Business. An article describing the revisions to the statistics will be published in the July 2020 issue.
Expanded trade in services statistics
Expanded quarterly geographic detail on trade in services from 38 to 90 countries and geographic areas
Introduction of measures of two implicitly priced financial services—financial intermediation services indirectly measured (FISIM) and margins on buying and selling—and additional subcategory detail for financial services
Expansion of major services categories from nine to twelve categories to more closely align with international guidelines. The new categories are:
Construction, which was previously a component of other business services.
Personal, cultural, and recreational services, which consists of transactions that were previously classified in charges for the use of intellectual property n.i.e. (not included elsewhere) and other business services.
Manufacturing services on physical inputs owned by others, which is a specific form of “contract manufacturing.” Data to estimate these services are not yet available; the category acts as a placeholder for future statistics.
Improved classification of services categories, particularly intellectual property-related transactions, to align with international standards
Methodological and source data improvements and other reclassifications
Improvements to estimation procedures for statistics that are based on BEA services surveys, including maintenance and repair services; construction; insurance services; financial services; charges for the use of intellectual property; telecommunications, computer, and information services; other business services; and personal, cultural, and recreational services
Incorporation of the results of the 2017 Benchmark Survey of Selected Services and Intellectual Property Transactions with Foreign Persons
Improved methodology and source data for transport services, particularly air passenger services, air freight and port services, and sea freight and port services
Improved methodology and source data for all subcomponents of travel services
Improved traveler visa counts also resulted in revisions to compensation of employees, a component of primary income, and to private transfer payments, a component of secondary income
Other improvements to secondary income, including new data on foreign gifts to U.S. universities, which resulted in revisions to secondary income receipts, and improved methodology for personal transfers payments
FISIM-related improvements to the methodology for other investment interest income to ensure that the service component of interest is included in trade rather than income, as well as new addenda items for interest before adjustment for FISIM
Improved methodology for portfolio investment interest income payments to include income from inflation adjustments associated with U.S. Treasury Inflation Protected Securities
Expansion of the capital account to include:
Investment grants, which have been reclassified from secondary income
Outright sales and purchases of trademarks and franchise fees, which have been reclassified from charges for the use of intellectual property n.i.e.
Improved coverage of fees paid by sporting franchises for the transfer of players
Reclassification of certain U.S. government capital subscriptions or other contributions to international organizations from loan assets to a new category, other equity assets, in the other investment assets functional category in the financial account and incorporation of newly identified U.S. government transactions in other equity assets and loan assets
Other presentational improvements
New subcategory detail for secondary income in ITA table 5.1
New standard ITA tables that present geographic detail
Table 1.4. U.S. International Transactions, Geographic Detail by Type of Transaction
Table 1.5. U.S. International Trade in Goods and Services by Area and Country
Consistency in country and geographic presentations across international data products
FULL DOCUMENT: https://www.bea.gov/sites/default/files/2020-06/trans120_0.pdf
__________________
ORGANISMS
CHINA
Rhodium Group. June 19, 2020. The China Dashboard - Spring 2020
The COVID-19 pandemic has disrupted governance. Beyond the health crisis, governments the world over are intervening to stabilize their economies amid the worst economic shock since the 1930s. So how are we to assess China’s economic reform progress today when there are so many crosscurrents? Is yesterday’s statist sin today’s stabilization solution?
In decades past, and again at the November 2013 Third Plenum meeting that set out the Xi Jinping–era economic strategy, Beijing had determined that China’s interests required greater economic efficiency, even if that meant relinquishing some stability. But as we have documented in this Dashboard, in recent years reforms have mostly been dialed back or put off indefinitely, particularly when pursuing reform led to disruptions. Having failed to reform is not a blessing in disguise; it has not left the Communist Party with more levers of control. Reform was needed because the levers were working less effectively over time, with growth more and more dependent on debt. Past delays limit the options for Beijing now when they are needed most, swelling unemployment and property and banking system risks.
There is an enduring hope that crises foster reform. As in the old Chinese proverb about an old man’s misfortune in losing a horse leading to good outcomes, an economic morass could have the hidden benefit of leading to better policy. Sometimes crises do promote reform, but will that apply in China today? Sometimes a lost horse is, after all, just a lost horse.
Project
The China Dashboard: Tracking China’s Economic Reform Program, a joint project of the Asia Society Policy Institute and the Rhodium Group, delivers a series of data visualizations tracking China’s progress toward its self-defined reform objectives in 10 essential economic policy clusters.
The outlook for China’s economic reforms is a critical factor in the global economy, for major economies and businesses alike. Since 1978, China has made great strides in economic reform, generating both growth opportunities and also disruptions at home and abroad. However this process is far from complete, and the challenges remaining are complex and require increasing regulatory sophistication. This reality, and shortcomings in Chinese data, create uncertainty about the reform outlook, including its pace and direction. For businesses and policymakers in China and abroad, better consensus built on a shared foundation of data is needed to prevent miscalculations and foster confidence.
To build a shared reference point for China’s economic reform progress The China Dashboard provides a set of independently developed resources updated quarterly:
- A net assessment of progress across 10 key Chinese economic reform priorities.
- Detailed individual assessments of each policy reform cluster, including a primary indicator, summary assessment, data analysis, and policy review.
- Clear methodology notes explaining the choices behind each indicator.
Asia Society Policy Institute
With a problem-solving mandate, the Asia Society Policy Institute (ASPI) tackles major policy challenges confronting the Asia-Pacific in security, prosperity, sustainability, and the development of common norms and values for the region.
Rhodium Group
Rhodium Group (RHG) is an economic research firm that combines policy experience, quantitative economic tools and on-the-ground research to analyze disruptive global trends.
FULL DOCUMENT: https://chinadashboard.asiasociety.org/china-dashboard/
_________________
ECONOMIA BRASILEIRA / BRAZIL ECONOMICS
CORONAVÍRUS
FGV. 19/06/2020. Impactos da COVID-19. Efeitos psicológicos da pandemia

Com os avanços da contaminação da COVID-19, as medidas de isolamento aumentaram e estamos há quase 90 dias em quarentena. Devido ao confinamento, os espaços que antes delimitavam os momentos de trabalho, lazer e família já não existem mais e o fluxo de notícias negativas agravam os sintomas de ansiedade, impactando no humor, intensificando a insegurança financeira e as preocupações com o futuro do trabalho. Como remediar os efeitos e encontrar um equilíbrio psicológico? Neste FGV Impactos da Covid-19, Jose Mauro Nunes, professor do Mestrado Executivo em Gestão Empresarial, da FGV EBAPE, fala sobre a organização da rotina e o uso criterioso de informações.
VÍDEO: https://www.youtube.com/watch?v=_d7gMNzEQ_k&feature=youtu.be
MEconomia. RFB. 18/06/2020. COVID-19. Receita reduz efeitos econômicos da pandemia para beneficiários de regimes aduaneiros especiais. Medida leva em conta o desaquecimento global da economia causado pelas restrições logísticas impostas pelo coronavírus
Foi publicada no Diário Oficial da União desta quinta-feira, 18/6, a Instrução Normativa RFB nº 1.960, que estabelece medidas para a redução dos impactos econômicos decorrentes da pandemia causada pela covid-19 com relação aos beneficiários do Regime Aduaneiro Especial de Entreposto Industrial sob Controle Informatizado (Recof) e do Regime Aduaneiro Especial de Entreposto Industrial sob Controle Informatizado do Sistema Público de Escrituração Digital (Recof-Sped).
O Recof e o Recof-Sped são regimes especiais que permitem à empresa beneficiária importar ou adquirir no mercado interno, com suspensão do pagamento de tributos, mercadorias a serem submetidas a operações de industrialização de produtos destinados à exportação ou ao mercado interno.
Para permanecer como beneficiárias, as empresas devem exportar produtos industrializados no valor mínimo anual equivalente a 50% do valor total das mercadorias admitidas no regime, bem como aplicar anualmente, na produção dos bens que industrializar, pelo menos 70% (setenta por cento) das mercadorias admitidas.
Com a nova IN, os índices de industrialização e exportação exigidos para a permanência no regime foram reduzidos em 50% para os períodos de apuração encerrados entre 1º de maio de 2020 e 30 de abril de 2021. Além disso, no caso das mercadorias admitidas entre o dia 1º de janeiro de 2019 e o dia 31 de dezembro de 2020, foi proposto, também, que o prazo de vigência dos regimes, ou sua prorrogação, seja acrescido em um ano.
A nova legislação também permite que as empresas beneficiárias armazenem mercadorias nacionais adquiridas ao amparo dos regimes citados e os produtos delas decorrentes em recinto alfandegado de zona secundária ou armazém-geral. Por fim, as competências relacionadas a autorizações para registro de declarações preliminares e destruição periódica de resíduos, no âmbito do Recof e do Recof-Sped, foram transferidas da Delegacia Especial da Receita Federal do Brasil de Fiscalização de Comércio Exterior (Delex), em São Paulo, para as unidades da Receita Federal com jurisdição sobre o estabelecimento da empresa.
MEconomia. 18/06/2020. COVID-19. Balanço registra 49% dos servidores em trabalho remoto e 1.311 casos de coronavírus. Os dados, referentes à semana de 8 a 12 de junho, foram coletados junto às unidades de gestão de pessoas dos servidores públicos federais civis
A Secretaria de Gestão e Desempenho de Pessoal (SGP) do Ministério da Economia atualizou as informações coletadas na pesquisa sobre o trabalho remoto e os casos confirmados da Covid-19 no âmbito do Poder Executivo Federal civil.
Os dados levantados na semana de 8 a 12 de junho apontam 84.123 servidores públicos federais civis trabalhando em casa, o que representa 49,43% da força de trabalho. Já os casos confirmados da Covid-19 registrados no sistema somam 1.311 pessoas.
Esses números não incluem as instituições que compõem a Rede Federal de Educação (RFE), do Ministério da Educação. Para os demais órgãos da administração pública, mais da metade (52,20%) das unidades administrativas de gestão de pessoas encaminharam à SGP os dados referentes à semana de 8 a 12 de junho. Esta parcela representa 170.178 servidores ativos, o que equivale a 61,40% dos servidores públicos federais, sem contar a Rede Federal de Educação.
Instituições Federais de Ensino
Pelas características particulares de autonomia das instituições que integram a Rede Federal de Educação (universidades, institutos e demais instituições de ensino federal), suas informações atuais são divulgadas pelo Ministério da Educação, no Portal do MEC. Esse painel geral, atualizado pelas próprias universidades e institutos federais, mostra que 276.829 servidores da Rede Federal de Educação, ou seja, 94% do total, estão em trabalho remoto.
Em todo o Poder Executivo Federal civil, portanto, o número de servidores públicos em trabalho remoto é de 360.952, o que representa 63,28% da força de trabalho.
ESPORTE
PR. MCidadania. 18/06/2020. ESPORTE. Medida Provisória altera regras de transmissão de jogos de futebol. MP assinada pelo presidente Bolsonaro também flexibiliza contrato de trabalho dos jogadores
O presidente da República, Jair Bolsonaro, editou Medida Provisória (984/2020) que flexibiliza contratos de trabalho de jogadores com clubes de futebol durante a pandemia do novo coronavírus. O texto, publicado no Diário Oficial da União desta quinta-feira (18), permite aos times firmar contratos de trabalho de no mínimo 30 dias com os atletas profissionais. Pela Lei 9.615, de 1998, conhecida como Lei Pelé, o contrato de trabalho do atleta profissional não podia ter vigência inferior a três meses e nem superior a cinco anos.
A MP também altera as regras de direito de transmissão de partidas de futebol. Segundo a nova legislação, “pertencerá à entidade de prática desportiva mandante o direito de arena sobre o espetáculo desportivo, consistente na prerrogativa exclusiva de negociar, autorizar ou proibir a captação, a fixação, a emissão, a transmissão, a retransmissão ou a reprodução de imagens, por qualquer meio ou processo, do espetáculo desportivo”.
Na prática, isso significa que, a partir de agora, o clube passa a ter o direito de transmissão sobre os jogos. Poderá optar, por exemplo, em transmiti-lo em alguma plataforma digital. Antes, a transmissão só poderia ser feita por uma emissora de TV que tivesse fechado negociações com as duas equipes envolvidas no jogo.
Para o diretor do Departamento de Futebol e Defesa dos Direitos do Torcedor, do Ministério da Cidadania, Christiano Puppi, a edição da MP 984 é um enorme avanço para toda a cadeia do futebol brasileiro. “Ela concede aos times de futebol autonomia pra vender os jogos em que são mandantes, concedendo a garantia do espetáculo que será televisionado. É uma injeção de recurso como nunca vista. Visa, de certa forma, num primeiro momento, reduzir os impactos ocasionados pela Covid-19, mas trará um impacto futuro para os clubes como nunca foi imaginado”, disse.
O texto também define que serão distribuídos, em partes iguais, aos atletas profissionais 5% da receita proveniente da exploração de direitos desportivos audiovisuais, exceto se houver disposição em contrário constante de convenção coletiva de trabalho. Antes, esse valor ficava com os sindicatos de jogadores de futebol.
Segundo Puppi, a medida democratiza o acesso ao futebol. “Permite uma concorrência livre e justa. Ela reduz também o abismo financeiro entre os clubes gigantes, grandes, médios e pequenos, que têm autonomia e independência para os jogos, em que ele for o mandante, poder vender pra quem quer que seja, da forma melhor. Ela também eleva o nível do futebol como um todo. Atende, assim, os atletas, aos clubes e ao torcedor”, finalizou.
AGRICULTURA
PR. MAPA. 18/06/2020. PLANO SAFRA. Cerimônia marca lançamento do Plano Safra 2020/21. Serão destinados R$ 236,3 bilhões para apoiar a produção agropecuária nacional, um aumento de R$ 13,5 bilhões em relação ao plano anterior
Nesta quarta-feira (17), o presidente da Republica, Jair Bolsonaro, e a ministra da Agricultura, Pecuária e Abastecimento, Tereza Cristina, participaram da cerimônia de lançamento do Plano Safra 2020/21.
Em seu discurso, presidente lembrou a importância e a força do campo. “Todos os países têm como objetivo a segurança alimentar. A cidade pode parar, mas, se um dia o campo parar, todos sucumbirão. Nessa pandemia o campo não parou, o pânico não conseguiu chegar nessa região e o alimento chegou às nossas mesas”, ressaltou .
Tereza Cristina anunciou que neste ano o Plano Safra contará com R$ 236,3 bilhões para apoiar a produção agropecuária nacional, um aumento de R$ 13,5 bilhões em relação ao plano anterior. Os financiamentos podem ser contratados de 1º de julho de 2020 a 30 de junho de 2021.
“Todos os anos nos reunimos para esse lançamento. Nesse momento desafiador se torna ainda mais importante garantirmos as nossas colheitas. Em meio a tantas adversidades temos que agradecer em conseguir manter em quantidade e qualidade as ofertas de alimentos”, afirmou.
Ela também lembrou que, graças ao trabalho do agro e das áreas de transporte e logística, o Brasil manteve o abastecimento em todo o País e honrou os compromissos com seus parceiros comerciais.
Tereza Cristina destacou ainda a expectativa para a safra 2019/2020. “O esforço do governo Jair Bolsonaro para viabilizar esse Plano Safra é um reconhecimento às conquistas e ao potencial do setor que está pronto para contribuir para a retomada econômica. Destacamos as boas previsões para este ano: um aumento da área plantada e a colheita de safra recorde de grãos, estimada em 250,5 milhões de toneladas (3,5% superior à safra anterior). É importante frisar ainda que a contratação de crédito rural na safra passada foi a maior já verificada, somando R$ 207 bilhões”, ressaltou.
MAPA. LANÇAMENTO DO PLANO SAFRA. Plano Safra traz mais de R$ 66 bilhões para pequenos e médios produtores. Recursos podem ser contratados a taxas de juros mais baixas
O Plano Safra 2020-2021 vai contemplar os pequenos e médios produtores com mais de R$ 66 bilhões e taxas de juros reduzidas. O anúncio foi feito, nesta quarta-feira (17), em cerimônia no Palácio do Planalto.
Os pequenos produtores rurais terão R$ 33 bilhões para financiamento pelo Programa Nacional de Fortalecimento da Agricultura Familiar (Pronaf), com juros de 2,75% e 4% ao ano. Um aumento de 5,7% no valor em relação à safra anterior quando os juros foram de 3% e 4,6%. Para custeio, serão destinados R$ 19,4 bilhões e R$ 13,6 bilhões.
Já os médios produtores terão para custeio e comercialização R$ 33,1 bilhões, por meio do Programa Nacional de Apoio ao Médio Produtor Rural (Pronamp), com juros de 5% ao ano. Um aumento de 25% em relação à safra anterior, quando foram destinados R$ 26,49 bilhões com juros a 6% ao ano.
O recurso vem em boa hora para os 60 agricultores da Cooperativa Bom Sucesso, de Rio Preto da Eva, no Amazonas. “A gente fica muito feliz com o lançamento do Plano Safra porque a gente sabe que vai ter recurso para custear produção, para compra de implementos, financiamento bancário e tudo isso”, explicou Paulo Abreu, presidente da cooperativa.
Paulo Abreu cultiva e vende melancia, banana, mandioca e mamão. O produtor contou que há quatro anos, com o plano safra, comprou um trator para sua terra e, com isso, aumentou a produtividade da área. Agora, a expectativa é melhorar ainda mais.
“O negócio foi tão bom que, agora, depois de quatro anos, estamos pensando em trocar de equipamento, comprar um trator maior ainda para trabalhar mais, para fazer mais. Então, tudo isso o plano safra vem ajudar na nossa vida.”
Com os recursos do plano Safra, os pequenos e médios produtores também podem investir em assistência técnica.
Foram destinados ainda R$ 500 milhões de crédito para os agricultores familiares financiarem e reformarem suas casas. O financiamento para construção ou reforma da moradia também poderá ser solicitado pelo filho do beneficiário que possua Declaração de Aptidão (DAP) da unidade familiar.
No Programa de Garantia de Preços para Agricultura Familiar (PGPAF), o bônus de desconto será elevado para as operações de custeio e de investimento.
Plano Safra 2020/2021: https://www.gov.br/agricultura/pt-br/plano-safra
MAPA. 18/06/2020. PLANO SAFRA 2020/2021. Plano Safra 2020/2021 traz mais recursos e taxas de juros menores para agricultura familiar. As novidades foram debatidas pela ministra Tereza Cristina, os secretários Fernando Schwanke e Eduardo Sampaio e convidados em live nesta quinta-feira.
O Ministério da Agricultura, Pecuária e Abastecimento (Mapa) promoveu nesta quinta-feira (18) uma live para discutir as novidades do Plano Safra 2020/2021, lançado ontem (17), para a agricultura familiar. A ministra Tereza Cristina, acompanhada dos secretários Fernando Schwanke (Agricultura Familiar e Cooperativismo) e Eduardo Sampaio (Política Agrícola), debateu o tema com o diretor-geral do Instituto Interamericano de Cooperação para a Agricultura (IICA), Manuel Otero; o presidente da Cresol Confederação, Cledir Magri; o diretor executivo de Crédito do Sicredi, Gustavo Freitas, e o ex-ministro da Agricultura, Roberto Rodrigues.
Na conferência virtual "A Agricultura Familiar no Plano Safra – Avanços para o Desenvolvimento e a Segurança Alimentar", a ministra destacou que todas as medidas previstas no Plano têm como objetivo apoiar o pequeno e médio produtor, setores que mais precisam da ajuda do Governo Federal. “Queremos que todos estejam inseridos na base produtiva do país, que possam crescer”, ressaltou, acrescentando que a busca é ampliar a produção dos agricultores familiares para se deslocarem para a categoria de médios produtores e, assim, poderem aumentar o limite de financiamentos.
Tereza Cristina ressaltou que outro foco é a oferta da assistência técnica. "Vamos continuar trabalhando duro para aumentar o percentual de assistência técnica aos produtores pequenos e médios". Outra ação, segundo a ministra, é a destinação de mais recursos do Tesouro Nacional para as cooperativas de crédito alcançarem a capacidade máxima, pois são as instituições financeiras mais próximas do pequeno e médio produtor.
O secretário da Agricultura Familiar e Cooperativismo, Fernando Schwanke, detalhou as ações do Plano Safra relacionadas à agricultura familiar, como o aumento de recursos no Pronaf e Pronamp (mais de R$ 30 bilhões em cada), taxas de juros mais baixas (2,75% no Pronaf), ampliação de limites de crédito para o produtos e também medidas de desburocratização. “Estamos caminhando para tornar o crédito mais democrático e mais fácil para o pequeno produtor”.
Já o secretário de Política Agrícola, Eduardo Sampaio, garantiu alocação de mais recursos para as linhas de financiamento do Pronaf, em caso de grande procura pelos agricultores familiares, repetindo o que foi feito na safra 2019/2020. “Poderá ter remanejamento no decorrer da safra. Temos esse olhar cuidadoso com o pequeno produtor. Esse público não pode ficar sem apoio durante o ano”.
Pronaf-Bioeconomia
Ao destacar o papel da agricultura familiar no abastecimento de alimentos no país, o diretor-geral do Instituto Interamericano de Cooperação para a Agricultura (IICA), Manuel Otero, elogiou a possibilidade de financiamento para custeio e investimentos de cadeias produtivas da bioeconomia, por meio do Pronaf-Bioeconomia.
“Muito acertada esta decisão. Além de produzirem alimentos para a cesta básica, os agricultores familiares são guardiões da sociobiodiversidade”, disse.
Os financiamentos são destinados aos seguintes ramos da bioeconomia, em todos os biomas: extrativismo, produtos sustentáveis da sociobiodiversidade, produção de ervas medicinais, aromáticas e condimentares, produtos artesanais e turismo rural. A taxa de juros é de 2,75% ao ano.
O Plano Safra 2020/2021 amplia de quatro para seis anos o custeio associado para a manutenção das culturas de dendê e seringueira.
Habitação rural
Para o presidente da Cresol Confederação, Cledir Magri, o Ministério marcou um “golaço” ao disponibilizar crédito para a construção e reforma de casas rurais (Pronaf Habitação). A iniciativa foi implantada na safra 2019/2020 e foi mantida no Plano Safra 2020/2021.
Na safra 2020/2021, está prevista linha de financiamento de R$ 500 milhões com taxa de juros de 4.0 % a.a., redução de 13% na taxa. De julho 2019 até maio 2020, foram financiados R$ 400 milhões, beneficiando mais de 8.000 famílias de agricultores familiares.
“Isso tem uma importância extraordinária na vida do produtor rural. Construir e reformar é um grande sonho das famílias”, ressaltou.
Além dos recursos, filhos também poderão financiar a construção de moradias na propriedade dos pais, medida fundamental para a sucessão familiar rural e a permanência dos jovens no campo.
Residência Agrícola
Durante a live, foi anunciado o primeiro edital do Programa de Residência Profissional Agrícola, que irá selecionar projetos para a qualificação técnica de estudantes e recém-egressos de cursos de ciências agrárias e afins, de nível médio e superior, por meio de treinamento prático, supervisionado e orientado.
O edital, com montante de R$ 17,1 milhões, pretende contemplar 900 estudantes. Podem apresentar as propostas instituições de ensino públicas federais. A meta é beneficiar 1.500 estudantes e recém-egressos (15 a 29 anos) dos cursos de ciências agrarias e afins, principalmente de regiões com alta concentração de agricultores familiares e com projetos estratégicos, como o Agronordeste.
“É uma estratégia inteligente do Mapa de qualificar e permitir o ingresso de jovens no mercado de trabalho, ajudando, a longo prazo, a economia do país. Precisamos ganhar em produtividade e agro está para mostrar como é o bastião desse avanço”, afirmou o diretor executivo de Crédito do Sicredi, Gustavo Freitas.
Seguro rural
O ex-ministro da Agricultura, Roberto Rodrigues, citou o aumento de recursos para a subvenção do seguro rural. Em 2021, serão disponibilizados R$ 1,3 bilhão para apoiar os produtores rurais na contratação de uma apólice, o maior montante desde a criação do programa de seguro rural.
“O seguro, a tecnologia e o crédito são o tripé par a agricultura do futuro”, destacou Roberto Rodrigues.
Estima-se a contratação de 298 mil apólices, num montante segurado da ordem de R$ 52 bilhões e cobertura de 21 milhões de hectares.
MAPA. 17/06/2020. PLANO SAFRA 2020/2021. Recursos disponíveis e condições favoráveis devem contribuir para boa safra no próximo ano, diz secretário. Sampaio ressaltou que, mesmo com a Selic mais baixa, os recursos disponibilizados pelo Plano Safra continuam sendo vantajosos para os produtores rurais.
Após o lançamento do Plano Safra 2020/2021, nesta quarta-feira (17), o secretário de Política Agrícola do Ministério da Agricultura, Pecuária e Abastecimento (Mapa), Eduardo Sampaio, disse que os recursos disponibilizados devem contribuir para um bom desempenho da próxima safra agrícola. No total, o Plano Safra 2020-2021 contará com R$ 236,3 bilhões para apoiar a produção agropecuária nacional, um aumento de R$ 13,5 bilhões em relação ao plano anterior.
“Tudo indica que teremos uma safra boa, com uma boa área plantada este ano, com potencial para ser recorde novamente. Além da demanda internacional aquecida, a agricultura brasileira está sendo beneficiada pela questão do câmbio, os preços internos se elevaram, então muitos produtores estão comercializando sua produção antes do que nos anos anteriores, então há um estímulo para fechar contratos com antecipação. Isso é muito positivo, porque garante preços melhores e sinaliza uma safra muito boa para a frente. As coisas vão se somar”, avaliou Sampaio, em entrevista coletiva à imprensa.
Sampaio ressaltou que, mesmo com a taxa básica de juros (Selic) mais baixa, os recursos disponibilizados pelo Plano Safra continuam sendo vantajosos para os produtores rurais. “Com a pandemia, o crédito comercial teve aumento de custo. Mesmo com a queda da Selic, considero que o Plano Safra continua oferecendo um recurso muito bom para o produtor em relação ao que ele pode captar fora”, disse, lembrando que até agora, mesmo com a pandemia, o Brasil não enfrentou nenhum sobressalto no abastecimento de alimentos.
O diretor do Departamento de Financiamento e Informação do Mapa, Wilson Vaz de Araújo, destacou que o ritmo de crédito agrícola está fluindo muito bem entre uma safra e outra. “Vamos entrar no próximo Plano Safra com uma oferta de recursos que é a maior que se colocou até hoje. Isso nos dá bastante tranqüilidade”, disse.
MAPA. 17/06/2020. CERIMÔNIA. Tereza Cristina lança Plano Safra 2020/2021 e destaca o papel fundamental do agro. Para a ministra, a agropecuária brasileira será um dos principais motores da retomada econômica após a Covid-19
Ao lançar o Plano Safra 2020/2021, nesta quarta-feira (17), a ministra da Agricultura, Pecuária e Abastecimento, Tereza Cristina, destacou o papel fundamental da agropecuária para o Brasil e para o mundo, especialmente neste momento de pandemia.
“A agropecuária é uma atividade nobre. Acredito que agora, depois de enfrentarmos essa pandemia, nós, brasileiros, saberemos valorizar mais quem está no campo e faz chegar à nossa mesa comida farta e de qualidade”, disse.
A ministra explicou que o Plano Safra é focado nos pequenos e médios produtores, que são os que mais precisam do suporte do Governo Federal. Ela também observou que a agropecuária cresceu 1,9% no primeiro trimestre de 2020, enquanto outros setores sofreram retração. Além de abastecer o mercado interno, o agro exportou 17,5% a mais em relação ao mesmo período de 2019.
“Esse cenário nos dá a convicção de que a agropecuária brasileira será um dos principais motores da retomada econômica após a Covid-19, que impôs uma situação dramática, nunca vista, em esfera global. Precisamos de esperança e otimismo para superarmos tudo isso e é nesse espírito que lançamos hoje o Plano Safra 2020-2021”, avaliou.
Discurso da ministra Tereza Cristina:
Presidente Jair Bolsonaro, colegas de governo, do Congresso, do agro, equipe do Mapa, meus queridos amigos e amigas,
Muito boa tarde a todos,
Este é sempre um dia muito especial para nós, o dia em que todos os anos nos reunimos para lançar o Plano Safra. Neste momento desafiador, pelo qual ainda passam o Brasil e o mundo, se torna ainda mais importante garantir a nossa próxima colheita, para que continuemos a bater recorde de produção de alimentos.
Em meio a tantas adversidades, temos de agradecer por conseguir manter a oferta de alimentos, em quantidade e qualidade, nas Ceasas, supermercados e feiras. Graças ao trabalho do agro, setor que sempre contou com o apoio total do presidente Jair Bolsonaro, e das áreas de transporte e logística, ministro Tarcísio, mantivemos o abastecimento em todo o país e honramos os compromissos com nossos parceiros comerciais.
Eu não me canso de dizer, e vou repetir hoje, que a agropecuária é uma atividade nobre. Acredito que agora, depois de enfrentarmos essa pandemia, nós, brasileiros, saberemos valorizar mais quem está no campo e faz chegar à nossa mesa comida farta e de qualidade.
Semear, plantar, cuidar, esperar florescer e enfim colher os frutos da terra é e sempre será algo essencial e belo. Uma atividade totalmente ligada à natureza só pode ter como caminho a busca da sustentabilidade. O incentivo à produção sustentável tem destaque neste Plano Safra, que vem com mais recursos e melhores condições de financiamento, a juros mais baixos.
Mais uma vez focado nos pequenos e médios produtores, que são os que mais precisam do suporte do governo federal, o Plano Safra 2020-2021 contará com R$ 236,3 bilhões, um aumento de R$ 13,5 bilhões em relação a 2019-2020.
Desse total, R$ 179,4 bilhões são para custeio e comercialização. E R$ 57 bilhões para investimentos nos diversos setores produtivos. São valores que foram corrigidos muito acima da inflação do período.
Destaco que 65% do crédito rural serão aplicados a taxas de juros controladas. Os pequenos produtores rurais terão R$ 33 bilhões para financiamento do Pronaf e os médios produtores rurais R$ 33,1 bilhões, por meio do Pronamp.
Para os produtores da agricultura familiar, os juros serão de 2,75% e 4,0% ao ano, os menores do Plano Safra. Como prometido, graças ao sucesso observado desde o ano passado, ampliamos para R$1,3 bilhão a subvenção ao prêmio do seguro rural, um acréscimo de 30% no valor.
Destacamos ainda que o Plano Safra 2020/21 mantém recursos – R$ 500 milhões – para o também bem-sucedido programa de construção e reforma de casas rurais.
Os investimentos cresceram em média 29% em inovação tecnológica, armazenagem, irrigação, agricultura e pecuária de baixa emissão de carbono.
O Plano Safra fortalece ainda a pesca comercial, financiando aquisição de equipamentos e infraestrutura, o armazenamento e o transporte de pescado.
O esforço do governo Jair Bolsonaro para viabilizar esse Plano Safra é um reconhecimento às conquistas e ao potencial do setor que está pronto para contribuir para a retomada econômica. Destacamos as boas previsões para este ano: um aumento da área plantada e a colheita de safra recorde de grãos, estimada em 250,5 milhões de toneladas (3,5% superior à safra anterior). É importante frisar ainda que a contratação de crédito rural na safra passada foi a maior já verificada, somando R$ 207 bilhões.
Observamos que, no primeiro trimestre de 2020, enquanto outros setores sofreram retração, a agropecuária cresceu 1,9%. Além de abastecer o mercado interno, o agro exportou 17,5% a mais em relação ao mesmo período de 2019, gerando ganhos para a balança comercial e preservando empregos e renda para os brasileiros.
Esse cenário, presidente, nos dá a convicção de que a agropecuária brasileira será um dos principais motores da retomada econômica após a Covid-19, que impôs uma situação dramática, nunca vista, em esfera global. Precisamos de esperança e otimismo para superarmos tudo isso e é nesse espírito que lançamos hoje o Plano Safra 2020-2021.
Como no ano passado, devo agradecimentos a muita gente! Em especial, ao ministro Paulo Guedes, ao presidente do Banco Central, Roberto Campos Neto, e ao presidente do BNDES, Gustavo Montezano. Gostaria de agradecer muitíssimo ao presidente do Banco do Brasil, Rubem Novaes, pelo apoio e parceria. O BB desembolsou na safra que estamos encerrando R$ 90 bilhões em crédito para produtores, cooperativas e empresas do agronegócio.Meu agradecimento se estende a toda equipe econômica, sempre disposta a ouvir o Ministério da Agricultura.
Quero fazer também um agradecimento à equipe do ministério, em especial ao Secretário de Política Agrícola Eduardo Sampaio, pelo esforço na construção deste Plano Safra. E muito obrigada, presidente, por ser, desde a primeira hora, um parceiro do agro. Sem o seu apoio e de todo o governo, não alcançaríamos esses bons resultados.
MAPA. 18/06/2020. POLÍTICA AGRÍCOLA. Com mais recursos e melhores condições de financiamento, Plano Safra 2020/2021 tem R$ 236,3 bilhões. Recursos vão garantir a continuidade da produção no campo e o abastecimento de alimentos no país durante e após a pandemia do novo Coronavírus
O governo federal lançou nesta quarta-feira (17), no Palácio do Planalto, o Plano Safra 2020-2021, com R$ 236,3 bilhões para apoiar a produção agropecuária nacional, um aumento de R$ 13,5 bilhões em relação ao plano anterior. Os financiamentos poderão ser contratados de 1º de julho de 2020 a 30 de junho de 2021. A cerimônia ocorreu no Palácio do Planalto, com a presença do presidente Jair Bolsonaro e da ministra Tereza Cristina (Agricultura, Pecuária e Abastecimento).
Do total, R$ 179,38 bilhões serão destinados ao custeio e comercialização (5,9% acima do valor da safra passada) e R$ 56,92 bilhões serão para investimentos em infraestrutura (aumento de 6,6%). Todos esses recursos vão garantir a continuidade da produção no campo e o abastecimento de alimentos no país durante e após a pandemia do novo Coronavírus.

Os recursos destinados aos investimentos cresceram em média 29%.
Durante o lançamento do Plano Safra, o presidente Jair Bolsonaro destacou que a produção agrícola não parou durante a pandemia, garantindo o alimento para toda a população brasileira. “Todos os países têm como objetivo a segurança alimentar. A cidade pode parar, mas se um dia o campo parar, todos sucumbirão”, disse Bolsonaro.
A ministra da Agricultura, Tereza Cristina, disse que o Plano Safra continua focado nos pequenos e médios produtores. Segundo ela, o incentivo à produção sustentável também tem destaque na safra 2020/2021, que vem com mais recursos e melhores condições de financiamento, a juros mais baixos. “Semear, plantar, cuidar, esperar florescer e enfim colher os frutos da terra é e sempre será algo essencial e belo. Uma atividade totalmente ligada à natureza só pode ter como caminho a busca da sustentabilidade”, destacou a ministra.
Ela também lembrou que, graças ao trabalho do agro e das áreas de transporte e logística, o Brasil manteve o abastecimento em todo o país e honrou os compromissos com seus parceiros comerciais. "O esforço do governo Jair Bolsonaro para viabilizar esse Plano Safra é um reconhecimento às conquistas e ao potencial do setor que está pronto para contribuir para a retomada econômica".
O secretário de Política Agrícola do Ministério da Agricultura, Eduardo Sampaio, disse que este é o maior Plano Safra já anunciado. “Representa um esforço grande do governo para proporcionar aos agricultores melhores condições. Também é a garantia de que os alimentos continuarão chegando à mesa dos brasileiros e de que o Brasil continuará sendo um grande exportador de alimentos”, disse.
Pequeno e médio produtor
Os pequenos produtores rurais terão R$ 33 bilhões para financiamento pelo Programa Nacional de Fortalecimento da Agricultura Familiar (Pronaf), com juros de 2,75% e 4% ao ano, para custeio e comercialização.
Para os médios produtores rurais, serão destinados R$ 33,1 bilhões, por meio do Programa Nacional de Apoio ao Médio Produtor Rural (Pronamp), com taxas de juros de 5% ao ano (custeio e comercialização). Para os grandes produtores, a taxa de juros será de 6% ao ano.

A subvenção ao Prêmio do Seguro Rural teve um acréscimo de 30% no valor, chegando a R$ 1,3 bilhão, o maior montante desde a criação do seguro rural. O valor deve possibilitar a contratação de 298 mil apólices, num montante segurado da ordem de R$ 52 bilhões e cobertura de 21 milhões de hectares.
Para incentivar a construção de armazéns nas propriedades, serão destinados R$ 2,2 bilhões. Para o financiamento de armazéns com capacidade de até 6 mil toneladas nas propriedades, a taxa de juros é de 5% ao ano.
Outro setor beneficiado será o da pesca comercial, que terá apoio para acessar o crédito rural. Desta forma, a atividade poderá financiar a compra de equipamentos e infraestrutura para processamento, armazenamento e transporte de pescado.
Sustentabilidade
O Plano Safra destaca linhas de crédito que contribuem para a sustentabilidade da agricultura. O Programa para Redução de Emissão de Gases de Efeito Estufa na Agricultura (Programa ABC), que é a principal linha para financiamento de técnicas sustentáveis, terá R$ 2,5 bilhões em recursos com taxa de juros de 6% ao ano, uma ampliação de R$ 400 milhões. Na safra 2020-2021, os produtores terão acesso à linha ABC Ambiental, com recursos para restauração florestal, voltada para contribuir com a adequação das propriedades rurais ao Código Florestal. A taxa de juros é de 4,5% ao ano.
A partir de 1º de julho de 2020, os produtores poderão financiar aquisição de cotas de reserva ambiental, medida aprovada pelo Conselho Monetário Nacional.
Também há incentivos à adoção de tecnologias relacionadas aos bioinsumos dentro das propriedades rurais e pelas cooperativas. Os produtores podem acessar pelas modalidades de custeio, para aquisição de bioinsumos, ou investimento, na montagem de biofábricas dentro das propriedades (onfarm). Os recursos estão previstos no Inovagro e, no caso dos investimentos em biofábricas, podem chegar a 30% do valor de todo o financiamento. Para as cooperativas, as linhas de crédito é o Prodecoop, para a aquisição de equipamentos para a produção dos bioinsumos.
Outra novidade é o Pronaf-Bio, voltado para apoiar as cadeias produtivas da bioeconomia.

Inovação
No Plano Safra 2020/2021, está disponível financiamento para aquisição de equipamentos de monitoramento climatológico, como estações meteorológicas e softwares, e de monitoramento da umidade do solo. Os financiamentos poderão ser feitos pelo Programa de Incentivo à Irrigação e à Produção em Ambiente Protegido (Moderinfra).
A pecuária também terá apoio financeiro por meio do Programa de Incentivo à Inovação e Tecnológica na Produção Agropecuária (Inovagro). Os pecuaristas poderão financiar a aquisição de equipamentos e serviços de pecuária de precisão.
Os setores da pecuária bovina e bubalina, de leite e de corte também estão contempladas nos financiamentos para automação, adequação e construção de instalações.
Agricultura Familiar
Os agricultores familiares poderão continuar usando o crédito para financiar e reformar casas rurais. Nesta safra, os recursos para este fim somam R$ 500 milhões.
O filho ou filha do agricultor familiar, que possua Declaração de Aptidão (DAP) da sua unidade familiar, poderá também solicitar financiamento para construção ou reforma de moradia na propriedade dos pais.
No Programa de Garantia de Preços para Agricultura Familiar (PGPAF), o bônus de desconto será elevado para as operações de custeio e de investimento.
Nos investimentos coletivos para atividades de suinocultura, avicultura, aquicultura, carcinicultura (criação de crustáceos) e fruticultura, o limite por beneficiário foi ampliado.
Assistência Técnica
Os agricultores familiares e os médios produtores poderão financiar atividades de assistência técnica e extensão rural, de forma isolada, por meio do Pronaf e Pronamp, respectivamente.
APRESENTAÇÃO: https://www.gov.br/agricultura/pt-br/assuntos/noticias/com-mais-recursos-e-melhores-condicoes-de-financiamento-plano-safra-2020-2021-tera-236-bilhoes/ApresentacaoPlanoSafra2020213.pdf
INDÚSTRIA
CNI. 19/06/2020. Atividade industrial em maio teve desempenho menos negativo, aponta CNI. Sondagem Industrial mostra que o desempenho da indústria no mês passado ainda está muito baixo, mas começa a se afastar do pior momento da crise provocada pelo novo coronavírus

O desempenho da indústria foi menos negativo em maio do que em abril deste ano. A Sondagem Industrial, da Confederação Nacional da Indústria (CNI), divulgada nesta sexta-feira (19), mostra que os índices que medem o desempenho da indústria começam a se distanciar dos piores momentos da crise provocada pelo novo coronavírus, embora a atividade industrial ainda continue em queda.
A pesquisa foi realizada entre 1º e 10 de junho, com 1.859 empresas, sendo 724 pequenas, 663 médias e 472 grandes, e mostra que o pessimismo se reduziu de forma significativa neste mês, e aparece de forma menos intensa e disseminada que nos meses de abril e maio deste ano.
A produção e o emprego sofreram novas quedas no mês de maio na comparação com o mês anterior, ainda sob os efeitos da pandemia de Covid-19. Mas a queda é menor. O índice de evolução da produção subiu de 26 pontos em abril deste ano para 43,1 pontos em maio. O fato de estar abaixo de 50 pontos indica queda e quanto mais próximo de 50, menor e menos disseminada é a queda. Nessa metodologia, o índice varia de 0 a 100. Só há crescimento quando os dados aparecem acima de 50.
O número de empregados atingiu 42 pontos no mês passado, ante 38,2 pontos no mês anterior. A capacidade instalada da indústria cresceu seis pontos percentuais entre os meses de abril e maio, alcançando 55%. Apesar do aumento, o percentual é o segundo menor para toda a série histórica, iniciada em 2011, e se encontra 12 pontos percentuais abaixo do nível registrado no mesmo período de 2019. O índice de evolução dos estoques ficou em 46,2 pontos, apontando para uma significativa redução dos estoques.
A pesquisa mostra que os empresários seguem projetando queda de demanda, exportações, compras de matérias-primas e número de empregados nos próximos seis meses. Mas o sentimento de forte pessimismo, observado nos dois meses anteriores, diminuiu tanto quanto à sua disseminação quanto em intensidade.
Setores de limpeza, higiene e farmacêutico apresentaram aumento da produção em maio
Os setores de biocombustíveis, produtos de limpeza, perfumaria e higiene pessoal, e produtos farmoquímicos e farmacêuticos apresentaram aumento de produção em maio. Também são setores que apresentaram evolução do número de empregados menos negativa que a dos demais e Utilização da Capacidade Instalada (UCI) efetiva mais próxima ao usual.
No outro extremo os setores impressão e reprodução de gravações, couros e artefatos de couro, calçados e suas partes, e vestuário e acessórios seguem com o pior desempenho, com quedas mais acentuadas da produção e do número de empregados, além de UCI efetiva muito distante do usual.
Sondagem Industrial. Impacto da pandemia ainda é severo, mas menos intenso que em abril
Os impactos da crise causada pela pandemia na atividade industrial ainda foram severos em maio. O desempenho da indústria ainda é bastante negativo, mas a queda na produção foi menos intensa e a UCI voltou a subir.

DOCUMENTO: https://bucket-gw-cni-static-cms-si.s3.amazonaws.com/media/filer_public/75/6d/756d0a08-7846-4732-9164-5b4478c73c9c/sondagemindustrial_maio2020.pdf
INFLAÇÃO
IPEA. 19/06/2020. Ipea prevê inflação de 1,8% para 2020. Diante dos impactos da pandemia, pesquisadores revisaram para baixo a projeção para este ano
O Instituto de Pesquisa Econômica Aplicada (Ipea) divulgou nesta sexta-feira, 19, a previsão para a inflação em 2020. Em razão da retração da economia, resultante da pandemia de Covid-19, a projeção é de alta de 1,8% dos preços ao consumidor, 1,1 p.p abaixo dos 2,9% previstos anteriormente, em março deste ano. A grande contribuição para a queda do IPCA ao longo dos últimos meses veio da retração dos preços administrados, cuja inflação em 12 meses recuou de 4,4% para -1,0%, entre março e maio.
Em contrapartida, os preços dos alimentos em domicílio mostram aceleração nos últimos meses, refletindo a desvalorização cambial e o aumento da demanda por alimentos, provocado por mudanças no padrão de consumo das famílias no período recente. A inflação desses produtos chegou a 8,1% nos 12 meses encerrados em maio, com destaque para o reajuste das carnes (19%) e das aves e ovos (13%). Para os próximos meses, entretanto, espera-se uma desaceleração deste ritmo de elevação dos preços, de modo que, os alimentos devem deve encerrar 2020 com alta de 3%.
Além dos alimentos, outro segmento que parece ter sido impactado pela pandemia é o de produtos de informática. Em maio, a alta registrada neste conjunto de itens foi de 4,6%, impulsionada, provavelmente, pelo aumento da demanda dado a adoção do teletrabalho em diversos setores da economia.
Para 2020, as expectativas de inflação para os bens de consumo e os serviços livres estão balizadas em uma demanda ainda enfraquecida, o que limitará aumentos expressivos de preços. No caso dos bens de consumo, a alta esperada é 1%. Já para os serviços, a taxa prevista é de 2,2%, repercutindo uma desaceleração mais intensa nos segmentos ligados ao turismo.
No caso dos preços administrados, a previsão é de alta de 1,2% em 2020. Mesmo diante de uma aceleração ao longo do segundo semestre, provocada pelo fim das deflações dos combustíveis e pela implementação dos reajustes já programados para as tarifas de energia elétrica (em diversas capitais) e dos medicamentos, este conjunto de preços deverá encerrar o ano com taxa de inflação bem abaixo das registradas em 2019 (5,5%) e 2018 (6,2%).
Para 2021, com a expectativa de retomada da atividade econômica, a taxa estimada para o IPCA é de 3,1%, ainda abaixo da meta.
Inflação. Por Maria Andréia P. Lameiras e Marcelo L. de Moraes
A crise provocada pela pandemia da Covid-19 está tendo um significativo impacto deflacionário, especialmente nos setores mais afetados pelo isolamento social – serviços e bens de consumo duráveis. As fortes deflações registradas pelo Índice de Preços ao Consumidor Amplo (IPCA) em abril e maio já dão indícios de que a taxa de inflação projetada para 2020 ficará abaixo da esperada no trimestre anterior. Adicionalmente, a expectativa de uma retomada gradual da demanda, aliada à capacidade ociosa presente na maioria dos setores produtivos e à redução dos custos de mão de obra e aluguéis, deve manter uma trajetória bem comportada para os preços dos serviços e bens livres. Dentro desse contexto, a projeção do Grupo de Conjuntura da Dimac/Ipea é de a inflação (medida pelo IPCA) encerrando o ano em 1,8%, o que representa uma redução de 1,1 ponto percentual (p.p.) em relação à última taxa projetada (2,90%) na visão geral da Carta de Conjuntura de março deste ano.
DOCUMENTO: https://www.ipea.gov.br/cartadeconjuntura/index.php/2020/06/inflacao-18/
DIPLOMACIA
PR. MRE. DIPLOMACIA. 18/06/2020. Novas embaixadoras da França e do Vietnã apresentam cartas credenciais ao presidente. A carta é o instrumento diplomático que formaliza o envio de um embaixador ao país de acolhimento
O presidente Jair Bolsonaro recebeu, nesta quinta-feira (18), as recém-nomeadas embaixadoras da França e Vietnã em cerimônia de entrega de cartas credenciais no Palácio do Planalto.
As novas embaixadoras são Brigitte Collet e Pham Thi Kim Hoa, da França e Vietnã, respectivamente. O presidente recebeu as embaixadoras e falou rapidamente de pautas de interesse dos países, além de dar as boas-vindas às duas.
A carta credencial é uma carta formal enviada de um Chefe de Estado para outro, que formaliza o envio de um embaixador do país de origem ao país de acolhimento.
COLOMBIA
MRE. DCOM. NOTA-65. 18 de Junho de 2020. Libertação, pelo Exército colombiano, de cidadão brasileiro sequestrado
No dia de hoje, o Governo brasileiro recebeu, com satisfação, a notícia de libertação, pelo Exército colombiano, de um cidadão brasileiro, que se encontrava sequestrado desde 19 de março do ano corrente na região do Cauca, Colômbia. Foi libertado igualmente um cidadão suíço.
Ao agradecer os esforços das autoridades colombianas, o Governo brasileiro parabeniza as forças policiais e militares da Colômbia pela operação em questão.
A Embaixada do Brasil em Bogotá acompanhou o caso desde o início, em coordenação com as autoridades colombianas e a Embaixada da Suíça.
MRE. DCOM. PORTAL G1. 18/06/2020. Exército da Colômbia resgata brasileiro sequestrado. Cidadão suíço também foi libertado. Segundo agência, sequestradores faziam parte de grupo ligado a guerrilheiros dissidente das Farc.
/i.s3.glbimg.com/v1/AUTH_59edd422c0c84a879bd37670ae4f538a/internal_photos/bs/2020/B/R/3mUSeBS3mhRsesIo4Whw/000-1tp14j.jpg)
Foto distribuída pelo Exército Colombiano mostra o suiço Daniel Max Guggenheim (centro) e o brasileiro José Ivan Albuquerque (direita) em helicóptero, após terem sido libertados, em Bogotá, na quinta-feira (18) — Foto: Colombian National Army/AFP
O exército colombiano anunciou nesta quinta-feira (18) a libertação de um brasileiro que tinha sido sequestrado há três meses na Colômbia. Um cidadão da Suíça também foi resgatado. Segundo a agência France Presse, os sequestradores supostamente faziam parte de uma facção envolvida com a guerrilha local.
Ambos foram resgatados durante operação militar no departamento de Cauca, no sudoeste do país, uma das áreas mais atingidas pela violência financiada pelo tráfico de drogas. O Ministério das Relações Exteriores brasileiro confirmou o resgate.
De acordo com a AFP, citando o grupo de resgate do exército colombiano, os dois homens caíram nas mãos da facção "Coluna Móvel Dagoberto Ramos" em 16 de março — o Itamaraty diz que o sequestro ocorreu em 19 de março.
Os militares capturaram em flagrante um dos supostos sequestradores que tinha como função a custódia dos reféns, diz o comunicado militar.
Dissidência das Farc
Segundo a AFP, a facção faz parte das chamadas dissidências das Farc, a guerrilha de orientação marxista que entregou suas armas em 2016, depois de mais de meio século de conflito, com dezenas de milhares de vítimas civis. Embora o grupo tenha se retirado da luta armada, algumas frentes retomaram as atividades guerrilheiras nos últimos anos.
_________________
LGCJ.: