US ECONOMICS
CORONAVIRUS
U.S. Department of State. 05/11/2020. Secretary Michael R. Pompeo’s Videoconference with Partners on COVID-19
The following is attributable to Spokesperson Morgan Ortagus:
Secretary of State Michael R. Pompeo spoke with the Foreign Ministers of Australia, Brazil, India, Israel, Japan, and the Republic of Korea today via videoconference. Secretary Pompeo and his counterparts discussed the importance of international cooperation, transparency, and accountability in combatting the COVID-19 pandemic and in addressing its causes. They also discussed collaboration toward preventing future global health crises, reaffirming the importance of the rules-based international order.
U.S. Department of State. 05/11/2020. Secretary Michael R. Pompeo’s Call with Swiss Foreign Minister Cassis
The following is attributable to Spokesperson Morgan Ortagus:
Secretary of State Michael R. Pompeo spoke today with Swiss Foreign Minister Ignazio Cassis. Secretary Pompeo and Foreign Minister Cassis committed to deepening the ongoing U.S.-Swiss partnership to combat the coronavirus pandemic. The Secretary also thanked the Foreign Minister for Switzerland’s continued and constructive role as our protecting power in Iran and for its assistance in repatriating U.S. citizens from Iran and Myanmar.
U.S. Department of State. 05/12/2020. Transatlantic Cooperation on COVID-19
As President Trump has said, the United States is working with our friends and partners around the world to coordinate our efforts on stopping the spread of the COVID-19 pandemic. The United States values our cooperation with allies and partners in combatting the pandemic and in planning for our collective recovery. In addition to the leadership of the President and Secretary of State with their G7, G20, NATO and other counterparts, Deputy Secretary of State Stephen E. Biegun has led weekly deputy minister-level coordination calls with Transatlantic Allies and partners since March 19, including the European Commission.
These calls have allowed the United States and our Transatlantic Allies and partners to share ideas and best practices in responding to the unique and complex challenges presented by the global pandemic and plan for safely re-opening our economies and commerce. Through collaboration among Transatlantic partners, we have:
- Enabled hundreds of thousands of citizens of our respective countries to return home their families and loved ones, even as borders have closed and commercial flight options have disappeared;
- Facilitated the maintenance of critical supplies of vital protective equipment and medical supplies to strengthen our respective public health systems’ abilities to respond to and combat the pandemic;
- Ensured that foreign citizens employed in essential economic sectors in our respective countries have been able to continue working;
- Identified countries most vulnerable to the effects of the pandemic and coordinated on how best to support them;
- Collaborated on strengthening the rules-based international order, universal rights, and international peace and security against efforts to undermine them through disinformation and other means;
- Identified opportunities in multilateral meetings and fora to respond to and address challenges the pandemic has posed, including the G7 and G20; and
- Shared best practices on how free and open societies can respond and combat the pandemic while continuing to uphold democratic principles.
As we begin to re-open our societies and restart the global economy, the United States and our Transatlantic partners, through bilateral and multilateral efforts, will continue to collaborate on:
- Sharing best practices and lessons learned as our societies, businesses, and governments return to work;
- Mitigating the effects of border closures and diminished transportation links on global supply chains;
- Maintaining necessary aviation and transportation links to allow essential movement of people and cargo;
- Efforts to develop vaccines, diagnostics, and therapeutics and once developed, make them available, accessible, and affordable to all;
- Promoting transparency and the timely sharing of public health data and information with the international community to address emerging diseases and potential global health threats;
- Discussions on the use of multilateral institutions and fora to strengthen the global response to the pandemic and future crises;
- Actions to reenergize global growth and economic prosperity;
- Global assistance efforts to help vulnerable countries, particularly in Africa, strengthen their health systems and respond to the pandemic and its economic impact; and
- Strengthening democratic governance, universal rights (including freedom of the press and freedom of expression), and the rules-based international order and countering efforts by those who seek to undermine these principles through disinformation and coercion.
The United States and our Transatlantic partners welcome coordination with partners and international organizations who share our common objectives and principles and are capable of contributing to our efforts to foster global peace, security, and prosperity.
U.S. Department of State. 05/12/2020. North American Cooperation on COVID-19
As President Trump has said, the United States is working with our friends and partners around the world to coordinate our efforts on stopping the spread of the COVID-19 pandemic. The United States values our cooperation with allies and partners in combatting the pandemic and in planning for our collective recovery. In addition to the leadership of the President and Secretary of State with their G7, G20, and other counterparts, Deputy Secretary of State Stephen E. Biegun has led weekly coordination calls since March 19 with Canadian Deputy Minister Marta Morgan and Mexican Deputy Secretary Julian Ventura, as part of our close partnership as neighbors.
These calls have allowed the United States, Canada, and Mexico to discuss challenges and share best practices in responding to the unique and complex challenges presented by the global pandemic and planning for safely re-opening our economies and commerce. Through collaboration among North American partners, we have:
- Enabled tens of thousands of citizens of our respective countries to return home from around the world to their families and loved ones, even as borders have closed and commercial flights options have in many cases disappeared;
- Facilitated the maintenance of critical supplies of vital protective equipment and medical supplies to strengthen our respective public health systems’ abilities to respond to and combat the pandemic;
- Ensured foreign citizens employed in essential economic sectors in our respective countries have been able to continue working under clear sanitary guidelines;
- Identified opportunities in multilateral meetings and fora to respond to and address challenges the pandemic has posed, including the G7 and G20;
- Exchanged views on the unprecedented challenges posed to diplomatic work by the pandemic, and;
- Shared best practices on how free and open societies can respond and combat the pandemic while continuing to uphold democratic principles.
As we begin to re-open our societies and restart the global economy, the United States and our North American partners will continue to collaborate on:
- Sharing best practices and lessons learned as our societies, business, and governments return to work;
- Mitigating the effects of border closures and diminished transportation links on global supply chains;
- Maintaining necessary aviation and transportation links to allow essential movement of people and cargo;
- Efforts to develop vaccines, diagnostics, and therapeutics and once developed, make them available, accessible, and affordable to all;
- Strengthen the ability of multilateral institutions and fora to respond to the pandemic and future crises;
- Actions to bolster North American competitiveness, and reenergize global growth and economic prosperity.
The United States and our North American partners welcome coordination with partners and international organizations who share our common objectives and principles and are capable of contributing to our efforts to foster global peace, security, and prosperity.
U.S. Department of State. 05/12/2020. Secretary Pompeo’s Call with Estonian Foreign Minister Reinsalu
The below is attributable to Spokesperson Morgan Ortagus:
Secretary of State Michael R. Pompeo spoke with Estonian Foreign Minister Urmas Reinsalu today. Secretary Pompeo and Foreign Minister Reinsalu discussed cooperative efforts in the UN Security Council aimed at preventing conflict and promoting peace worldwide, the 2020 Three Seas Initiative Summit, and the importance of Transatlantic cooperation in combatting COVID-19.
THE WHITE HOUSE. May 11, 2020. HEALTHCARE. Remarks by President Trump in a Press Briefing on COVID-19 Testing. Rose Garden
THE PRESIDENT: We’re here today to provide an update on the unprecedented testing capacity developed by the United States — the most advanced and robust testing system anywhere in the world, by far. This afternoon, I’ll also announce new steps that we’re taking to make tests even more widely available.
To battle a virus, my administration marshaled every resource at our nation’s disposal: public, private, military, economic, scientific, and industrial — all at your disposal. We launched the largest manufacturing ramp-up since the Second World War. There’s been nothing like it since.
At the center of this industrial and scientific mobilization was the development of our coronavirus testing capabilities. In the span of just a few short months, we’ve developed a testing capacity unmatched and unrivaled anywhere in the world, and it’s not even close. This is a core element of our plan to safely and gradually reopen America. And we’re opening, and we’re starting, and there’s enthusiasm like I haven’t seen in a long time.
Every American should be proud of the amazing array of talent, skill, and enterprise our nation has brought to this challenge. In three months, the FDA has authorized more than 92 different tests, and over 9 million have been performed here in the United States. Three weeks ago, we were conducting roughly 150,000 tests per day. Now we’re doing approximately 300,000 tests per day — a 100 percent increase — and it will go up substantially from that number.
This week, the United States will pass 10 million tests conducted — nearly double the number of any other country. We’re testing more people per capita than South Korea, the United Kingdom, France, Japan, Sweden, Finland, and many other countries — and, in some cases, combined.
On Friday, the FDA authorized coronavirus antigen tests, an alternative testing technology that can be much more readily manufactured. Quidel Corporation, which makes this newly authorized point-of-care test, estimates that it will be able to manufacture 150,000 tests per day, immediately increasing to 300,000 tests per day within just a few weeks.
To further expand our nation’s testing capabilities, this afternoon I am announcing that my administration is — and that we’ve got this all approved; it’s all done — is sending $1 billion to America’s states, territories, and tribes. So this has all been approved. We’ve gotten it done, completed. The money is going out. This major investment will ensure that America continues to conduct more tests than any country on Earth by far.
I said from the beginning that the federal government would back up the states and help them build their testing capability and capacities, and that’s exactly what’s happened. This partnership has truly flourished. We have really had a very good relationship with the states and the governors and other representatives within the states — a relationship like, I think I can honestly say, has not been seen in this country for many, many years.
The governors and us are working together very closely not only on testing, but on ventilators, where we have a capacity that’s, at this point, virtually unlimited. And we’re sending ventilators — as you probably heard from other countries, we’re sending many, many thousands of ventilators to other countries because they’re in tremendous need. And I think building up a lot of goodwill, but much more importantly than that, we’re saving a lot of lives.
Most states are now doing a great job. My administration located 5,000 machines in 700 labs across all 50 states, and governors have learned how to maximize these testing resources.
The federal government is also supporting states with vital supplies, quick approvals of new tests, and one-on-one coaching from the team here at the White House on how to increase capacity and increase it very quickly.
In recent weeks, we’ve held multiple conference calls with every state, as well as with D.C. and Puerto Rico. We jointly developed testing projections and goals for each state for the month of May, altogether totaling 12.9 million tests. Think of that: 12.9 million tests.
Today, I’m announcing that my administration will provide the collection supplies to help states meet their targets and meet them rapidly.
During the month of May, FEMA and HHS will be delivering 12.9 million swabs to states nationwide. We already have them; the delivery will be very quick. We’re prepared to provide millions of additional swabs if any state is on a pace to surpass its goal. And their goals are very high. We’ve set them very high, and we’ve told them to set them very high.
My administration will also provide approximately 9 million transport media, which are used to transfer swabs to the lab processing. A complicated process, but we’ve made it simple. As a result of these actions, every single state will be able to test more people per capita in May alone than South Korea has tested in four months since the outbreak began.
This major commitment is possible because of the massive mobilization of American industry, including Puritan Medical Products, U.S. Cotton, Abbott Labs, and Thermo Fisher. Some of these incredible companies produced and produce rapidly for us, and their products are here with us this afternoon. These are all different products that were literally just developed, and — if you can imagine that. And these are the best machines and the best equipment anywhere in the world. And other countries are calling us, and we’re trying to work as much as we can, not only on ventilators, but also with testing.
My administration also continues our tireless effort to expand testing in the most underserved communities. Through our partnership with the private sector, leading pharmacies and retailers are now operating over 240 testing sites across the country, and that’s in addition to all of the other sites that we have working. Seventy percent of these sites are located in communities with unique vulnerabilities.
There will be more than 300 sites by the end of this week, and retailers are making plans to open up hundreds and hundreds more locations within the next 30 days. These additional sites are helping us ensure access to testing in every community. My administration is fighting relentlessly to protect all citizens of every color and creed from this terrible virus, the invisible enemy.
In addition to vast amounts of testing supplies, my administration has partnered with the private sector to coordinate the delivery of more than 90 million N95 masks, and these are of the highest quality — many are made right here in the United States, a capacity we didn’t have at all at the beginning — 126 million surgical masks — likewise, many are made here; 9 million face shields; 21 million surgical gowns; 993 million gloves; and 10,690 ventilators. We’re building thousands of ventilators in numerous plants all across our country. It’s incredible, actually.
This global pandemic has inflicted great pain and hardship on our people. It should have never been allowed to happen. It should have been stopped at the source. We mourn for every life the virus has claimed, and we share the grief of all of you who have lost a loved one — and that goes worldwide, too. Many, many countries — 184 countries, at least.
Thanks to the courage of our citizens and our aggressive strategy, hundreds of thousands of lives have been saved. And we have saved — and if you look at on a per-100,000 basis, we’re at the best part of the pack, right on the bottom. Germany and us are leading the world. Germany and the United States are leading the world — lives saved per hundred thousand.
In every generation, through every challenge and hardship and danger, America has risen to the task. We have met the moment, and we have prevailed. Americans do whatever it takes to find solutions, pioneer breakthroughs, and harness the energies we need to achieve a total victory.
Day after day, we’re making tremendous strides. With the dedication of our doctors and nurses — these are incredible people, these are brave people, these are warriors — with the devotion of our manufacturing workers, food suppliers, and lab technicians, and with the profound patriotism of the American people, we will defeat this horrible enemy, we will revive our economy, and we will transition into greatness. That’s a phrase you’re going to hear a lot because that’s what’s going to happen.
We’re going into the third quarter, and we’re going to do well. In the fourth quarter, we’re going to do very good. And next year, I think we’re going to have one of the best years we’ve ever had because there’s a tremendous pent-up demand. It’s a demand — and I’m feeling it. I’ve felt things a lot over my life, and I’ve made a lot of good calls. It’s a demand like I don’t think I’ve ever seen. There’s a pent-up demand. There’s a — there’s a spirit of this country like few have seen. And I think you can say — and we’ve helped a lot of the countries a lot. Really, a lot. There’s a tremendous spirit all over the world to beat this terrible, terrible thing.
But we’re transitioning to greatness, and the greatness is going to be in the fourth quarter, but it’s really going to be next year, and it’s going to be a year like we’ve never had before. I really believe that. As good as we’ve done — and we’ve done great; we had the best economy in the history of the world, not just here, but anywhere in the world. You can talk China, you can talk any other country, we had the best economy anywhere in the world.
And we were going for numbers, whether it was unemployment numbers, where we had our best numbers; employment, also, numbers — a little different — where we had our best numbers, almost 160 million people. All of that — we had the greatest stock market numbers ever. I think we had 142 days where we set records in a short period of time. A hundred and fifty-two days we set records in the stock market. We rebuilt our military, all built in the United States. All of our equipment built — $1.5 trillion plus.
On the southern border, the wall is being built. It’s being built rapidly. And now you don’t hear the opponents talking too much about the border. They don’t like to talk about it because it seemed that we were right on a lot of things. One of the things we were right about — one of the many things was the border. We have a very powerful border. Now, we had one of the best weeks in the history of our border, between the United States and Mexico — our southern border. We have very few people coming in — very, very few. Almost record low numbers.
And the wall is being built. It’s up to 181 miles already. It’s being built. It’s being built rapidly. People don’t talk about it anymore because it’s very successful. In the area where the wall has built — that is a lot still, but we want to be up to 450 by a very short period of time. Early next year, we should be up to 450. And very shortly after that, over 500 miles to be completed.
But it’s had a tremendous impact. But again, we’ve had the best numbers. The last thing we want now with this pandemic is for people to come across our southern border. And again, we’re doing record numbers, meaning record low numbers.
So I just want to thank everybody, and I want to introduce Admiral Giroir — if you could, please come up — and Brad, if you would — Brad Smith. And they’re going to do a little explaining as to what we’ve done with regard to testing and how successful it’s been. And then we’ll take some questions after that.
Thank you very much.
ADMIRAL GIROIR: Well, thank you, Mr. President, for your leadership and for your high expectations that really made this all come together and for the uniform support of everyone in the White House and the administration. And thank you, Secretary Azar, for providing his leadership at HHS and allowing both Brad and I the opportunity to work on this project.
I think it’s clear that America does lead the world in testing. I’ll go through some of the charts that show that we lead quantitatively. I will also suggest that we lead in the diversity of tests, which are very important to establish the testing ecosystem to keep America safe. And clearly, as we’ve said multiple times, no one beats America when it comes to quality.
So let’s start potentially with the next slide.
This may be hard to see, but if you look at the line on top, that’s the total numbers of tests done by the United States. No other country in the world comes close to the total numbers. Again, as the President has said, today we will top over 9 million tests. And if you look at per capita — everyone talks about South Korea being the standard — today, we will have done more than twice the per capita rate of testing that was accomplished in South Korea. No matter how you look at it, America is leading the world in testing.
And how did we get there? Let’s look at the next slide. Next slide please.
A very important component of how we came to this point was the authorization by the FDA, under the leadership of our Secretary, of many different diagnostic tests, of diagnostic devices, and now of serology tests.
So you’ve heard a lot about the different testing and you see some of the machines up here. Most of the diagnostic tests — all but one — rely on the amplification of the viral RNA, the viral genetic material. And we’ve talked to you about the diversity of tests. There are very high-throughput tests that are done at big reference labs like LabCorp and Quest. But very importantly, there are also tests — and you heard us talk about Cepheid, delivering over 2 million tests vitally important to rural America’s — and to places that do not have very large infrastructure.
You’ve also seen the Abbott tests we’ve talked about — there it is on the left of the President — delivering about 1.4 million tests as a point-of-care test. You get the result within 5 to 15 minutes. And we have deployed over 235,000 of these tests to the state public health laboratories in every state of this country to make sure that that point-of-care testing capability is there to research outbreaks, like in nursing homes or in certain industrial capacities, and well over 90,000 to the Indian Health Service, so they could test at a point of care in remote locations.
The President also talked about a new first-in-class test; it’s listed there as an antigen-based test. This is very important — and you’ve heard Ambassador Birx talk about this multiple times — because antigen testing, although complex, is much less complex than the nucleic acid testing that we’ve had.
Quidel had this authorized by the FDA. And as the President said, we’ll soon be making over 300,000 tests per day. Do the math. That’s 9 million point-of-care tests that we will have every month in just a few weeks. It will clearly add to and, to a certain degree, transform our landscape.
What you don’t see up here is the important work the FDA did. I’m a swab guy now. I’m very interested in swabs. In order to make all these tests work, you have to show that a certain swab, made of a certain material, performed in a certain way, delivers a highly accurate result.
And what you’re seeing up here is some of the fruits of that labor. Without the authorizations of, for example, the foam nasal swab, we would be blowing through PPE all across the country because of the need for full PPE just to take a test. That has really been changed by this diverse authorization and a recent authorization that allows the great manufacturer, U.S. Cotton, to join our foundational industry of Puritan.
Next slide.
Last week, we did over 1.9 million tests, and that number is growing. And again, as the President said and Brad will talk about, our states aspire to do well over 12 million tests over the next four weeks.
You see the graph growing. What you also see very importantly is that little orange bar on the bottom is the cumulative number of positives. Our percent positives are going down, and that’s what we want to see. In fact, in 31 states as of last night, the positivity rate is less than 10 percent, which is not a litmus test, but is a good idea that we’re doing plenty enough testing that we can enter phase one for careful reopening.
I also want to take the opportunity to say this doesn’t happen by accident. I’m seeing everyone in the audience here, and I’m so pleased that they can be here. People sitting in the front have been working, literally, 18 to 20 hours a day, every single day of the week, for at least the past two months. None of this happens by accident. It happens because their hard work, their sacrifice, their sacrifice to their family all for a common good. And I’m very, very honored to consider you all as my colleagues.
And my last slide, as the President said, $11 billion are now being announced to be delivered to the states for the sole support of testing. This will give them the resources to partner, as they have, with the federal government, with the President, the Vice President, the task force, with Brad and I, to achieve their testing goals. And we’re going to be very specific, and they know it, that there needs to be minimum numbers to be planned to test. They have to have plans for their vulnerable communities, including nursing homes, including those who are disabled, including those who are in prisons or who have working environments that they may have a more likelihood to spread the infection.
And combined with that, the Secretary’s Office of Minority Health will soon be awarding a large contract to guarantee a national network of state, local, and community-based organizations to assure that those underserved, particularly racial and ethnic minorities, are linked to the services that they need — not only testing, but in care as well.
And with that, I’d like to hand it over to Brad Smith, who’s the Director of the Center for Medicare and Medicaid Innovation, but has really been the chief operating officer to make all of this come together.
Brad.
MR. SMITH: Thank you, Admiral. I want to talk through a little bit, specifically the work that we’ve been doing with the states.
So, as the Admiral mentioned, over the past few weeks, we’ve been working with each state to set a target for their testing goal for May. With — over the series of a couple of different calls, we’ve aligned on what those goals are. And as the Admiral mentioned and the President mentioned, they add up to over 12.9 million tests in the month of May.
For every state, this is greater than 2 percent of their population in the entire state being tested in May, and for many states, it’s a much higher number than that. When you compare this, as the President mentioned, to South Korea, South Korea is actually below that 2 percent not for a month, but for their total tests to date since the start of the year. And so our states have come together to set really ambitious goals that we’re excited to support them in meeting.
If you go to the next slide. As I talked about last time in the press briefing, there are really three parts to making sure that tests can happen. The first part is the specimen collection supplies, the second part is the machines, and the third part are the lab supplies that the machines need to run. And what we’ve been working to do is to make sure that each state has all three of those parts to be able to conduct the number of tests.
The first part is the specimen-collection supplies. The commercial market today is providing a large number of these supplies already to states and already to hospitals, but we wanted to ensure that every state had more than what they needed to be able to conduct the number of tests they’re aiming in May. So what we’ve done is we’ve purchased enough tests to support the state testing goals for May and June. So we will be sending more than 12.9 million swabs and over 10 million media to the states over the course of May, and a similar or greater number over the course of June.
In addition, we have several million in reserve. So if states are able to exceed their goal in third and fourth week of May, we can provide them even more swabs and transport media. And again, this is in addition to what’s already available on the commercial market.
If you go to the next slide. There are large numbers that have been talked about many times — a large number of testing machines across the country, over 5,000 different machines that can conduct these tests. The key part is making sure that the machines and that the labs have enough supplies to run the machines. There will be, in the month of May, commercially produced, over 25 million test kits, which is either the PCR and extraction kits or the cartridges, to be able to support tests in their effort — states in their testing effort.
And what we’ve been working to do with each state is understand their total goal. And each of the manufacturers has been a great partner with us and told us how many tests they’re shipping to each lab in each state over the course of May. And what we know is that, in the aggregate, the number of test kits the state is getting is greater than their testing goal for the month of May.
In addition to what the states have already purchased, there’s over 7 million additional tests that remain unpurchased — the majority of those from Thermo Fisher, which is the most common machine in the country. So we feel very confident that states will not only have the specimen-collection supplies and the machines, but also the extraction kits and the reagents they need to be able to hit or potentially exceed their testing goals.
And if you go to the last slide. The last piece of the puzzle is making sure that Americans have access to these tests. Healthcare providers, hospitals, primary care physicians are already providing these tests today. And we, for the past six or seven weeks, have been partnering with the retailers who have massively been ramping up their effort.
Today there are over 240 retail sites. We’ve been working with the retailers to make sure that they’re specifically targeting low-income and other vulnerable communities across the country, and we are talking with them about potentially opening more than another thousand additional sites over the next month or two.
So we hope that we’ve put together the right pieces of the puzzle: having access points for patients and Americans across the country, having the specimen-collection supplies needed to take the test, having the machines, and then also having the lab testing supplies with the machines.
So, thank you very much.
THE PRESIDENT: Thank you very much, Brad. And maybe you’ll both stay there. Could be some questions.
Okay. Please, John. Go ahead.
Q We had a situation here at the White House on Friday, where a member of the Vice President’s staff tested positive for coronavirus, which has now caused three of the top U.S. officials involved in the coronavirus response to self-isolate. A two-part question: Where did the system break down to allow that to happen? And where — what would you say to employers who look at the experience here at the White House and say, “Are we ready for this?”
THE PRESIDENT: I don’t think the system broke down at all. One person tested positive, surprisingly, because, the previous day, tested negative. And three people that were in contact — relative contact, who I believe they’ve all tested totally negative, but they are going to, for a period of time, self-isolate. So that’s not breaking down. It can happen. It’s the hidden enemy. Remember that. It’s the hidden enemy. And so things happen. But the three tested negative. The one who tested positive will be fine. They will be absolutely fine.
Yeah, John.
Q And what do you — what do you say, Mr. President, to other companies who may look at this and say, “I don’t know if we’re ready for all of this”?
THE PRESIDENT: Well, I think, you know, we have a lot of people in the White House. And we had one. Basically, we had one person. So — and we had a lot of people that work here. This building is shocking, if you looked at the numbers. And it’s also tremendous numbers of people coming in. Normally, you wouldn’t do that. But because we’re running a country, we want to keep our country running. So we have a lot of people coming in and out. Many of those people — most of those people are tested depending on what portion of the Oval Office area they’re going in. Everybody coming into the President’s office gets tested. And I’ve felt no vulnerability whatsoever, John.
But the two people, as I said, and three people, are — they have been tested, and it’s negative, and they’ll be probably out of quarantine very quickly. Okay?
Jon.
Q Mr. President, if I can follow up on that: Your staff, your senior staff, as you just referenced, is able to get tested every day. When will it be that Americans across the country will be able to get tested every day, as they go back to work?
THE PRESIDENT: Very soon. I mean, really, very soon. It’s an interesting question because normally you would have said that “you are not tested,” and you would have been, you know, knocking us for not getting tested. So, if we get tested, it’s a problem. And if we don’t get tested, it’s a problem.
But I like the way your question was phrased better this way because it is a positive. We are tested and we have great capability. You look at all of these machines here. They’re incredible machines. They’re the best anywhere in the world. No — no place in the world has this kind of equipment. Other countries are calling — sophisticated countries — and they’re calling. Lots of countries. And we’re trying to make as much as we can available to them, because there’s nothing like what we’ve been able to do in a — literally a couple of months.
What they’ve been able to do — the private sector, what they — how they got it done. This is a 5- to 15-minute test, as an example — the Abbott Laboratories’ test. These tests are highly sophisticated — very quick, very good. This is things that didn’t even exist a short while ago.
So we do have a great testing capability at the White House. We’re doing it. And I think, generally speaking — we had a call with a governors the other day — generally speaking, without exception, they were all extremely happy with what’s going on, with respect to their testing. Okay?
Q But should people be told to go back to work until they have that assurance that they and their coworkers are able to get a test —
THE PRESIDENT: Yeah.
Q — which we’re still not there?
THE PRESIDENT: We’re leaving that up to the governors, as you know. And if we see something wrong, we’ll call them out and we’ll stop it. But we are leaving it up to the governors. Some are being not aggressive enough, in my opinion, and some are being a little bit aggressive, but they’re being very careful.
And the people of the country, they’ve learned a lot over the last two months. They’ve learned about social distancing and washing your hands and other things that we’ve all learned and talked about. They’ve learned about — I see everybody — just about everybody has a facemask on. They’ve learned about facemasks — the good and the bad, by the way. It’s not a one-sided thing, believe it or not.
But our country has learned. Our country has been incredible. And you see the numbers; they’re dropping very substantially. The numbers are dropping around our country very, very substantially.
So we leave that, Jon, up to the governors, and I think they’re making a lot of good decisions. We’ve had, as I said, a great relationship with governors, Democrat and Republican. And I think, overall, they’re making very good decisions.
Nobody in this group. All of the ones behind the rope. That’s interesting. Please.
Q Thank you, Mr. President. You said in your comments earlier, “We have met the moment. We have prevailed.” To you, sir, is the mission accomplished? Even with 1.4 million —
THE PRESIDENT: No, we’ve prevailed on testing, is what I’m referring to. That was with regard to testing. You never prevail when you have 90,000 people, 100,000 people; when you have 80,000 people, as of today; when you have this — the kind of death you’re talking about, when you have potentially millions of people throughout the world that are dying. That’s not prevail- —
What I’m talking about is: We have a great testing capacity now. It’s getting even better. There’s nobody close to us in the world. And we certainly have done a great job on testing. And testing is a big — is a very big, important function. By the way, some people consider it more important than others, to be honest with you. But testing certainly is a very important function, and we have prevailed. We have the best equipment anywhere in the world.
Okay, please. Yeah. Please, go ahead.
Q There are a variety of reports that Chinese hackers are attempting to steal technology related to vaccine research. Is this something you’re concerned about? What can you say?
THE PRESIDENT: So what else is new with China? What else is new? Tell me. I’m not happy with China. They should’ve stopped this at the source. They could’ve stopped it right at the source. So now you’re telling me they’re hacking? So, I just say this, Steve: What else is new? We’re watching it very closely.
Q Sir, the — if I could follow up, sir: The South China Morning Post, the Beijing newspaper, says that China would like to reopen negotiations on the trade deal to make the terms more favorable to them. Is this something you’d be interested in doing?
THE PRESIDENT: No. Not at all. Not even a little bit. No, I’m not interested. We signed the deal. I had heard that, too — they’d like to reopen the trade talk to make it a better deal for them.
China has been taking advantage of the United States for many, many years, for decades because we had people at this position, right here where I’m standing, sitting right in that office — the Oval Office — that allowed that to happen.
No, I’m not interested in that. Let’s see if they live up to the deal that they signed. Okay?
Please, go ahead.
Q Mr. President, what are your thoughts about a second round of direct payments to Americans that’s included in the House Democratic bill?
THE PRESIDENT: Well, we’re talking about that with a lot of different people. I want to see a payroll tax cut. I want to see various things that we want. I want the workers to be taken care of.
But we are talking about that. We’re negotiating with the Democrats. We’ll see what happens. But as I said, it’s a transition, and it’s a — this is really going to be, in my opinion — we’ll see, but I think it’s going to be something that’s going to be very special. It’s a transition to greatness, and greatness is next year, right from the beginning. I think we’re going to do fantastically well.
I view the third quarter, as I said, as a transition quarter. It could be pretty good, but a transition quarter. Toward the end of the fourth quarter, you’re going to see some numbers that are going to be tremendous, I think. And next year you’re going to have potentially the kind of numbers that you saw before, and maybe even better, because there is that pent-up demand that is — you know, a lot of people wanted to do things. They were ready to do things, and they’ve had to hold back because of the virus.
So I think you’re going to have, with that pent-up demand, a phenomenal year next year, unless somebody messes it up by coming along and raising taxes — doubling, tripling, quadrupling your taxes. Like a certain party, namely the Democrats want to do. You’ll mess it all up.
You know, we had the greatest in the world. I presided –this administration presided over it. It got great for a reason. And we’ll do it again, and we’ll do it very quickly and very easily. I see that happening.
Yes ma’am. Please.
Q Thank you. Thank you, Mr. President. Almost everyone, as you noted, in the Rose Garden is wearing a mask today. Why haven’t you required everyone at the White House to wear masks before now?
THE PRESIDENT: Well, if they’re a certain distance from me or if they’re a certain distance from each other, they do. In the case of me, I’m not — I’m not close to anybody. I’d like to be close to these two gentlemen. They’re hardworking, great men, but they just said, frankly, “Let’s keep it this way.” So, obviously, in my case, I’m very far away from everyone.
But if you look at all of those people over there, every one of them from what I see — these are White House staffers, they’re White House representatives, they’re White House executives, and everybody has a mask on.
We’ve had — just about everybody I’ve seen today has worn a mask.
Yeah. Please, go ahead.
Q Were you the one who required that, sir?
THE PRESIDENT: Yeah, I did. I did. I required it. Yes.
Please. Go ahead.
Q Mr. President, you’re now promising that everyone who needs a test will be able to get one at some point soon. Can you give us some figures on what you’re changing to ramp up testing? When will that be a true statement, exactly? And how exactly are you going to accomplish that?
THE PRESIDENT: Well, it’s a true statement already. We have more testing than any country in the world by far. But I’ll let Admiral go into a little bit of the future.
ADMIRAL GIROIR: When you look at the testing numbers that we worked with collaboratively with the — with the state leadership — it’s not just with the governor, but the state health officers, the state epidemiologists, the public health labs — it’s really a combination of testing those who need something for diagnosis, diagnostic testing; tracing — so testing those who have been around the people with a diagnosis.
But the largest fraction of that is really moving into surveillance; that is testing those who are asymptomatic. And when you do the numbers, this amount of testing on a state-to-state basis really is in the range that we need to accomplish all of that, certainly within the range that we need. So it really encompasses those three things.
The other thing I would say is, particularly as we move into the summer, there are surveillance mechanisms — and I talked about them before — like a weather radar. And just think about that weather radar. The influenza-like illness network, which is at about 75 percent of healthcare institutions and syndromic surveillance. So if we see a blip on that weather radar, combined with CDC personnel in every single state, and with contact tracers, we really run to the fire, right? And that’s when you detect, you trace, and you shut off that outbreak right when it starts.
Q (Inaudible.)
Q Mr. President —
THE PRESIDENT: Phil, go ahead.
Q — there does seem to be a double standard here, Mr. President, where members of your own staff can get tests frequently when they need it, but ordinary Americans cannot.
THE PRESIDENT: Yeah.
Q So when will the rest of America have the same access that members of your own White House have to testing?
THE PRESIDENT: And you know what? If we didn’t get the tests, if we did no tests in the White House, you’d be up complaining, “Why aren’t you getting tests for the White House?” See, we can’t win, because if we didn’t get the tests, you’d be up — I understand you very well, better than you understand yourself — and, frankly, if we didn’t get tests done, you’d be up complaining about the fact that we didn’t have the tests done.
Now that we’re doing so well on tests and so quick and so fast — five minutes, et cetera — and so accurate, you’re complaining that we’re getting too many tests. So, you can’t win.
Go ahead, Phil.
Q Yeah, Mr. President, many Americans want to return to their normal lives, but they’re afraid to do so. How can you ensure Americans that it’s safe to go to their own workplaces when the most secure workplace in the country, the White House, cannot contain the spread of the coronavirus that’s infected some of your own staff?
THE PRESIDENT: Well, when you say “some,” so we have a person and the person got — something happened right after a test was done. Three other people met that person, came into relative contact — very little contact — and they’re self-quarantining. That is not exactly not controlling it. We — I think we’ve controlled it very well.
We have hundreds and hundreds of people a day pouring into the White House. It’s a massive office complex, including the very large building right behind us that you know so well. So I think we’re really doing a very good job in — in watching it. And I think it’s very well contained actually.
And part of the reason, it is because of all the tests we’re able to give. But it was one person, and the other people were only people — they’re quarantined. You understand this, Phil; they’re quarantined for a specific reason. The reason is they were in the general proximity of the one person. And the one person, I believe, will be fine in a very short period of time.
Q Why hasn’t Vice President Pence followed the CDC guidelines of self-isolation and other people who might have been exposed to that person?
THE PRESIDENT: Well, that, I’m going to have to ask that he will give you that information. Whatever he is proceeding and doing, he will give you that information. I’ll make sure that they put out a notice.
John. Go ahead. Please.
Q Mr. President, up until now, it’s thought that the most vulnerable people were those above the age of 60 or 70 or 80 and that children were pretty much, I don’t want to say immune from this, but weren’t affected by it. But all day long in the news today, we have been hearing and seeing this terrible syndrome —
THE PRESIDENT: Yeah.
Q — that some 85 children have now. Three of them have died. What is the task force talking about in terms of that? And what could be done about it?
THE PRESIDENT: Yeah, we’re seeing that all over the world now with young children. A very, very tiny percentage, but it’s still — it’s the swelling and the skin rash. And we’re looking at that very closely, John. It’s a phenomena that’s just been brought to everyone’s attention a couple of weeks ago.
Admiral, you may have something to say about that.
ADMIRAL GIROIR: So thank you for pointing that out. And again, I’ve said many times, I’m a pediatrician and a pediatric ICU doctor. This syndrome, which we call — are similar to Kawasaki syndrome. It has been seen in a novel coronavirus before and it’s associated with illnesses. So we have a very strong activation on this.
We do know treatments for this, but the CDC is act- — is interacting actively with the pediatric intensive care unit network to create case definitions and to understand how this is going and if there are predispositions. The National Heart, Lung, and Blood Institute — I spoke to Dr. Gary Gibbons who directs that, who is advancing many research projects, based on that. The ASPR, the Assistant Secretary for Preparedness and Response, has a team out in several areas looking at if there are any special treatments.
We know what the basic treatment is, but this is a little bit different than we normally see. So there really is an activation among all the branches within HHS, working with networks at children’s hospitals and ICU nets. It is a small percentage, but it is quite frightening. And this reflects the fact that this virus affects the vasculature. We see clotting; we see strokes. And this is a vasculature phenomena of inflammation we see in children.
Q Mr. President, with this newly emerging syndrome now among young children, what do you say to parents who would like to get their children back to school but are now looking at this and potentially afraid to do that?
THE PRESIDENT: Well, again it’s a tiny percentage. But you’re right, so we’re looking into it very strongly. And the Admiral, as he said, he’s known about this for long before this happened.
But it is a very, very small percentage. And people recover from that; the children recover from that. Right?
ADMIRAL GIROIR: Yes, sir. Most do recover from this, but it is a serious, and it can be a fatal, condition. So we do want to make sure that parents understand that high fevers, red rashes, particularly on your child, you may need to contact your healthcare provider. There are treatments for this. They work very effectively if gotten early, at least for the vast majority of the cases.
THE PRESIDENT: We’re studying that very closely, and it’s been on the radar for weeks actually, because we’ve seen this for quite a while. But it’s been very rare, but we’re — we’re looking at it very closely. It’s very important to us.
I think one of the things we’re most proud of is — this just came out — deaths per 100,000 people, death — so deaths per 100,000 people: Germany and the United States are at the lowest rung of that ladder. Meaning, low is a positive, not a negative. Germany and the United States are the two best in deaths per 100,000 people, which, frankly, to me, that’s perhaps the most important number there is.
Please, go in the back, please.
Q Thank you. Thank you, Mr. President. I have two questions: one on the Ahmaud Arbery case and one on the coronavirus. The first on the coronavirus: The Vice President is said to be in some sort of self-isolating — keeping his distance from people. What do you say to Americans who say, “How can you — how can you keep me safe? How can you reopen the government, if even the Vice President is self-isolating?” And why hasn’t testing gotten up to the point where every American who wants to test can get a test?
THE PRESIDENT: Well, the Vice President, first of all, has been tested, and he’s negative — and was tested yesterday, tested today, and he’s negative. He’s in very good shape. And I think that that’s going to be fine.
As far as Americans getting a test, they should all be able to get a test right now. They should be able to get a test.
That’s the problem with a question like that. We go through a whole announcement saying “We’re number one in the world by far,” by a factor of two, and even three and four depending on where you’re looking, and I get a question, “When will everybody be able to get tested?” If somebody wants to be tested right now, they’ll be able to be tested.
As far as the incident, I think it’s horrible, and it’s certainly being looked at by many people. I’m speaking to many people about it. He looked — I saw the picture of him in his tuxedo; it was so beautiful. I mean, he looks like a — a wonderful, young guy. Would have been a wonderful — I mean, just a wonderful guy. I think it’s a horrible thing. I think it’s a horrible thing.
Now, with that being said, as you know, they’re studying the case very carefully. They’re interviewing everybody involved, and we’ll see what happens. To me, it’s a very sad thing.
I spoke to a number of people that are very much involved in it. I’ve been following that one very closely. It breaks your heart to watch it. It breaks your heart. And certainly, the video was a — it was a terrible-looking video to me.
But you have a lot of people looking at it, and hopefully an answer is going to be arrived at very quickly. But it’s something that is heartbreaking.
Q I have a specific question about the case, if I could ask it.
THE PRESIDENT: Go ahead.
Q The specific question I have is, you’ve said that there possibly are things that happened that were not recorded on the tape. Could you just expound on what you mean by that and your thoughts —
THE PRESIDENT: Yeah.
Q — on what (inaudible) —
THE PRESIDENT: Well, I saw the tape, and when they moved left, I don’t believe — when they moved left, outside of the tape, nobody saw what was going on. Nobody saw it. It’s an empty spot on the tape, I guess.
Now, do they have additional tapes? I hope. But I will say that it’s something that, based on what I saw, doesn’t look good. Somebody that I have a lot of respect for is — Senator Scott of South Carolina, you know who I’m talking about. He’s a great gentleman. He’s a great senator. He’s a great gentleman. Tim Scott. And I called him two days ago. I said, “Tim, what do you think? Tell me. What do you think?” He’s very disturbed by it. He’s very disturbed. And I’m very disturbed also.
Please, go ahead.
Q President Trump, thank you. I have two questions — one on testing and one on Democratic states that you’ve tweeted about. First, the money for this new testing support today comes from the CARE Act — CARES Act, which you signed into law 42 days ago. Did your delay in embracing widespread testing have anything to do with the desire to suppress the official number of U.S. cases and deaths as you try to reopen the country?
THE PRESIDENT: No, we just wanted to make sure that we had the proper machinery apparatus and everything else out there before people started wasting money. It’s method of saving money. We wanted to make sure we had even things like this. Plus, they have machines that are far more complex than this. They have massive machines at some of the laboratories that can do millions of tests. We wanted to make sure everything was in place. Okay?
Go ahead.
Q And earlier today, you tweeted that Democrats are moving slowly for political purposes. Why do you believe that their motive is politics rather than public safety? And how do you respond to criticism that you’re also motivated by politics to try to grow the economy ahead of the election?
THE PRESIDENT: Well, I think that if you look at Pennsylvania, as an example; if you look at various other states — I won’t get into them — the people want to go back. The numbers are getting to a point where they can, and there just seems to be no effort on certain blue states to get back into gear. And the people aren’t going to stand for it; they want to get back.
They’re not going to stand for it. They want our country open. I want our country open too. I want it open safely, but I want it open.
Don’t forget, people are dying the other route. You can go with the enclosed route: Everything is closed up, you’re in your house, you’re not allowed to move. People are dying with that too. You look at drug addiction, you look at suicides, you look at some of the things that are taking place, people are dying that way too. You could make the case it’s in even greater numbers.
So it’s a — it’s a situation that some people — and I’ve noticed that some states could be moving more quickly. And also, at the same time, safety. Look, safety is paramount. But people are dying in the lockdown position too. And everybody understands that. They’re just starting to find out. And look at what’s going on with drugs, and look at what’s happening with suicides.
Yeah, please. Please, go ahead.
Q Hi, Mr. President. So Americans have been self-quarantining for several months now, social distancing, yet we’re still seeing about 20,000 new cases a day, 1 to 2,000 deaths. Is there anything else the administration is planning to do to get these new cases under control? Because we seem to be on a plateau. Or is this just (inaudible)?
THE PRESIDENT: Well, excuse me. There are 20,000 — the numbers are way down from what they were two weeks ago. I mean, the numbers are really coming down, and very substantially. And this weekend was one of the lowest we’ve had. This is — you know, the numbers are coming down very rapidly all throughout the country, by the way. There may be one exception. But all throughout the country, the numbers are coming down rapidly. I think you see that, Admiral.
Q Yeah, but does this — the models, sir, are projecting now 130,000 cases that go through August. Is that — do you agree with those models? Is that your expectation as well?
THE PRESIDENT: Well, the models haven’t been exactly accurate. These are models done by a lot of think tanks, a lot of universities. If you look at some of the models, they have been way off. Few of the models have been accurate.
But as far as the models are concerned, if you go by the model, we were going to lose 2.2 million people. And because we took — we mitigated — we did things that were very tough for our country to do, frankly. We had to turn off our whole magnificent economy. We had to turn down the whole country. We’re at the lowest of all of the models.
I mean, if you look at, I guess, 120- — 100 to 120 thousand people would be at the low side. And we’re at — there’s nothing low. Look, nothing low. One is too many people. And I say it all the time: One person to lose for this is too many people. It’s a disgrace what happened.
But if you look at the models, we’re at a — at a low — at the lowest of those projections. But the models are not models done necessarily by the White House. They’re models done by many people all over the world. And if you take the most respected of those people, many of those models are wrong. I mean, they’ve been wrong as far as the U.S. is concerned, because those numbers are nowhere near what was projected, potentially.
Q Do you have an expectation of what the death toll is going to look like by the summer, by the —
THE PRESIDENT: You know what? I don’t want to think about it, even. I know that we’re doing everything we can. We’re doing a good job. We acted very early. We acted extremely early in keeping China out of our country and banning people from China coming in, other than our citizens, which we obviously had to take. And they were quarantined or watched carefully. They were tested. They were watched very carefully.
But we had about 40,000 people coming in from China, from Asia, and we had to obviously take the people. Can you imagine if I said, “You’re a U.S. citizen and we’re not going to take you”? That doesn’t work.
So — but they were very carefully — I was with Ron DeSantis. He said they put — literally put the people that came in from China in quarantine for a substantial period of time.
No, that was a big decision. I think we saved hundreds of thousands of lives by acting very early. And when I did this — I think the Admiral can say it — everybody was against my doing it. Everybody. Everybody was: the professionals, the doctors. I was pretty much by myself on that one. And it was a lucky thing we did it because we saved hundreds of thousands of lives.
Yeah, please. Go ahead.
Q Thank you, Mr. President. Earlier today, the Vice President urged governors to have all their nursing home residents tested. Why not just mandate that? Why not require that? Have you considered that?
THE PRESIDENT: Well, I — I would certainly consider that. I will mandate it if you’d like. I would — I think it’s important to do, and I think, frankly, some of the governors were very lax with respect to nursing homes. It was obvious right from the beginning. The State of Washington, where 26 or 28 people died very early on. And I would have said, “nursing homes.” And I did say “nursing homes.” That’s what they should. Now, some of the states — many of the states are doing that, but I think all of the states should be. They have the capacity to do it. They should be doing nursing home. That is a real vulnerability.
Q The two staffers that were announced last week as testing positive, are you aware of any additional White House staff (inaudible)?
THE PRESIDENT: No, not at all.
Q Thank you.
THE PRESIDENT: I’m only aware of people that saw them, were tested, the tests were negative, and they’re quarantining anyway. So —
Please, go ahead.
Q Thank you, Mr. President. I wanted to ask: Are you now, or are you considering, separating some more with Vice President Pence as a precautionary measure?
THE PRESIDENT: Well, first of all, the job he’s done on task force, the job he’s done, frankly, as the Vice President of the United States has been outstanding. And he’s a warrior too, just like doctors and nurses. I mean, he is working so hard, and he’s coming into contact with a lot of people. But again, he tested negative, so we have to understand that. But he comes into contact with a lot of people.
It’s something probably, during this quarantine period, we’ll probably talk about. I have not seen him since then. But I would say that he will — he and I will be talking about that. Yeah, we could talk on the phone.
Q And I have a question for Admiral Giroir, if I could.
THE PRESIDENT: Please.
Q The President just said that Dr. Fauci, Dr. Hahn have tested negative. Then why do they need to be isolating? Is there some concern that they could be spreading the virus in some ways? Are they concerned about the testing? Why do they need to isolate?
ADMIRAL GIROIR: So this is a very fundamental concept, and I’m so happy you brought that up because it underlies a lot of the questions here. If you test negative just at that one point, that just means you have tested negative for that point in time. We know that the incubation period for this virus can be many days.
So the CDC guidelines really says that if you’re in close contact, just testing negative on that one day doesn’t mean you won’t be positive later on. So the prudent and the recommended thing to do is to self-isolate yourself for the entire period of incubation and, really, then some. So that’s what they’re doing. It’s a precautionary manner because they were negative. We all hope that they remain negative, but if they turned positive in a day or two or became symptomatic, that’s still possible, even with a negative test.
THE PRESIDENT: Okay?
Q Thank you, sir.
THE PRESIDENT: Go ahead. Phil.
Q Mr. President, in one of your Mother’s Day tweets, you appear to accuse President Obama of the biggest political crime in American history, by far.
THE PRESIDENT: Yeah.
Q Those were your words. What crime exactly are you accusing President Obama of committing? And do you believe the Justice Department should prosecute him?
THE PRESIDENT: “Obamagate.” It’s been going on for a long time. It’s been going on from before I even got elected. And it’s a disgrace that it happened. And if you look at what’s gone on, and if you look at, now, all of this information that’s being released — and from what I understand, that’s only the beginning — some terrible things happened, and it should never be allowed to happen in our country again.
And you’ll be seeing what’s going on over the next — over the coming weeks. But I — and I wish you’d write honestly about it, but unfortunately, you choose not to do so.
Yeah. Jon, please.
Q What is the crime exactly that you’re accusing him of?
THE PRESIDENT: You know what the crime is. The crime is very obvious to everybody. All you have to do is read the newspapers, except yours.
Jon, please.
Q Yeah, Mr. President, if I can just get a clarification on the — on the testing. We’ve seen clearly that the numbers of tests have gone up.
THE PRESIDENT: Yeah.
Q There have been some advancements on testing. But you’ve said twice here today that every American who wants a test can get a test.
THE PRESIDENT: Yes.
Q That’s not the case. 1.9 million tests per day is far short of every American that wants a test to be able to get a test.
THE PRESIDENT: Well, I’m going to have the Admiral — but I will say, just from listening and hearing, like you do — we all do — not everybody should get a test because they have to have certain things. And they’re going to know when they’re not feeling right. Those are the people that will be getting the test. But, Admiral, I’ll let you take it from there, please.
ADMIRAL GIROIR: So everybody who needs a test can get a test. We have plenty of tests for that.
Q (Inaudible.) (Off-mic.)
ADMIRAL GIROIR: Right now, in America, anybody who needs a test can get a test in America, with the numbers we have. If you’re symptomatic with a respiratory illness, that is an indication for a test and you can get a test. If you need to be contact traced, you can get a test. And we hope — and not hope — we are starting to have asymptomatic surveillance, which is very important. Again, that’s over 3 million tests per week. That is sufficient for everyone who needs a test — symptomatic, contact tracing, and, to our best projections, the asymptomatic kind of surveillance we need to get that. And that — that’s the way it is.
And remember, I work at HHS. I work there every day. I don’t get tested every day. I get monitored for my symptoms. Am I febrile? Do I have any other symptoms? I wear a mask when I go in. That’s a safe work environment for the environment we have.
If I became symptomatic, I would get a test. And if it were positive, I would isolate and there’d be contact tracing to stop that just the way it was done here. If I’m not symptomatic, I do the precautions as everyone is recommended in phase one. And that’s the essence of safely opening America.
THE PRESIDENT: And, John, the numbers are coming way down and they’re coming down rapidly, and that’s a beautiful thing to see. And that’s pretty much universally all across the country. They’re coming down very rapidly. So, very important.
Please, go ahead.
Q (Inaudible.) If I can ask the Admiral if –- so, Americans who are going back to work shouldn’t expect — and shouldn’t need, shouldn’t want to have the same thing that people coming to work here at the White House have, which is the ability to get tested regularly, regardless of symptoms? Is that what you’re saying?
ADMIRAL GIROIR: So, let me clarify as well: People who come into close contact with the President get tested on a regular basis. Okay? If I were not in close contact with the President specifically, I would not get tested like most people here do not get tested. That’s a very specific circumstance.
When I work at HHS, I go to HHS; I don’t get tested. I do the exact thing that we ask Americans to do: to monitor your symptoms. If you are symptomatic, self-isolate, get tested with one of our community-based testing sites at your hospitals. There are even at-home testing now that has been authorized. And –- and to cooperate; that if you need to be contact-traced, be contact-traced and cooperate with your local public health.
But not everybody who walks in here gets tested every time they do. If you’re symptomatic here, at HHS, at a meatpacking plant, at a school, you need to get tested.
THE PRESIDENT: And the meatpacking plants now are doing very well. There’s great testing around those plants. And we’re finding out who had the problem. They’re being quarantined. And the meatpacking is moving along very nicely.
But they were — they were trouble spots. They were hot zones, definitely.
Please.
And, you know, one thing I think is very important though, Jon, just to finish: we have now — and nobody says it; they just don’t want to write it — by far, more tests than any other country in the world. Not even a contest. And the quality of our test is the best anywhere in the world. That’s very important to say.
Please, go ahead.
Q So, to make sure I understand the White House’s position, are you saying that, right now, you feel there is enough testing — adequate testing — across the United States? Or do you feel that it needs to be ramped up? And by how much, if so, does it need to be ramped up?
ADMIRAL GIROIR: We’ve been — I think we’ve been clear all along that we believe, and the data indicate, we have enough testing to do the phase one gradual reopening that has been supported in the — in the President’s plan and the task force’s plan.
And it has to be a phased reopening. Nobody is saying, “Turn the light switch on and everyone go,” because then it would be really impossible to control the spread of — the spread of the virus.
You know, there are many, many models out there. The Rockefeller Foundation published their recommendations of about 3 million tests per week. That’s exactly what we’re doing. If you look at our agent-based models, it’s far below that. If you take the Safra Center at Harvard and correct their misassumptions — like on the sensitivity of the tests, the mitigation processes, and how many people get hospitalized — you get about that number.
Now, I am not going to come here and say, “We can absolutely swear it’s God’s truth that this is the number we need.” But we know we have enough to open and we’re going to be very careful with our ILINet, with our surveillance programs, and let the data come in to inform us even further as we grow and learn.
And I think Brad may –-
MR. SMITH: And let me just add a little bit to that, because most days I don’t come to the White House to work; I either go to FEMA or I go to HHS. And let me just talk you through what the protocols are there because I would never get tested if I wasn’t coming to the White House.
So, every day when we come in, we get our temperature taken, and we get asked questions about if we have symptoms. If you don’t, then you enter the workplace. And then there’s hand sanitizer all over the place. In rooms that are made for conference rooms, they put pieces of paper that say don’t sit in, essentially, every other or every third seat to separate people.
And so there’s a lot of precautions that we’re taking in the federal government that are separate from testing, and those are the precautions that the agencies use that Admiral Giroir and I are working at every day are using to let us continue working.
Q Mr. President —
THE PRESIDENT: If people want to get tested, they get tested. We have the greatest capacity in the world. Not even close. If people want to get tested, they get tested. But, for the most part, they shouldn’t want to get tested. There’s no reason. They feel good. They don’t have sniffles. They don’t have sore throats. They don’t have any problem. If they do feel there’s something happening, they have the absolute —
(Inaudible) — in fact, Ron DeSantis of Florida, the governor — doing a fantastic job in Florida — he said he’s got a little bit of the opposite problem. He’s got so much testing that people sit around and wait for people to come in, that they have a far — a great over-capacity for testing. And there are numerous other states that have told me the same thing. That’s, by the way, a good problem, not a bad problem. Okay?
Yeah, go ahead, please.
Q Thank you, Mr. President. You said many times that the U.S. is doing far better than any other country when it comes to testing.
THE PRESIDENT: Yes.
Q Why does that matter? Why is this a global competition to you if, every day, Americans are still losing their lives and we’re still seeing more cases every day?
THE PRESIDENT: Well, they’re losing their lives everywhere in the world. And maybe that’s a question you should ask China. Don’t ask me; ask China that question, okay? When you ask them that question, you may get a very unusual answer.
Yes. Behind you, please.
Q Do you want to follow up?
Q Sir, why are you saying that to me, specifically? That I should ask China?
THE PRESIDENT: I’m telling you. I’m not saying it specifically to anybody. I’m saying it to anybody that would ask a nasty question like that.
Q That’s not a nasty question. Why does it matter, when —
THE PRESIDENT: Okay. Anybody else? Please, go ahead. In the back. Please.
Q I have two –- I have two questions.
THE PRESIDENT: No, it’s okay. We’ll go over here.
Q But you pointed to me. I have two questions, Mr. President.
THE PRESIDENT: Next. Next, please.
Q But you didn’t — you called on me.
THE PRESIDENT: I did, and you didn’t respond, and now I’m calling on —
Q Sir, I just wanted to let –-
THE PRESIDENT: — the young lady in the back. Please.
Q I just wanted to let me colleague finish.
THE PRESIDENT: Okay –-
Q But can I ask you a question, please?
THE PRESIDENT: — ladies and gentlemen, thank you very much. Appreciate it.
Q But you called on me.
THE PRESIDENT: Thank you very much.
THE WHITE HOUSE. May 11, 2020. FACT SHEETS. HEALTHCARE. The United States Has Built the World’s Leading Coronavirus Testing System
We built the most advanced and robust testing anywhere in the world, and we’ve done more testing than any country anywhere in the world.
President Donald J. Trump
PROVIDING TESTING RESOURCES: President Donald J. Trump is working tirelessly to ensure that every State, territory, and tribe has the resources they need to meet their testing goals.
- The Administration is sending $11 billion to help States, territories, and tribes meet the testing goals set out by their Governors and tribal leaders.
- The Federal Government will be sending approximately 12 million swabs to States over the course of May to supplement private sector resources.
- President Donald J. Trump is also working to ensure manufacturers are producing enough testing supplies – such as reagents and extraction kits – to support our robust testing system.
- The Administration has partnered with leading retail companies as well as local independent pharmacies to increase access to testing for Americans in more communities.
- By the end of this week, more than 300 retail testing sites will be operational to serve Americans in 47 states and D.C., prioritizing access in underserved communities.
LEADING THE WORLD IN TESTING: As a result of President Trump’s leadership, the United States has become the world’s leader in coronavirus testing.
- President Trump revolutionized our testing system and, in partnership with Governors, scaled up testing across the country to unprecedented levels.
- More than 9 million tests have now been completed in the United States – by far the most in the world – and this number will soon surpass 10 million.
- Last week, as many as 314,000 Americans were tested a day.
- The United States is testing more than every country on Earth, including South Korea, Japan, the United Kingdom, and Italy.
- In May, every single State will be able to test more people per capita than South Korea has tested per capita in four months since the outbreak began.
DEVELOPING NEW TESTS: President Trump has led an unprecedented effort to quickly develop more innovative, high-quality, and reliable tests.
- The Trump Administration is leveraging the power of the private sector to accelerate research and development of innovative diagnostic tests.
- Already, the Food and Drug Administration (FDA) has granted 92 emergency use authorizations for coronavirus tests – more authorizations than for H1N1, Avian flu, MERS, Ebola, Enterovirus, and Zika combined.
- The FDA’s quick authorization of tests created by companies such as Roche, LabCorp, Abbott Labs, and many others have greatly increased America’s testing speed and capacity.
- These efforts have allowed Americans to receive testing results in as little as five minutes, or collect a sample for a test within the comfort of their own homes.
- New antibody tests, antigen tests, point-of-care nucleic acid testing, and genomic sequencing technologies are under development, which will enhance our coronavirus monitoring efforts.
CONSUMER PRICE INDEX / INFLATION
DoL. BLS. May 12, 2020. CONSUMER PRICE INDEX – APRIL 2020
The Consumer Price Index for All Urban Consumers (CPI-U) declined 0.8 percent in
April on a seasonally adjusted basis, the largest monthly decline since December
2008, the U.S. Bureau of Labor Statistics reported today. Over the last 12 months,
the all items index increased 0.3 percent before seasonal adjustment.
A 20.6-percent decline in the gasoline index was the largest contributor to the
monthly decrease in the seasonally adjusted all items index, but the indexes for
apparel, motor vehicle insurance, airline fares, and lodging away from home all
fell sharply as well. In contrast, food indexes rose in April, with the index for
food at home posting its largest monthly increase since February 1974. The energy
index declined mostly due to the decrease in the gasoline index, though some
energy component indexes rose.
The index for all items less food and energy fell 0.4 percent in April, the
largest monthly decline in the history of the series, which dates to 1957. Along
with the indexes mentioned above, the indexes for used cars and trucks and
recreation also declined. The indexes for rent, owners’ equivalent rent, medical
care, and household furnishings and operations all increased in April.
The all items index increased 0.3 percent for the 12 months ending April, the
smallest 12-month increase since October 2015. The index for all items less food
and energy increased 1.4 percent over the last 12 months, its smallest increase
since April 2011. The energy index fell 17.7 percent over the last year. In
contrast, the food index rose 3.5 percent over the last 12 months, its largest
12-month increase since February 2012.
 Table A. Percent changes in CPI for All Urban Consumers (CPI-U): U.S. city
 average


                                  Seasonally adjusted changes from
                                          preceding month
                                                                          Un-
                                                                       adjusted
                                                                        12-mos.
                              Oct.  Nov.  Dec.  Jan.  Feb.  Mar.  Apr.   ended
                              2019  2019  2019  2020  2020  2020  2020   Apr.
                                                                         2020


 All items..................    .2    .2    .2    .1    .1   -.4   -.8       .3
  Food......................    .2    .1    .2    .2    .4    .3   1.5      3.5
   Food at home.............    .2    .1    .0    .1    .5    .5   2.6      4.1
   Food away from home (1)..    .2    .2    .3    .4    .2    .2    .1      2.8
  Energy....................   1.7    .8   1.6   -.7  -2.0  -5.8 -10.1    -17.7
   Energy commodities.......   2.6   1.2   3.0  -1.6  -3.5 -10.4 -20.0    -31.4
    Gasoline (all types)....   2.7   1.2   3.1  -1.6  -3.4 -10.5 -20.6    -32.0
    Fuel oil................   1.1   1.0   1.1   -.4  -8.5 -13.7 -15.6    -33.2
   Energy services..........    .7    .2   -.2    .6   -.3   -.5    .1      -.2
    Electricity.............    .6    .2   -.2    .4   -.1   -.2    .1       .2
    Utility (piped) gas
       service..............   1.2    .5   -.5   1.0   -.9  -1.4    .2     -1.9
  All items less food and
     energy.................    .1    .2    .1    .2    .2   -.1   -.4      1.4
   Commodities less food and
      energy commodities....   -.4   -.1    .0    .0    .2   -.3   -.7      -.9
    New vehicles............   -.1   -.1    .1    .0    .1   -.4    .0      -.6
    Used cars and trucks....  -1.2   -.7   -.4  -1.2    .4    .8   -.4      -.7
    Apparel.................  -1.7    .6    .1    .7    .4  -2.0  -4.7     -5.7
    Medical care commodities   1.0    .0   1.0   -.6   -.6    .0   -.1       .7
   Services less energy
      services..............    .3    .3    .2    .3    .2    .0   -.4      2.2
    Shelter.................    .1    .3    .2    .4    .3    .0    .0      2.6
    Transportation services     .1    .0   -.1    .3    .3  -1.9  -4.7     -5.5
    Medical care services...    .8    .4    .3    .3    .3    .5    .5      5.8

   1 Not seasonally adjusted.
Food
The food index increased 1.5 percent in April following a 0.3-percent increase in
March. The food at home index increased sharply in April, rising 2.6 percent. The
increase was broad-based, with all six major grocery store food groups increasing
at least 1.5 percent over the month.
The index for meats, poultry, fish, and eggs increased the most, rising 4.3
percent as the index for eggs increased 16.1 percent. The index for cereals and
bakery products rose 2.9 percent in April, its largest monthly increase ever. The
index for nonalcoholic beverages also rose 2.9 percent in April, its fourth
consecutive increase. The indexes for dairy and related products and for fruits
and vegetables both increased 1.5 percent in April.
The index for food away from home rose 0.1 percent in April after rising 0.2
percent in March. The index for limited service meals rose 0.7 percent, while the
index for full service meals declined 0.3 percent.
The food at home index increased 4.1 percent over the last 12 months. All six
major grocery store food group indexes rose over the last year, with increases
ranging from 0.4 percent (fruits and vegetables) to 6.8 percent (meats, poultry,
fish, and eggs). The index for dairy and related products rose 5.2 percent, and
the index for nonalcoholic beverages increased 5.0 percent. The index for food
away from home rose 2.8 percent over the last year. The index for limited service
meals increased 3.2 percent and the index for full service meals rose 2.4 percent
over the last 12 months.
Energy
The energy index declined 10.1 percent in April, its largest monthly decrease
since November 2008. The gasoline index continued to decline, falling 20.6 percent
in April; it has declined 32.5 percent since December 2019. (Before seasonal
adjustment, gasoline prices fell 16.5 percent in April.) The fuel oil index also
declined in April, falling 15.6 percent. In contrast, the index for electricity
increased slightly in April, rising 0.1 percent, and the index for natural gas
rose 0.2 percent.
The energy index fell 17.7 percent over the past 12 months, its largest 12-month
decline since the period ending September 2015. The gasoline index decreased 32.0
percent, while the fuel oil index fell 33.2 percent. The index for natural gas
declined 1.9 percent, while the index for electricity increased slightly over the
last 12 months, rising 0.2 percent.
All items less food and energy
The index for all items less food and energy decreased 0.4 percent in April. Large
declines in several indexes contributed to the record decrease. The apparel index
fell 4.7 percent in April. The index for motor vehicle insurance declined 7.2
percent, and the index for airline fares decreased 15.2 percent. Each of these
decreases was the largest monthly decline in the history of the respective series.
The shelter index was unchanged in April, as it was in March. The indexes for rent
and for owners’ equivalent rent both increased 0.2 percent in April following
0.3-percent increases in March. However, these increases were offset by a sharp
decline in the index for lodging away from home, which fell 7.1 percent in April
following a 6.8-percent decline in March. Also falling in April were the indexes
for used cars and trucks, which declined 0.4 percent, and for recreation, which
declined 0.2 percent. The new vehicles index was unchanged in April after
declining in March.
The medical care index rose 0.4 percent in April, the same increase as in March.
The prescription drugs index rose 0.6 percent and the hospital services index
increased 0.5 percent, while the physicians’ services index declined 0.1 percent.
The index for household furnishings and operations increased 0.5 percent in April.
Also rising in April were the indexes for education, for alcoholic beverages, and
for communication.
The index for all items less food and energy rose 1.4 percent over the past 12
months. The shelter index rose 2.6 percent over the 12-month span, with the rent
index increasing 3.5 percent, the owners’ equivalent rent index rising 3.1 percent,
and the lodging away from home index falling 14.0 percent. The medical care index
rose 4.8 percent over the last year. Indexes that declined over the past 12 months
include airline fares (-24.3 percent), apparel (-5.7 percent), new vehicles
(-0.6 percent), and used cars and trucks (-0.7 percent).
Not seasonally adjusted CPI measures
The Consumer Price Index for All Urban Consumers (CPI-U) increased 0.3 percent
over the last 12 months to an index level of 256.389 (1982-84=100). For the month,
the index decreased 0.7 percent prior to seasonal adjustment.
The Consumer Price Index for Urban Wage Earners and Clerical Workers (CPI-W)
increased 0.1 percent over the last 12 months to an index level of 249.515
(1982-84=100). For the month, the index decreased 0.7 percent prior to seasonal
adjustment.
The Chained Consumer Price Index for All Urban Consumers (C-CPI-U) was unchanged
over the last 12 months. For the month, the index decreased 0.8 percent on a not
seasonally adjusted basis. Please note that the indexes for the past 10 to 12
months are subject to revision.
FULL DOCUMENT: https://www.bls.gov/news.release/pdf/cpi.pdf
INTERNATIONAL TRADE
U.S. Department of State. 05/11/2020. Sea Turtle Conservation and Shrimp Imports to the United States
The Department of State plays an important role in protecting wildlife all over the world. As part of that mission, each year the Secretary of State (or the Secretary’s delegate) certifies to Congress that governments and authorities of shrimp-harvesting nations and economies have programs to reduce the incidental taking of sea turtles in shrimp trawl fisheries. This decision impacts the ability of countries to export shrimp to U.S. consumers.
This year, the Department suspended the certification of the People’s Republic of China for using shrimp trawl fishing methods that may adversely affect sea turtles. The Department also suspended the certification of Venezuela because the former Maduro regime would not permit the U.S. technical team into the country to assess Venezuela’s shrimp harvesting practices.
For 2020, the Under Secretary of State for Economic Growth, Energy, and the Environment certified 37 nations and Hong Kong and granted determinations for 12 fisheries as having adequate measures in place to protect sea turtles during the course of commercial shrimp fishing. Annual certifications are based in part on overseas verification visits by State Department and NOAA’s National Marine Fisheries Service representatives. Certification allows for the importation of wild-caught shrimp into the United States pursuant to Section 609 of Public Law 101-162 (“Section 609”).
Six of the world’s seven species of marine turtles are listed as endangered or threatened under the Endangered Species Act. Implementation of Section 609 provides considerable benefits to sea turtle species. The U.S. government currently provides technology and capacity-building assistance to other nations to help them protect and revitalize their sea turtle species and to help them certify under Section 609. When properly designed, built, installed, used, and maintained, Turtle Excluder Devices (TEDs) allow 97 percent of sea turtles to escape the shrimp net without appreciable loss of shrimp. The U.S. government encourages similar legislation in other countries to prevent the importation of shrimp harvested in a manner harmful to sea turtles.
For more information on the Certification to Congress, please see the Federal Register Notice published on April 30, 2020, at 85 FR 24074. For more information on U.S. government sea turtle conservation efforts, please visit the websites of the State Department’s Office of Marine Conservation, the National Oceanic and Atmospheric Administration (NOAA), and the Fish and Wildlife Service.
FINANCIAL SYSTEM
FED. May 12, 2020. Testimony. Supervision and Regulation Report. Vice Chair for Supervision Randal K. Quarles. Before the Committee on Banking, Housing, and Urban Affairs, U.S. Senate, Washington, D.C.
Chairman Crapo, Ranking Member Brown, members of the Committee, thank you for the opportunity to testify today. The past two months have been a time of exceptional economic hardship. The Congress has displayed an extraordinary willingness to act, in concert and at speed, to address this hardship and its wide-ranging consequences. I appreciate your dedication to continuing our common work, as well as the chance to appear.
The report accompanying my testimony reviews supervisory and regulatory steps the Federal Reserve has taken to address the economic and financial challenges of the current economic contraction.1 I do not plan to repeat those steps here, although I am happy to answer questions about them in detail. Instead, I will briefly outline the Federal Reserve's approach to supporting the nation's economy, maintaining the supply of credit, and reducing the economic impact of the various containment measures taken in response to public health concerns. This approach applies, not only to our efforts thus far, but also to the efforts that we—and the financial sector—will make to support households and businesses in the months ahead.
It is worth a moment to acknowledge the profound effects of this crisis on the nation's financial system and economy. The measures adopted to contain the pandemic triggered a deep, abrupt, and global financial shock. Uncertainty cascaded across the financial system. Savers and investors, consumers and companies, took part in a flight to safety, seeking the stability of cash over the volatility of the markets. No port was safe from the storm that followed, visiting asset classes from commercial paper to Treasury securities. The strain it caused was widespread, as families and businesses struggled to pay their bills, meet their expenses, and sustain their daily lives.
More than a decade ago, U.S. banking organizations faced a different crisis, in which their structural weaknesses catalyzed and compounded the ongoing stress. Twelve years of work—by Congress, financial institutions, and the regulatory agencies—went toward ensuring that this dynamic would not occur again. Reforms, and other measures taken by the industry, raised the quantity and quality of bank capital, so banks could withstand a severe downturn and continue lending. They established higher levels of liquidity, so banks could meet customer and counterparty demands. They required improvements in risk management, so banks could avoid unexpected losses lurking in their books. They improved operational resiliency, so banks could keep their doors open and their lights on after a shock. As a result, banks entered this crisis in a position of strength.
Over the past two months, the Federal Reserve took more than 30 supervisory and regulatory actions to ensure financial institutions could use this strength to support consumers, households, and businesses.2
- We advised institutions that working constructively with customers, offering them responsible loan modifications and small-dollar credit, is a safe and sound banking practice more than appropriate to this extraordinary time.3
- We made practical adjustments to certain documentation and compliance requirements to ensure the continuing flow of credit, while maintaining critical consumer protections.4
- We delayed implementation of new regulatory measures, and temporarily shifted supervisory activities from on-site examinations to off-site monitoring, to reduce operational burden and let firms concentrate on customer needs.5
- We made targeted—and, where appropriate, temporary—changes to capital requirements, so firms could more effectively use their balance sheets to support customers and the functioning of financial markets.6
- We supported banks' ability to meet customer requests by reducing reserve requirements to zero, and we took steps to increase the availability of the discount window to meet liquidity needs.7
Because of these measures, and the strong foundations on which they were built, banking organizations are well-positioned to serve as a source of strength, not strain, in the current crisis. They have been able to lend to creditworthy firms, which were suddenly without access to capital markets, or which simply sought to keep more cash on hand. They have been able to absorb new deposits from households and businesses preparing for the difficult road ahead. They have been able to process a flood of transactions from investors responding to higher volatility. And as a conduit for official-sector support, they have helped stabilize the financial system and restore market function.
The strain in financial markets has eased, thanks to the actions of Congress, Executive agencies, central banks, and other private and public institutions around the world. The profound economic disruption of the pandemic containment measures persists, and households and businesses are still deeply affected. Financial institutions now have an essential part to play in addressing that disruption—as a bridge between the start of this crisis and the completion of our economic recovery.
There are many differences between the current crisis and the one we faced a decade ago. The most fundamental, however, is the origin of the stress. The year 2008 marked the peak of a financial panic—incubated in the financial sector, unleashed by volatility in financial markets, compounded by weaknesses in financial institutions, and carried to the real economy through financial channels. The uncertainty that fueled that panic was born in the financial system, and policies aimed at the financial system could address it directly.
Today's uncertainty is different. The financial sector has felt its effects, and financial policy has helped limit the damage. However, its roots lie elsewhere and have burrowed deep into the marrow of the real economy. They are anchored in urgent questions with no ready answers: When will concern over the outbreak pass? What will the world look like when it does? How do we return to normal?
None of us can answer these questions with certainty. But we can affirm our commitment to support those who bear the heaviest burdens of the current crisis, and to help them carry the load, by ensuring the banking sector is strong and resilient enough to address the nation's current economic needs.
That system has shown resilience over the past two months. Banking organizations have used their capital buffers to support a sharp increase in lending, especially through the standing credit lines of their customers.8 Deposits have increased faster still, a sign of confidence in bank safety.9 Central banks and supervisors have worked collaboratively through the Financial Stability Board and other fora to coordinate their response. A first wave of acute financial stress has begun to ebb.
The storm, however, is not over. Banking organizations must continue to work constructively with borrowers, offering them the flexibility to weather a hardship they could not expect and did not create. Banks must still manage the challenges of operating during a public health emergency. And ultimately, banking organizations can only be as robust as the economies they serve. As the response to these public health concerns continues to unfold, the strength of the U.S. financial sector will reflect and depend on the strength of the U.S. economy. That strength, in turn, will depend on the calibration and effectiveness of our public health response.
We at the Federal Reserve are seeking to play our role responsibly and effectively. The tools we have are ones no country should ever hope to need; the hour of their use is one no country should ever hope to face. More may be required of us before the current crisis ends. We can only pledge to do what this moment demands.
Thank you for your time. I look forward to answering your questions.
Notes
- Board of Governors of the Federal Reserve System, Supervision and Regulation Report, May 2020 (PDF) (Washington: Board of Governors, May 2020).
- See Board of Governors of the Federal Reserve System, "Supervisory and Regulatory Actions in Response to COVID-19." For a full list of Federal Reserve COVID-19 resources, see Board of Governors of the Federal Reserve System, "Coronavirus Disease 2019 (COVID-19)."
- See, e.g., Board of Governors of the Federal Reserve System, Conference of State Bank Supervisors, Consumer Financial Protection Bureau, Federal Deposit Insurance Corporation, National Credit Union Administration, and Office of the Comptroller of the Currency, "Agencies provide additional information to encourage financial institutions to work with borrowers affected by COVID-19," news release, March 22, 2020 (revised April 7, 2020); Board of Governors of the Federal Reserve System, Consumer Financial Protection Bureau, Federal Deposit Insurance Corporation, National Credit Union Administration, and Office of the Comptroller of the Currency, "Federal agencies encourage banks, savings associations and credit unions to offer responsible small-dollar loans to consumers and small businesses affected by COVID-19," news release, March 26, 2020; Board of Governors of the Federal Reserve System, Conference of State Bank Supervisors, Consumer Financial Protection Bureau, Federal Deposit Insurance Corporation, National Credit Union Administration, and Office of the Comptroller of the Currency, "Federal agencies encourage mortgage servicers to work with struggling homeowners affected by COVID-19," April 3, 2020.
- See, e.g., Board of Governors of the Federal Reserve System, Federal Deposit Insurance Corporation, Office of the Comptroller of the Currency, National Credit Union Administration, and Consumer Financial Protection Bureau, "Federal banking agencies to defer appraisals and evaluations for real estate transactions affected by COVID-19," news release, April 14, 2020; Board of Governors of the Federal Reserve System, "Federal Reserve offers regulatory reporting relief to small financial institutions affected by the coronavirus," news release, March 26, 2020.
- See, e.g., Board of Governors of the Federal Reserve System, "SR 20-4 / CA 20-3: Supervisory Practices Regarding Financial Institutions Affected by Coronavirus," March 13, 2020; Board of Governors of the Federal Reserve System, "Federal Reserve provides additional information to financial institutions on how its supervisory approach is adjusting in light of the coronavirus," news release, March 24, 2020, ; Board of Governors of the Federal Reserve System, Federal Deposit Insurance Corporation, and Office of the Comptroller of the Currency, "Agencies announce two actions to support lending to households and businesses," news release, March 27, 2020; Board of Governors of the Federal Reserve System, "Federal Reserve Board announces it will delay by six months the effective date for its revised control framework," news release, March 31, 2020; Board of Governors of the Federal Reserve System, SR 20-9: "Joint Statement on Interaction of the Regulatory Capital Rule: Revised Transition of the CECL Methodology for Allowances with Section 4014 of the Coronavirus Aid, Relief, and Economic Security Act," March 31, 2020; Board of Governors of the Federal Reserve System, "Federal Reserve Board finalizes rule to extend by 18 months the initial compliance dates for certain parts of its single-counterparty credit limit rule," news release, May 1, 2020.
- See, e.g., Board of Governors of the Federal Reserve System, Federal Deposit Insurance Corporation, and Office of the Comptroller of the Currency, "Federal banking agencies provide banks additional flexibility to support households and businesses," March 17, 2020; Board of Governors of the Federal Reserve System, "Federal Reserve Board announces technical change to support the U.S. economy and allow banks to continue lending to creditworthy households and businesses," news release, March 23, 2020; Board of Governors of the Federal Reserve System, "Federal Reserve Board announces temporary change to its supplementary leverage ratio rule to ease strains in the Treasury market resulting from the coronavirus and increase banking organizations' ability to provide credit to households and businesses," news release, April 1, 2020; Board of Governors of the Federal Reserve System, Federal Deposit Insurance Corporation, and Office of the Comptroller of the Currency, "Agencies announce changes to the community bank leverage ratio," news release, April 6, 2020.
- See Board of Governors of the Federal Reserve System, "Federal Reserve Actions to Support the Flow of Credit to Households and Businesses," news release, March 15, 2020.
- See, e.g., Board of Governors of the Federal Reserve System, "Assets and Liabilities of Commercial Banks in the United States-H.8," updated May 1, 2020. Return to text
- Id.
FULL DOCUMENT: https://www.federalreserve.gov/newsevents/testimony/files/quarles20200512a.pdf
JAPAN
U.S. Department of State. 05/11/2020. Joint Statement on United States-Japan Strategic Energy Partnership: Virtual Presentations to U.S. and Japanese Industry Representatives
The text of the following statement was released by the Governments of the United States of America and Japan.
Begin Text:
On April 23, 2020 representatives from the U.S. Department of State, Department of Commerce, International Development Finance Corporation, Export-Import Bank, Department of Treasury, and Trade and Development Agency made virtual presentations to members of Japanese industry, emphasizing the shared commercial and strategic interests between the United States and Japan across the Indo-Pacific region and opportunities for collaboration through the Japan-U.S. Strategic Energy Partnership (JUSEP) framework.
Japanese representatives from the Ministry of Economy, Trade and Industry, Japan Bank for International Cooperation, Nippon Export and Investment Insurance, Japan Oil, Gas and Metals National Corporation, and Japan International Cooperation Agency also presented to members of U.S. Industry on April 28, 2020, highlighting ongoing collaboration in the Indo-Pacific region through JUSEP, as well as Japanese financing and other public sector tools available to U.S. firms.
Approximately 300 participants, from some of the most prominent U.S. and Japanese energy and infrastructure companies and related institutions signed on to attend the presentations and participate in the following question and answer sessions.
These virtual JUSEP events showcase our continued commitment to strengthening private sector participation in realizing energy security and prosperity in the Indo-Pacific, as well as our greater focus in creating business opportunities for U.S. and Japanese industries.
NUCLEAR WEAPONS
U.S. Department of State. 05/11/2020. 25th Anniversary of the Extension of the Non-Proliferation Treaty. Morgan Ortagus, Department Spokesperson
On May 11, 1995, States Party to the Treaty on the Non-Proliferation of Nuclear Weapons decided that the Treaty, known as the Non-Proliferation Treaty or NPT, should remain in force indefinitely. The NPT entered into force in 1970 with an initial duration of 25 years. The 1995 NPT Review and Extension Conference therefore faced two choices: whether the Treaty should be extended, and if so whether it should be for a finite period or indefinitely.
Wisely, NPT Parties decided to extend the Treaty indefinitely, ensuring that the foundation for efforts to stem the spread of nuclear weapons would remain in place. Today, twenty-five years later, we celebrate the wisdom of that decision. Fifty years after it entered into force, the NPT continues to provide a reliable basis for verified nonproliferation assurances that enable international cooperation on peaceful uses of nuclear energy and on efforts towards nuclear arms control and disarmament.
________________
ORGANISMS
CORONAVIRUS
IMF. May 6, 2020. COUNTRY FOCUS. Ethiopia Steps Up Health Spending With Help From IMF Emergency Assistance
Fikadu Digafe Huriso, Vice Governor and Chief Economist of the National Bank of Ethiopia
The IMF has approved $411 million in emergency assistance for Ethiopia to help fight the coronavirus pandemic in the east African country. It also approved Ethiopia’s request for a suspension of debt service payments of about $12 million to the IMF under the IMF's Catastrophe Containment and Relief Trust for poor countries.
In an interview with IMF Country Focus, Fikadu Digafe Huriso, Vice Governor and Chief Economist of the National Bank of Ethiopia describes the impact of COVID-19 on his country, and the measures which Ethiopia is taking to combat the pandemic.
What has been the impact of COVID-19 on Ethiopia? And which sectors have suffered the most?
The most direct economic impact, so far, has been on the service sector, particularly transport, travel, and hospitality services. The pandemic has severely affected passenger transport (both air and land), which, in turn, has shaken the hospitality industry resulting in closures of many big hotels.
The Jobs Creation Commission has estimated that close to 1.4 million workers will be affected by the pandemic, particularly in the service and manufacturing sectors. Some industrial parks have already laid off workers due to a slump in global demand.
As more and more people continue to become infected, we expect the impact on health resources and on the fiscal sector to grow. In addition, a number of studies suggest that disruptions in supply chains will affect the most vulnerable, especially those engaged in informal sectors, as their earnings and access to food will be severely affected.
What measures have the authorities taken so far?
On April 8, 2020, the federal government of Ethiopia declared a state of emergency, and several measures related to social distancing and city transport came into effect. On the economic front, a number of fiscal, monetary, and sectoral measures were introduced:
Fiscal Measures
- A Birr 5bn (around $150 million) preliminary stimulus package
- The removal of import taxes on COVID-19 related items
- Faster value-added tax refunds for businesses
Monetary Measures
- Birr 21bn (around $630 million) support for banks to address the expected liquidity shortage from expected lower deposits and loan collection, and to make available working capital for sectors impacted by the COVID-19 pandemic
- Priority access to foreign exchange importers and producers of COVID-19-related goods
- The raising of mobile money transfer limits
- The relaxing of the Central Bank’s non-performing loan directive to allow banks to reschedule loan payments for highly affected sectors like horticulture, hotels, and tourism among others
Sectoral Measures
- The removal of minimum export flower prices
- Stronger enforcement measures against price gouging
Ethiopia will have access to around US$411 million in emergency funding, how will this be used?
The emergency funds will support two broad areas. First, it will support the import of much-needed essential health supplies such as personal protective equipment (sanitizers, gloves, masks etc) and intensive care equipment like ventilators. The funding will also support communication on health issues as combating COVID-19 will require a lot of advocacy work to ensure that people stick to prevention recommendations.
Second, the resources will be used to ensure an adequate supply of essential goods such as food items (like wheat and edible oil) to aid the vulnerable. Although it will be challenging to implement large-scale social intervention to combat job losses and aid the informal sector, it is important to ensure that those in extreme poverty have access to basic items to survive.
The emergency financing will be useful to offset foreign exchange losses and enable the government to finance the importation of basic commodities including food and fuel. The emergency financing will also help ease pressure on balance of payments that could arise from unplanned COVID-19-related imports.
How will this financing be used to alleviate the impact of the pandemic?
After the pandemic has subsided, there will be a need to revive severely-affected sectors. This can be achieved by providing low-cost lending and rescheduling loans to various enterprises whose incomes have been severely affected, enabling them to revive their businesses.
It will be important to encourage spending by ensuring the supply of adequate liquidity to the financial system. This measure has to be supplemented by adequate foreign exchange resources to revitalize both imports and exports.
In addition, some fiscal incentives, such as tax relief, can be targeted to firms to strengthen their balance sheet, which will, in turn, induce them to hire. This will help ease the impact on unemployment caused by a slowdown in businesses, especially in the services and manufacturing sectors.
The funds can also be used to scale up existing rural and urban safety net programs, and to avoid an increase in the number of people sliding into absolute poverty.
FULL DOCUMENT: https://www.imf.org/en/News/Articles/2020/05/04/na050420-ethiopia-steps-up-health-spending-with-help-from-imf-emergency-assistance?utm_medium=email&utm_source=govdelivery
IMF. 05/12/2020. EMERGING FROM THE GREAT LOCKDOWN IN ASIA AND EUROPE
- Changyong Rhee, Director of the IMF’s Asia and Pacific Department
- Poul M. Thomsen, Director of the IMF’s European Department
Several countries in Asia and Europe, where the COVID-19 outbreak appears to have peaked, are gradually reopening their economies. Without a vaccine or effective treatment, policymakers will be balancing the benefits of resuming economic activity against the potential cost of another increase in infection rates. They face difficult choices, in part, because the costs of erring in either direction could be very large.
Given this, authorities are adopting a gradual and sequenced approach to reopening, along with the adoption of further prevention and containment measures. While some Asian countries have already moved down this path with some success, risks remain—and the risks for Europe may be even greater. How do unlocking strategies compare across Asia and Europe?
The COVID-19 pandemic hit Asia first. It quickly spread from China to others in the region and has yet to retreat from all those countries. To date, over 250,000 people in South and East Asia have been infected, and 9,700 have died, with China, India, Indonesia, Japan, Singapore, and South Korea accounting for over 85 percent of all infections.
Following the lockdown in China in late January, and a proactive containment effort of testing, tracking, and isolating in Korea, these two countries saw new infections peak in February, just when the pandemic began to hit Europe hard. The number of confirmed cases of COVID-19 in Europe has now reached 1.8 million, representing almost half the world’s total. The reported death toll stands close to 160,000, out of more than 280,000 worldwide.
Economic impact of lockdown measures
To slow the spread of the virus, most European and Asian countries adopted strict lockdowns, the economic impact of which has now become evident. China’s GDP dropped by 36.6 percent in the first quarter of 2020, and Korea saw an output decline of 5.5 percent (all rates are annualized and seasonally adjusted). The difference in impact reflects the fact that China faced the outbreak first and then moved to enforce strict lockdown measures, while Korea kept the economy open and followed a strategy of more targeted containment (see below).
In Europe, GDP declined by a record 21.3 percent in France, 19.2 percent in Spain, and 17.5 percent in Italy in the first quarter of 2020 (also annualized and seasonally adjusted). The second quarter is bound to be even worse.

How Asia is restarting economic activity
As containment measures proved effective in curbing the epidemic, a few Asian countries are already well down the path to reopening.
In China, the number of reported new infections has stabilized at very low levels. Since mid-February, the government has been reopening the economy in a gradual, sequenced manner. It has prioritized essential sectors, specific industries, regions, and population groups based on continuous risk assessments. Meanwhile it has also been leveraging digitalization, big data and technology to support contact tracing.
Crucially, the effort has been complemented by large-scale testing, including the start of randomized screening in select provinces, and systematic tracking via mobile phone apps to rapidly trace the contacts of any new positive cases. This has been accompanied by restrictions on movement and other control measures on infected people and their contacts. So far, the reopening in China has unfolded without a debilitating second wave of infections, but this may yet change as activity normalizes further.
Korea also encountered the virus early in the global wave and put in place a swift and well-organized containment effort. This was based on large-scale testing, mandatory isolation of detected and at-risk cases, and widespread use of digitalization and technology for contact tracing. This effort was combined with the closure of schools and public facilities; comprehensive guidance on social distancing, and quarantine measures for travelers.
However, domestic mobility and business activity were never widely restricted in Korea. As a result, the resumption of economic activity is proceeding gradually, and more or less automatically as social distancing recedes. The authorities have transitioned to less stringent guidelines for “Daily Social Distancing,” which directs citizens to stay home when feeling ill, keep personal distance, wash hands frequently, wear face masks, and ventilate indoor spaces regularly.
Singapore also succeeded in containing the contagion early on following a strategy similar to Korea’s But, in early April, it tightened containment measures in response to a new outbreak.
Europe’s gradual reopening
Several European countries have announced plans to gradually reopen their economies and some have already begun the process. The timing, sequencing, and pace of the planned exits differ across countries, reflecting differences in the progress of the epidemic but also national preferences (see below).
For example, Denmark and Norway have started by reopening lower schools and services, while Spain has lifted restrictions in manufacturing and construction, as well as for some small businesses, including retail, with safety measures. Germany has lifted restrictions on retail shops and is gradually re-opening schools with the relaxation subject to a break mechanism allowing for re-tightening if needed. Italy has reopened manufacturing and construction (under strict safety rules) and select small stores. France has just allowed the reopening of primary schools, shops, and industry, on a differentiated regional basis, as of May 11.
Sweden stands out with its distinctive approach, and its decision not to fully lock down activity. It is too early to tell whether this strategy will prove more effective.
All countries envisage using health and social distancing measures to mitigate the risk of a new wave of contagion, but they vary by type and intensity.

Unlocking Asia and Europe: looking ahead
While reopening strategies differ, Europe appears to be reopening its economy earlier in the epidemic cycle than China. In addition, the capacity for large-scale testing, contact tracing, and case isolation in Europe may lag behind the best examples in Asia―partly reflecting stringent privacy rules. For instance, the European Commission recommends tracking apps, but only on a voluntary basis. Consequently, Europe appears to be more at risk than some Asian countries, including China, though no country can confidently declare victory against the virus.

In both Europe and Asia, lockdowns and other restrictions have imposed a significant economic and psychological cost on citizens, and their desire to roll back these measures and reopen economies is all too understandable. However, moving too early and before wide-reaching measures to quickly identify and contain new infections are in place would put the gains in fighting the spread of COVID-19 at stake and risks imposing new human and economic costs. In charting their path out of this unprecedented lockdown, the economies in Asia and Europe should proceed carefully and resist the urge to do too much too soon and risk a relapse.
FULL DOCUMENT: https://blogs.imf.org/2020/05/12/emerging-from-the-great-lockdown-in-asia-and-europe/?utm_medium=email&utm_source=govdelivery
________________
ECONOMIA BRASILEIRA / BRAZIL ECONOMICS
POLÍTICA EXTERNA
MRE. RÁDIO JOVEM PAN. 11/05/2020. Entrevista do Ministro Ernesto Henrique Fraga Araújo
VÍDEO: https://www.youtube.com/watch?v=-T6BNSFA614
ONU
MRE. DCOM. NOTA-60. 08 de Mai de 2020. Intervenção do Ministro Ernesto Araújo por ocasião da reunião informal do Conselho de Segurança das Nações Unidas relativa aos 75 anos do fim da 2ª Guerra Mundial – 8 de maio de 2020
Obrigado senhor presidente, prezados colegas e amigos,
Começo congratulando o ministro Urmas Reinsalu da Estônia por organizar esta reunião, no dia que marca o 75º aniversário do fim da Segunda Guerra Mundial na Europa e no momento em que enfrentamos, talvez, o maior desafio à comunidade das nações desde aqueles dias trágicos.
Por que se lutou a Segunda Guerra Mundial? As pessoas lutaram pela dignidade humana, contra o racismo e contra o antissemitismo. E as pessoas lutaram por liberdade. Não devemos nos esquecer disto. Liberdade não vem de graça. Liberdade requer disposição permanente para lutar, para protegê-la e promovê-la. Esperemos nunca mais precisar lutar pela liberdade em guerras totais como aquela, embora devamos lutar pela liberdade todos os dias.
Aqui, hoje, celebramos a paz – a Paz que vem da luta, a luta justa e necessária. Muitos milhões de indivíduos derramaram seu sangue pela liberdade naquele momento, dentre os quais muitos brasileiros, visto que o Brasil teve importante participação no esforço de guerra, enviando 25.000 soldados para lutar na Itália com os Aliados contra as forças nazistas. Ter ajudado a liberar a Itália e, portanto, a Europa da tirania nazifascista talvez seja o maior orgulho do Brasil.
Há setenta e cinco anos a liberdade e a democracia prevaleceram contra o totalitarismo graças ao sacrifício de pessoas reais: de americanos, russos, britânicos, poloneses, estonianos, canadenses, franceses, chineses, brasileiros e muitos outros. Mas outra forma de totalitarismo, depois da Guerra, lançou sua sombra por muito tempo sobre metade da humanidade. Essa forma de totalitarismo, durante as décadas seguintes, tentou manipular as Nações Unidas a seu favor. Essa forma de totalitarismo tentou sequestrar e perverter essa nobre iniciativa que é a Organização das Nações Unidas. Infelizmente, a ideologia no centro dessa forma de totalitarismo não está morta. Ao longo dos anos, essa ideologia sempre trabalhou com o mesmo princípio de sequestro e perversão. Tentaram sequestrar e perverter causas e conceitos nobres, como direitos humanos, justiça, proteção ambiental. Não permitamos que a saúde seja mais uma vítima a ser sequestrada por essa ideologia e pervertida para servir a objetivos totalitários.
Vamos libertar todas essas boas e nobres causas, como direitos humanos, justiça e meio ambiente. Vamos libertá-las da manipulação e da escravização pelas ideologias totalitárias.
Estamos comprometidos a trabalhar de maneira construtiva em fóruns internacionais. Mas creio que devemos evitar a palavra "multilateralismo" ao falar de instituições internacionais ou de multilaterais. Palavras terminadas em "ismo" normalmente designam ideologias: Fascismo, Nazismo e Comunismo. Não vamos fazer do "multilateralismo" uma ideologia. O oposto de todas as ideologias não é outra ideologia. O oposto de todas as ideologias é a liberdade. Note que não dizemos "liberdadismo". Dizemos liberdade. Portanto, não tornemos o multilateralismo outro sistema de pensamento que nega a realidade e que tenta impor-se à realidade. Vamos fazer das instituições multilaterais uma plataforma para trabalhar pela verdade e pela liberdade.
A pandemia do COVID é provavelmente a maior crise desde a Segunda Guerra Mundial. Não vamos deixar outra forma de totalitarismo emergir agora, como a que emergiu após a Segunda Guerra Mundial. De fato, uma nova ordem certamente emergirá desta crise, só não sabemos ainda o formato que assumirá.
Essa nova ordem a emergir terá mais liberdade ou menos liberdade. Terá mais dignidade humana ou menos dignidade humana. E a opção que todos preferimos, o caminho que todos desejamos percorrer, o caminho em direção a mais liberdade e mais dignidade humana, é o caminho das nações.
Nações não são o problema. As nações são os bons moços nesta foto. Nações, agindo em coordenação, obviamente, por meio desta ONU e de outros foros. A Organização das Nações Unidas deve, portanto, ser um espaço de coordenação entre nações independentes, e não um instrumento para substituí-las.
Os países aqui reunidos devem fazer uso deste espaço para identificar os desafios enfrentados atualmente pela humanidade. Se a Organização das Nações Unidas ignorar os desafios reais de hoje e, em vez disso, optar por jargões politicamente corretos, seu papel estará diminuído.
A ONU não deve ser um esforço para encontrar uma base comum entre liberdade e totalitarismo, e muito menos para promover o totalitarismo sub-repticiamente.
A liberdade e a democracia devem estar no centro das ações da ONU. E a fonte da democracia são as pessoas. Pessoas organizadas nos Estados-nação, com sua soberania, orgulhosas de si mesmas.
O Brasil, hoje, coloca-se inequivocamente em favor da democracia e da soberania. A soberania do povo livre. Não caiamos no equívoco de vilipendiar aqueles que defendem a soberania, não desprezemos os que defendem o sentimento nacional. Sem nações soberanas, não há liberdade. Esse postulado não deriva da lógica abstrata, e sim da história, do sacrifício real de milhões de pessoas, da natureza das coisas, da essência do ser humano.
Portanto, o sentimento nacional não é o problema do mundo atual. Ao contrário, o problema é a erosão da soberania, que deixa as nações sujeitas à perda de liberdade.
No Brasil, estamos empenhados em colocar o “demos”, o povo, de volta à democracia, conforme o preceito de nossa Constituição de que todo poder emana do povo. Esse é o caminho para a liberdade. E o Brasil hoje, assim como fizemos na Segunda Guerra Mundial, defende a liberdade.
Obrigado.
ECONOMIA
MEconomia. REUTERS. 12 DE MAIO DE 2020. Queda do PIB estimada por Ministério da Economia na 4ª-feira ficará acima de 4%, dizem fontes
Por Marcela Ayres
BRASÍLIA (Reuters) - O Ministério da Economia divulgará na quarta-feira sua nova estimativa para o Produto Interno Bruto (PIB) e a contração da economia prevista para este ano será maior que 4%, afirmaram duas fontes com conhecimento direto do assunto.
Uma das fontes pontuou que o novo número ficará por volta de -4,5%.
Até o momento, a perspectiva oficial do governo é de alta de 0,02% para o PIB, divulgada em 20 de março.
De lá para cá, membros do time de Paulo Guedes reconheceram que o desempenho da atividade neste ano ficaria no vermelho, mas pontuaram que o governo aguardaria para refazer suas contas, até para ter mais dados do impacto do Covid-19 na economia.
A nova projeção do PIB faz parte da grade de parâmetros que irá fundamentar a revisão para o comportamento das contas públicas no próximo relatório bimestral de receitas e despesas, a ser publicado até o dia 22.
No boletim Focus mais recente, economistas ouvidos pelo Banco Central pioraram sua expectativa para o PIB neste ano a uma contração de 4,11%, contra queda de 3,76% antes. Já o Fundo Monetário Internacional (FMI) previu, em abril, uma retração de 5,3% para o Brasil em 2020, enquanto o Banco Mundial estimou um recuo de 5%.
A paralisação na atividade por conta das medidas de isolamento adotadas para refrear a disseminação do coronavírus tem afetado profundamente cadeias de produção e padrões de consumo no Brasil, esfriando de maneira expressiva a economia.
Nesta terça-feira, inclusive, o Banco Central destacou que vê queda forte do PIB na primeira metade deste ano, seguida de uma recuperação gradual a partir do terceiro trimestre, indicando que o ritmo de retomada não deverá ser rápido.
“Embora haja poucos dados disponíveis para o mês de abril, há evidência suficiente de que a economia sofrerá forte contração no segundo trimestre deste ano”, apontou a ata do Comitê de Política Monetária (Copom) do BC.
“A menos de avanços médicos no combate à pandemia, é plausível um cenário em que a retomada, além de mais gradual do que a considerada, seja caracterizada por idas e vindas”, completou.
A produção industrial do Brasil despencou 9,1% em março na comparação com o mês anterior em meio ao fechamento de fábricas e empresas em todo o país, ao nível de produção mais fraco para o mês em 18 anos.
Já em abril, a indústria automotiva teve queda de 99% na produção ante o mês anterior.
Edição de Isabel Versiani
BACEN. 12 Maio 2020. BC divulga Ata da 230ª reunião do Copom, realizada nos dias 5 e 6 de maio de 2020.
DOCUMENTO: https://www.bcb.gov.br/content/copom/atascopom/Copom230-not20200506230.pdf
BACEN. 11 de maio de 2020. Conexão Real com o BC - Relatório reúne produção intelectual do BC em 2019. Publicado anualmente, Relatório de Pesquisa em Economia e Finanças traz levantamento sobre publicações e atividades ligadas à pesquisa que ocorrem no Banco Central.
Está disponível no site do BC a nova edição do Relatório de Pesquisa em Economia e Finanças, com um levantamento sobre as publicações e as atividades ligadas à pesquisa que ocorreram ao longo de 2019 na instituição. Elaborado pelo Departamento de Estudos e Pesquisas do BC, o relatório é publicado anualmente desde 2013, para dar maior visibilidade e prestar contas ao público de parte importante da produção intelectual do Banco Central.
De acordo com o relatório, ao longo de 2019 foram realizadas 25 apresentações em seminários acadêmicos com a participação de servidores do Banco Central. Hoje, a pesquisa desenvolvida no BC desempenha papel fundamental no assessoramento às políticas monetária, de estabilidade financeira e de eficiência bancária.
Como explica o assessor Francisco Figueiredo, do Departamento de Estudos e Pesquisas, o trabalho do Banco oferece modelos econômicos e ferramentas analíticas de alta qualidade, que são usadas nas decisões de política e permitem um melhor entendimento de questões importantes das economias brasileira e global. “A pesquisa também fortalece a reputação da instituição, especialmente entre seus pares e especialistas, o que contribui para o alcance dos nossos objetivos estratégicos”, disse.
O ano de 2019, período coberto pelo relatório, marcou os 20 anos de existência do Departamento de Estudos e Pesquisas. A unidade foi criada para realizar pesquisas em todas as áreas de atuação do BC e elaborar e administrar o sistema de metas para a inflação. “O Banco busca ser referência no país e no exterior como centro de pesquisa em temas ligados às áreas de atuação de bancos centrais, com excelência na produção de trabalhos técnicos e no suporte à condução de política econômica”, explica Francisco.
Modelo
A qualidade da pesquisa realizada no BC vem sendo demonstrada tanto pela publicação de trabalhos em importantes periódicos nacionais e internacionais quanto pelas premiações recebidas por servidores. O relatório destaca trabalhos que foram premiados por bancas examinadoras e a realização de seminários e workshops com a participação de pesquisadores de outros bancos centrais, organismos internacionais, centros de pesquisas e universidades, bem como o desenvolvimento de pesquisas conjuntas com essas instituições.
A publicação ressalta ainda o 21º Seminário Anual de Metas para a Inflação, realizado em 2019. O evento contou com um painel comemorativo aos 20 anos do regime de metas para a inflação no Brasil e teve a presença de três ex-presidentes do BC. O seminário recebeu 127 artigos, de diferentes instituições e países.
CORONAVÍRUS
FGV. 11/05/2020. Impactos do COVID-19. Crescimento do PIB do Brasil em comparação com os dos demais países

As previsões do FMI para o PIB do Brasil e do mundo não são as melhores, como já se esperava. Cerca de 80% dos países devem apresentar um recuo da atividade econômica, ou seja, um crescimento negativo do PIB este ano. De acordo com o Fundo Monetário Internacional, 64% dos países deverão apresentar o pior desempenho econômico de suas histórias em 2020. No Brasil, o recuo deve ser de 5,3%. Quem fala sobre o assunto é Marcel Balassiano, pesquisador do FGV IBRE.
VÍDEO: https://www.youtube.com/watch?v=3XxluoxiATA
INFLAÇÃO
FGV. IBRE. 12/05/20. Índices Gerais de Preços. IGP-M Primeiro Decêndio. IGP-M cai 0,32% na 1ª prévia de maio
O Índice Geral de Preços - Mercado (IGP-M) caiu 0,32% no primeiro decêndio de maio. No primeiro decêndio de abril, este índice subiu 1,05%.
“A queda da taxa do grupo alimentação no IPA, a qual passou de 1,86% para -0,24%, sustentará a continuidade da desaceleração dos preços dos alimentos no IPC, que variaram 0,44% em maio, ante 1,24% em abril. Tais movimentos, somados a queda observada nos preços dos combustíveis no IPA e no IPC, contribuíram destacadamente para o resultado do IGP-M na primeira prévia de maio ”, afirma André Braz, Coordenador dos Índices de Preços.
O Índice de Preços ao Produtor Amplo (IPA) caiu -0,35% no primeiro decêndio de maio. No mesmo período do mês de abril, o índice variou 1,43%. Na análise por estágios de processamento, os preços dos Bens Finais intensificaram a queda da taxa e passaram de -0,04% em abril para -0,41% em maio. A principal contribuição para este movimento partiu do subgrupo alimentos in natura, cuja taxa passou de 6,77% para -0,53%. O índice correspondente aos Bens Intermediários passou de 1,72% no primeiro decêndio de abril para -1,35% no primeiro decêndio de maio. Este recuo foi influenciado pelo subgrupo materiais e componentes para a manufatura, cuja taxa passou de 3,61% para 0,00%.
A taxa do índice referente as Matérias-Primas Brutas passou de 2,66% no primeiro decêndio de abril para 0,69% no primeiro decêndio de maio. Contribuíram para o recuo da taxa do grupo os seguintes itens: milho (em grão) (2,99% para -6,77%), soja (em grão) (6,77% para 3,30%) e laranja (8,76% para -9,45%). Em sentido oposto, vale citar bovinos (-3,95% para 0,31%), aves (-2,74% para -2,35%) e trigo (em grão) (5,87% para 6,67%).
O Índice de Preços ao Consumidor (IPC) caiu 0,46% no primeiro decêndio de maio, após alta de 0,33% no mês anterior. Sete das oito classes de despesa componentes do índice registraram decréscimo em suas taxas de variação, com destaque para o grupo Transportes (-0,67% para -2,41%). Nesta classe de despesa, vale mencionar o comportamento do item gasolina, cuja taxa passou de -2,65% para -7,98%.
Também foram computados decréscimos nas taxas de variação dos grupos Educação, Leitura e Recreação (0,49% para -1,50%), Alimentação (1,24% para 0,44%), Habitação (0,38% para 0,03%), Saúde e Cuidados Pessoais (0,46% para 0,25%), Vestuário (-0,07% para -0,39%) e Comunicação (0,05% para 0,00%). Nestas classes de despesa, as maiores influências observadas partiram dos seguintes itens: passagem aérea (6,82% para -15,08%), hortaliças e legumes (9,31% para 2,84%), taxa de água e esgoto residencial (1,47% para 0,00%), artigos de higiene e cuidado pessoal (0,94% para 0,35%), roupas masculinas (-0,50% para -1,60%) e tarifa de telefone residencial (0,30% para 0,03%).
Em contrapartida, apenas o grupo Despesas Diversas (0,43% para 0,54%) apresentou acréscimo em sua taxa de variação. Nesta classe de despesa, vale mencionar o comportamento do item serviços bancários (0,41% para 0,82%).
O Índice Nacional de Custo da Construção (INCC) subiu 0,18% no primeiro decêndio de maio, taxa superior a apurada no mês anterior, quando o índice foi de 0,16%. Os três componentes do INCC registraram as seguintes taxas da variação na passagem do primeiro decêndio de abril para o primeiro decêndio de maio: Materiais e Equipamentos (0,41% para 0,52%), Serviços (0,17% para -0,07%) e Mão de Obra que não variou pelo segundo mês consecutivo.
DOCUMENTO: https://portalibre.fgv.br/navegacao-superior/noticias/igp-m-cai-0-32-na-1-previa-de-maio.htm
DESEMPREGO
MEconomia. 11/05/2020. TRABALHO. Número de pedidos de seguro-desemprego aumentou 1,3% em 2020. Atendimento presencial cresceu nos últimos dias de abril
No acumulado de janeiro a abril de 2020, foram contabilizados 2.337.081 pedidos de seguro-desemprego, na modalidade trabalhador formal. O número representa um aumento de 1,3% em comparação com o acumulado no mesmo período de 2019 (2.306.115).
Do total de requerimentos em 2020, 39,3% (918.688) foram realizados pela internet, seja por meio do portal gov.br ou por meio da Carteira de Trabalho Digital, e 60,7% (1.418.393) foram feitos presencialmente. No mesmo período de 2019, 1,6% dos pedidos (35.830) foram realizados via internet e 98,2% (2.270.285) presencialmente.
Como o trabalhador tem até 120 dias para requerer o seguro-desemprego, é possível estimar que até 250 mil pedidos ainda possam ser feitos nos meses seguintes por não terem sido realizados presencialmente nos meses de março e abril. Os requerimentos podem feitos de forma 100% digital e não há espera para concessão de benefício. No entanto, os dados indicam que esses trabalhadores aguardam a abertura das unidades do Sine, que são de administração municipal e estadual e que estão sem atendimento presencial devido às medidas de isolamento social decorrentes da pandemia da covid-19.
Dados mensais
Na comparação entre os pedidos registrados em abril de 2020 (748.484) e o mesmo mês de 2019 (612.909), houve aumento de 22,1%. A utilização por internet no mês de 2020 foi de 87%, enquanto esta alternativa representou 1,7% em abril de 2019.
Na primeira quinzena de abril, a quantidade de requerimentos pela internet chegou a 90,2%. A redução que se verificou na comparação com o número total mensal se explica pelo aumento de atendimentos presenciais nos últimos dias do mês. Cabe destacar ainda que o Decreto n° 10.329, de 28 de abril de 2020, definiu como essenciais as atividades de processamento do benefício do seguro-desemprego e de outros benefícios relacionados, por meio de atendimento presencial ou eletrônico.
Em relação a março de 2020, verificou-se um aumento de 39,4% no número de requerimentos, o que pode indicar que a reabertura das unidades de atendimento e a retomada do atendimento presencial possibilitou que mais trabalhadores acessassem o benefício.
Sobre o perfil dos requerentes do seguro-desemprego em abril de 2020, a maioria é masculina (57,1%). A faixa etária com maior número de solicitantes é de 30 a 39 anos (33,1%) e, quanto à escolaridade, 62,4% têm ensino médio completo. Em relação aos setores econômicos, serviços representou 41,6% das solicitações, seguido por comércio (27,7%), indústria (19,9%) e agropecuária (3,7%).
Os estados que registraram o maior número de pedidos foram São Paulo (217.247), Minas Gerais (85.990) e Rio de Janeiro (58.945) e os que tiveram maior proporção de requerimentos via web foram Amazonas (98,9%), Acre (98,5%) e Rio de Janeiro (97,8%).
DOCUMENTO: https://www.gov.br/economia/pt-br/assuntos/noticias/2020/maio/numero-de-pedidos-de-seguro-desemprego-aumentou-1-3-em-2020
INDÚSTRIA
IPEA. 12/05/2020. Ipea aponta recuo de 11,9% no consumo aparente de bens industriais em março. No 1º trimestre de 2020, comparado ao mesmo período de 2019, houve um crescimento de 0,7%
O Indicador Ipea de Consumo Aparente de Bens Industriais, que mede a produção industrial interna não exportada, acrescida das importações, recuou 11,9% em março de 2020, na comparação com fevereiro. Frente ao mesmo período de 2019, a demanda caiu 3%. O acumulado nos 12 meses finalizados em março registrou variação ligeiramente positiva (0,2%), enquanto a produção industrial apresentou baixa de 1%, medida pela Pesquisa Industrial Mensal de Produção Física, do IBGE. Os dados foram divulgados nesta terça-feira, dia 12, pelo Instituto de Pesquisa Econômica Aplicada (Ipea).
Entre os componentes do consumo aparente, o resultado foi negativo no mês de março: a produção de bens nacionais caiu 14%, e a queda das importações de bens industriais foi de 1,3%. Com esse resultado, o trimestre móvel encerrado em março registrou recuo de 1,2%, embora na comparação com o 1º trimestre de 2019 tenha ocorrido um crescimento de 0,7%.
No que diz respeito às grandes categorias econômicas, o fraco desempenho de março foi disseminado entre os segmentos, com recuo de 15,1% nos bens de capital e 5,6% nos bens intermediários. O destaque negativo ficou por conta do segmento de bens de consumo duráveis (queda de 28%). O resultado da comparação com março de 2019 foi similar, com exceção da demanda por bens intermediários, que se manteve estável em relação ao mesmo período do ano passado.
Entre as classes de produção, a demanda interna por bens da indústria de transformação recuou 12,4% em março (comparativamente com fevereiro), e a indústria extrativa mineral caiu 7,4%.
Na análise setorial, apenas dois segmentos avançaram, de um total de 22, com destaque negativo para os segmentos de veículos (-34,3%) e de artigos de couro (-32,3%). Na comparação com março de 2019, o resultado foi mais positivo, com 10 segmentos registrando crescimento – entre eles, “outros equipamentos de transporte”, com alta de 19%. Por fim, no acumulado em 12 meses, 13 segmentos avançaram, em especial máquinas e equipamentos (7,3%).
Indicador Ipea de Consumo Aparente de Bens Industriais – Março de 2020. Demanda interna por bens industriais recuou 11,9% no mês. 12 de maio de 2020Atividade Econômica, Indicadores IpeaDemanda por bens industriais, Indicador de Consumo Aparente Industrial
Por Leonardo Mello de Carvalho
O Indicador Ipea Mensal de Consumo Aparente de Bens Industriais – definido como a parcela da produção industrial doméstica destinada ao mercado interno acrescida das importações – registrou uma queda de 11,9% na comparação entre março e fevereiro, na série com ajuste sazonal. Com esse resultado, que sucedeu o recuo de 1,2% no período anterior, o primeiro trimestre de 2020 cedeu 1,2% na margem. Entre os componentes do consumo aparente, ainda na comparação dessazonalizada, enquanto a produção interna destinada ao mercado nacional (bens nacionais) caiu 14% em março, as importações de bens industriais recuaram 1,3%, conforme mostra a tabela .
Na comparação interanual, a demanda interna por bens industriais cedeu 3% contra março do ano passado. Com isso, o primeiro trimestre do ano apresentou um crescimento de 0,7% em relação ao verificado no mesmo período do ano passado. Tomando por base a variação acumulada em doze meses, a demanda registrou uma variação ligeiramente positiva (0,2%), enquanto a produção industrial, conforme mensurada pela Pesquisa Industrial Mensal de Produção Física (PIM-PF), do Instituto Brasileiro de Geografia e Estatística (IBGE), acumulou uma baixa de 1%, como visto no gráfico.


DOCUMENTO: https://www.ipea.gov.br/portal/images/stories/PDFs/conjuntura/200511_indicador_mar_final.pdf
CNI. 11/05/2020. Coronavírus provoca queda recorde na confiança empresarial. ICEI diminui 25,8 pontos em abril, após a forte contração na atividade e elevada incerteza por conta da pandemia do novo coronavírus. A falta de confiança atinge todos os setores da indústria
O Índice de Confiança do Empresário Industrial (ICEI), elaborado mensalmente pela Confederação Nacional da Indústria (CNI), alcançou o menor valor da história neste mês de abril: 34,5 pontos. A queda de 25,8 pontos na comparação com março foi recorde. Desde janeiro, a queda acumulada é de 30,8 pontos.
“A queda na confiança dos empresários pode contribuir para a paralisação dos investimentos, ou seja, para o agravamento da crise econômica”, avalia o diretor de Desenvolvimento Industrial da CNI, Carlos Abijaodi.
De acordo com o relatório técnico do ICEI, “há dificuldades no fluxo de insumos, mercadorias e trabalhadores e as medidas de isolamento social e o consequente ‘desaparecimento do consumidor’ resultou em forte queda na receita das empresas”. O estudo também pontua a redução e o encarecimento do crédito, enquanto as despesas fixas continuam.
Antes da queda de 25,8 pontos, registrada entre março e abril, o maior recuo num único mês havia sido de 5,8 pontos, em junho de 2018, como consequência da greve dos caminhoneiros. A atual redução traduz o cenário atual de queda forte na atividade econômica e as dúvidas sobre quando o mundo voltará à normalidade.
Segundo o economista da CNI Marcelo Azevedo, o atual cenário global de incertezas impossibilita a realização de projeções reais para a economia. “Ainda não sabemos quanto tempo durará a crise e, a cada dia, o governo tem anunciado novas ações de estímulo. Estamos acompanhando e avaliando o cenário diariamente”, explica.
Também em entrevista à revista Indústria Brasileira, o professor de economia da Pontifícia Universidade Católica de São Paulo (PUC-SP), Antonio Carlos Alves dos Santos, concorda que é difícil calcular qualquer tipo de perda, mas diz que é possível ser otimista. “As rotas comerciais entre a maioria dos países ainda estão abertas. A expectativa é que, quando tudo estiver sob controle, nos próximos meses, as exportações sejam retomadas normalmente”, diz.
O ICEI de abril mostra, ainda, que a queda dos índices de confiança das diferentes regiões foi expressiva, com mais impacto no Sul, cujo índice acumulou uma queda de 34,6 pontos entre janeiro e abril. No Norte, foi registrada a menor queda na mesma base de comparação, mas ainda muito significativa, de 26,8 pontos.
A falta de confiança, contudo, alcança todos os setores da indústria. O indicador é menor entre os empresários da Indústria de Transformação (34,3 pontos) e da Construção (34,8 pontos) e um pouco maior entre os da Indústria Extrativa (39,1 pontos).
SERVIÇOS
IBGE. 12/05/2020. Setor de Serviços cai 6,9% em março
Em março de 2020, o volume de serviços no Brasil caiu 6,9% frente a fevereiro, na série com ajuste sazonal. Este é o resultado negativo mais intenso desde o início da série histórica (janeiro de 2011). Os impactos observados foram sentidos especialmente no último terço do mês de março, quando começaram as medidas de isolamento social devido à Covid-19. Em fevereiro, o índice havia recuado 1,0% frente ao mês anterior.
| Período | Variação (%) | |
|---|---|---|
| Volume | Receita Nominal | |
| Março 20 / Fevereiro 20* | -6,9 | -7,3 |
| Março 20 / Março 19 | -2,7 | -1,1 |
| Acumulado Janeiro-Março | -0,1 | 2,2 |
| Acumulado nos Últimos 12 Meses | 0,7 | 3,9 |
| Fonte: IBGE, Diretoria de Pesquisas, Coordenação de Indústria *série com ajuste sazonal | ||
Na série sem ajuste sazonal, no confronto com março de 2019, o volume de serviços recuou 2,7%, interrompendo uma sequência de seis taxas positivas. No acumulado do ano, o volume de serviços mostrou variação negativa de 0,1% frente a igual período do ano anterior e, nos últimos doze meses, acumula alta de 0,7%.
A retração de 6,9% do volume de serviços, de fevereiro para março de 2020, foi acompanhada por todas as cinco atividades investigadas, com destaque para as quedas em serviços prestados às famílias (-31,2%, o recuo mais intenso da série), e por transportes, serviços auxiliares aos transportes e correio (-9,0%), a segunda queda mais intensa da série, atrás apenas da de maio de 2018 (-9,5%), quando ocorreu a greve dos caminhoneiros. As pressões negativas mais intensas nesses segmentos vieram pela menor receita das empresas do ramo de alojamento e alimentação (-33,7%) e das empresas de transporte aéreo (-27,5%) e terrestre (-10,6%).
Os Serviços profissionais, administrativos e complementares (-3,6%) acumularam perda de 7,6% nos últimos 6 meses e os de informação e comunicação (-1,1%) caíram 3,2% entre janeiro e março deste ano. Já os outros serviços (-1,6%) eliminaram uma pequena parte do ganho de 8,3% acumulado entre setembro de 2019 e março de 2020.
Ainda na série com ajuste sazonal, a média móvel trimestral para o volume de serviços caiu 2,5% no trimestre encerrado em março de 2020 frente ao nível do mês anterior, intensificando o ritmo de queda frente a janeiro (-0,1%) e fevereiro (-0,4%). Quatro das cinco atividades recuaram neste mês: serviços prestados às famílias (-10,3%), transportes, serviços auxiliares aos transportes e correio (-2,0%), serviços profissionais, administrativos e complementares (-1,8%) e informação e comunicação (-1,1%). As duas últimas atividades mostraram taxas negativas desde dezembro de 2019 e de janeiro de 2020, respectivamente.
Por outro lado, o único setor que avançou neste indicador foram os outros serviços (0,1%), que mantiveram a trajetória ascendente iniciada em novembro de 2019.
Na comparação com igual mês de 2019, o recuo foi de 2,7% em março de 2020, com retração em apenas duas das cinco atividades de divulgação. Houve ainda crescimento em 39,8% dos 166 tipos de serviços investigados.
Entre as atividades, os serviços prestados às famílias (-33,4%) exerceram a principal influência negativa, tendo sido fortemente impactados pelas medidas de isolamento social que levaram à interrupção parcial ou total do funcionamento de estabelecimentos como restaurantes e hotéis. O outro recuo veio dos serviços profissionais, administrativos e complementares (-3,4%), explicado, em grande parte, pela perda de receita das empresas de administração de programas de fidelidade; agências de viagens; vigilância e segurança privadas; gestão de ativos intangíveis; e atividades técnicas ligadas à engenharia.
Já o setor de outros serviços (13,7%) deu a principal contribuição positiva, impulsionado, principalmente, pela maior receita das empresas de corretoras de títulos, administração de bolsas e mercados; e corretores e agentes de seguros, de previdência complementar e de saúde. Os demais avanços vieram de transportes, serviços auxiliares aos transportes e correio (0,3%), explicados pelo aumento da receita real vindo de gestão de portos e terminais e de atividades de armazenamento, entre outros; e de serviços de informação e comunicação (0,1%), impulsionados por atividades como provedores de conteúdo; atividades de TV aberta; suporte técnico em TI.
| Pesquisa Mensal de Serviços Indicadores do Volume de Serviços, segundo as atividades de divulgação Março 2020 - Variação (%) | ||||||||||||
|---|---|---|---|---|---|---|---|---|---|---|---|---|
| Atividades de Divulgação | Mês/Mês anterior (1) | Mensal (2) | Acumulado no ano (3) | Últimos 12 meses (4) | ||||||||
| JAN | FEV | MAR | JAN | FEV | MAR | JAN-JAN | JAN-FEV | JAN-MAR | Até JAN | Até FEV | Até MAR | |
| Volume de Serviços - Brasil | 0,4 | -1,0 | -6,9 | 1,6 | 0,6 | -2,7 | 1,6 | 1,1 | -0,1 | 1,0 | 0,7 | 0,7 |
| 1. Serviços prestados às famílias | 0,7 | -0,4 | -31,2 | 0,2 | 3,4 | -33,4 | 0,2 | 1,7 | -10,1 | 2,4 | 2,3 | -0,9 |
| 1.1 Serviços de alojamento e alimentação | 0,1 | -0,1 | -33,7 | 0,5 | 4,2 | -35,8 | 0,5 | 2,2 | -10,6 | 2,6 | 2,5 | -1,1 |
| 1.2 Outros serviços prestados às famílias | 2,2 | -0,4 | -12,6 | -1,4 | -0,7 | -20,0 | -1,4 | -1,0 | -7,5 | 1,3 | 1,1 | -0,4 |
| 2. Serviços de informação e comunicação | -0,9 | -1,2 | -1,1 | 2,0 | -0,4 | 0,1 | 2,0 | 0,8 | 0,6 | 3,1 | 2,6 | 2,6 |
| 2.1 Serviços de tecnologia da informação e comunicação (TIC) | -1,3 | -0,3 | 0,3 | 1,5 | 0,3 | 1,4 | 1,5 | 0,9 | 1,1 | 3,4 | 2,9 | 2,8 |
| 2.1.1 Telecomunicações | -0,3 | 0,1 | -1,7 | -4,0 | -2,3 | -3,4 | -4,0 | -3,2 | -3,2 | -1,3 | -1,6 | -1,7 |
| 2.1.2 Serviços de tecnologia da informação | -2,2 | -1,3 | 2,3 | 13,0 | 5,6 | 10,4 | 13,0 | 9,2 | 9,7 | 13,0 | 11,8 | 12,0 |
| 2.2 Serviços audiovisuais | 0,5 | -4,1 | -14,0 | 5,3 | -5,5 | -9,5 | 5,3 | -0,1 | -3,2 | 1,4 | 1,0 | 0,8 |
| 3. Serviços profissionais, administrativos e complementares | -0,7 | -1,2 | -3,6 | 0,0 | -3,4 | -3,4 | 0,0 | -1,7 | -2,3 | 0,7 | 0,3 | 0,2 |
| 3.1 Serviços técnico-profissionais | -2,0 | -3,1 | 1,3 | 0,4 | -6,2 | 2,3 | 0,4 | -3,0 | -1,2 | 3,1 | 2,3 | 2,8 |
| 3.2 Serviços administrativos e complementares | 0,0 | -1,6 | -7,0 | -0,1 | -2,4 | -5,3 | -0,1 | -1,2 | -2,6 | -0,2 | -0,4 | -0,6 |
| 4. Transportes, serviços auxiliares aos transportes e correio | 2,7 | 0,4 | -9,0 | 1,0 | 1,6 | 0,3 | 1,0 | 1,3 | 0,9 | -2,5 | -2,5 | -1,9 |
| 4.1 Transporte terrestre | 4,3 | 0,9 | -10,6 | -3,1 | -1,0 | -5,8 | -3,1 | -2,1 | -3,3 | -3,1 | -3,5 | -3,4 |
| 4.2 Transporte aquaviário | 6,4 | 5,0 | 0,0 | 9,9 | 12,4 | 23,9 | 9,9 | 11,2 | 15,6 | 3,3 | 3,8 | 5,7 |
| 4.3 Transporte aéreo | -0,2 | 0,2 | -27,5 | 8,8 | 6,8 | -11,7 | 8,8 | 7,8 | 1,6 | -5,0 | -5,2 | -5,4 |
| 4.4 Armazenagem, serviços auxiliares aos transportes e correio | 0,6 | -1,2 | -0,8 | 3,5 | 2,1 | 8,2 | 3,5 | 2,8 | 4,6 | -2,0 | -1,7 | -0,2 |
| 5. Outros serviços | 1,4 | 0,4 | -1,6 | 9,7 | 9,3 | 13,7 | 9,7 | 9,5 | 10,9 | 6,2 | 6,5 | 7,8 |
| Fonte: IBGE, Diretoria de Pesquisas, Coordenação de Indústria (1) Base: mês imediatamente anterior - com ajuste sazonal (2) Base: igual mês do ano anterior (3) Base: igual período do ano anterior (4) Base: 12 meses anteriores | ||||||||||||
No acumulado do ano, frente a igual período do ano anterior, o setor de serviços teve variação negativa de 0,1%, com retração em apenas duas das cinco atividades e com alta em menos da metade (41,0%) dos 166 tipos de serviços investigados.
Entre os setores, os serviços prestados às famílias (-10,1%) exerceram a influência negativa mais relevante, pressionados, especialmente, pela queda nas receitas de restaurantes; hotéis; e de catering, bufê e outros serviços de comida preparada. A reversão da trajetória de crescimento observada no setor, passando de uma expansão de 1,7% nos dois primeiros meses do ano para uma queda de 10,1% no primeiro trimestre de 2020, foi causada pelo fechamento parcial ou integral daqueles estabelecimentos, devido ao isolamento social.
O outro recuo veio de serviços profissionais, administrativos e complementares (-2,3%), explicado pela queda na receita das empresas de administração de programas de fidelidade, de soluções de pagamentos eletrônicos; de vigilância e segurança privadas; limpeza geral; atividades técnicas ligadas à arquitetura e à engenharia; e agências de viagens.
Na outra ponta, a principal contribuição positiva no acumulado do ano ficou com o setor de outros serviços (10,9%), seguido por transportes, serviços auxiliares aos transportes e correio (0,9%) e por informação e comunicação (0,6%).
Serviços caíram em 24 das 27 Unidades da Federação
A maior parte (24) das 27 unidades da federação teve retração no volume de serviços em março de 2020, em relação a fevereiro, acompanhando o recuo (-6,9%) do país. São Paulo (-6,2%) e Rio de Janeiro (-9,2%) sofreram as perdas mais importantes, pressionados pelos segmentos de alojamento e alimentação. Outras pressões negativas relevantes vieram do Rio Grande do Sul (-11,0%), Distrito Federal (-10,9%) e Paraná (-5,4%).
Em contrapartida, os únicos impactos regionais positivos vieram do Amazonas (1,9%), de Rondônia (3,1%) e do Maranhão (1,1%).
Na comparação com igual março de 2019, o recuo dos serviços no Brasil (-2,7%) foi acompanhado por 23 das 27 unidades da federação. As principais influências negativas ficaram com São Paulo (-1,3%), Bahia (-12,0%) e Rio Grande do Sul (-7,2%). Já as únicas contribuições positivas para o índice global vieram do Amazonas (3,3%), Maranhão (4,3%), Rondônia (8,0%) e Pará (1,4%).
No acumulado de janeiro a março de 2020, frente a igual período do ano anterior, a variação negativa do volume de serviços no Brasil (-0,1%) foi disseminada, pois 16 das 27 unidades da federação também mostraram retração na receita real de serviços.
Os principais impactos negativos ocorreram na Bahia (-6,8%), no Rio Grande do Sul (-4,6%) e em Minas Gerais (-1,7%). Por outro lado, São Paulo (0,9%) e Rio de Janeiro (1,6%) registraram as contribuições positivas mais relevantes sobre o índice nacional.
Índice de atividades turísticas tem recuo de 30%, o maior da série
Em março de 2020, o índice de atividades turísticas caiu 30,0% frente a fevereiro, queda mais intensa da série histórica. As medidas preventivas contra a Covid-19 atingiram de forma mais intensa e imediata boa parte das empresas que compõem os setores correlatos ao turismo, principalmente restaurantes, hotéis e transporte aéreo de passageiros.
Todas as doze unidades da federação onde as atividades turísticas são avaliadas acompanharam esta retração, com destaque para Rio de Janeiro (-36,6%), Minas Gerais (-30,8%) e São Paulo (-28,8%).
Na comparação com março de 2019, o volume de atividades turísticas no Brasil caiu 28,2%, interrompendo seis taxas positivas seguidas e pressionado, principalmente, pela queda de receita de restaurantes, hotéis, e transporte aéreo e rodoviário coletivo de passageiros. Em sentido oposto, o segmento de locação de automóveis apontou a principal contribuição positiva sobre a atividade turística.
As doze unidades da federação onde o indicador é investigado mostraram recuo nos serviços voltados ao turismo, com destaque para Rio de Janeiro (-30,5%), Minas Gerais (-28,3%) e São Paulo (-28,2%).
No acumulado do ano, as atividades turísticas caíram 6,2% frente a igual período de 2019, pressionado, mais uma vez, pelos ramos de restaurantes, hotéis, transporte rodoviário coletivo de passageiros e catering, bufê e outros serviços de comida preparada. Mas o segmento de locação de automóveis teve, de novo, o maior impacto positivo.
Os doze locais investigados também tiveram taxas negativas, com destaque para o Distrito Federal (-15,3%), Rio Grande do Sul (-10,1%), Minas Gerais (-8,5%) e São Paulo (-7,9%).
Pesquisa Mensal de Serviços. Serviços caem 6,9% em março, pior resultado do setor desde 2011. Hotéis e restaurantes foram os principais serviços afetados pelas medidas de isolamento social
O volume de serviços caiu 6,9% em março, em comparação com fevereiro, alcançando o pior resultado do setor na série histórica da Pesquisa Mensal de Serviços (PMS), iniciada em janeiro de 2011. Os dados de março, divulgados hoje (12) pelo IBGE, mostram que a retração é uma consequência das medidas de isolamento social para conter o avanço do contágio da Covid-19. É a segunda queda consecutiva do setor, que recuou 1% em fevereiro.
Todas as cinco atividades pesquisadas tiveram quedas, com destaque para serviços prestados às famílias (-31,2%) e transportes, serviços auxiliares aos transportes e correio (-9%).
“Essa queda é motivada, em grande parte, pelas paralisações que aconteceram nos estabelecimentos, sobretudo nos restaurantes e hotéis, que fazem parte dos serviços prestados às famílias. Outras empresas também sentiram bastante depois do fechamento parcial ou total, como os segmentos de transporte aéreo e algumas empresas de transporte rodoviário coletivo de passageiros”, explica o gerente da pesquisa, Rodrigo Lobo.
Volume de serviços (mês/mês anterior)
Clique e arraste para zoom
Fonte: IBGE - Pesquisa Mensal de Serviços
Os impactos observados sobre as empresas do setor de serviços foram sentidos principalmente nos últimos dez dias do mês de março, quando começaram as paralisações. “Aos poucos os governos locais foram tomando medidas mais fortes no sentido de se praticar o isolamento social e com isso algumas empresas de setores considerados não essenciais, como restaurantes, acabaram tendo que funcionar de forma parcial, muitas vezes migrando para o sistema de delivery, mas os hotéis não têm essa opção e acabaram fechando”, explica o gerente.
Os serviços prestados às famílias tiveram a queda mais intensa desde o início da série histórica, enquanto transportes, serviços auxiliares aos transportes e correio tiveram a segunda queda mais intensa da série, ficando atrás apenas de maio de 2018, quando ocorreu a greve dos caminhoneiros.
As outras atividades que tiveram queda nesse mês foram serviços profissionais, administrativos e complementares (-3,6%), informação e comunicação (-1,1%) e outros serviços (-1,6%).
Regionalmente, 24 das 27 unidades da federação também tiveram resultados negativos em março, quando comparado a fevereiro, com destaque para São Paulo (-6,2%) e Rio de Janeiro (-9,2%), pressionados pelos segmentos de alojamento e alimentação. Os únicos impactos positivos vieram do Amazonas (1,9%), de Rondônia (3,1%) e do Maranhão (1,1%).
Na comparação com março de 2019, o volume do setor de serviços recuou 2,7% em março de 2020, com retração em duas das cinco atividades de divulgação: serviços prestados às famílias (-33,4%) e serviços profissionais, administrativos e complementares (-3,4%).
“Essa taxa de 2,7% interrompe uma sequência de seis taxas positivas. A retração dos serviços prestados às famílias foi pressionada pelos segmentos de hotéis e restaurantes e os serviços profissionais, administrativos e complementares, pressionados pelas empresas de administração de programas de fidelidade, vigilância e segurança privadas, atividades correlacionadas à engenharia, entre outras”, exemplifica Rodrigo.
Índice de atividades turísticas cai 30%
A queda nos segmentos de hotéis e restaurantes, além de transportes aéreos de passageiros e agências de viagens, também impactou o índice de atividades turísticas de março, que caiu 30% em relação a fevereiro. É a retração mais acentuada desde o início da série histórica, também iniciada em janeiro de 2011.
Regionalmente, todas as 12 unidades da federação pesquisadas neste indicador acompanharam a retração observada no país, com destaque para São Paulo (-28,8%), Rio de Janeiro (-36,6%) e Minas Gerais (-30,8%).
DOCUMENTO: https://agenciadenoticias.ibge.gov.br/agencia-sala-de-imprensa/2013-agencia-de-noticias/releases/27646-setor-de-servicos-cai-6-9-em-marco
AGRICULTURA
IBGE. 12/05/2020. Em abril, IBGE prevê alta de 2,3% na safra de 2020
Em abril, a produção de cereais, leguminosas e oleaginosas para 2020 foi estimada em 247,0 milhões de toneladas, 2,3% acima da safra de 2019 (mais 5,5 milhões de toneladas) e 0,8% superior ao mês anterior (mais 1,9 milhão de toneladas). Já a área a ser colhida é de 64,5 milhões de hectares, 2,0% acima da de 2019 (mais 1,3 milhão de ha) e 0,2% maior que a estimativa anterior (mais 152,1 mil ha).
O arroz, o milho e a soja são os três principais produtos deste grupo e, somados, representaram 92,6% da estimativa da produção e responderam por 87,4% da área a ser colhida. Em relação a 2019, houve acréscimos de 1,7% na área do milho (aumentos de 4,1% no milho de primeira safra e de 0,4% no milho de segunda safra), de 2,5% na área da soja e de 0,9% para a área do algodão herbáceo, além de queda de 1,9% na área de arroz.
| Estimativa de abril para 2020 | 247,0 milhões de toneladas |
| Variação safra 2020 / safra 2019 | 2,3% (5,5 milhões de toneladas) |
| Variação safra 2020 / 3ª estimativa 2020 | 0,8% (1,9 milhões de toneladas) |
A estimativa é de acréscimos de 6,7% para a soja (121,0 milhões de toneladas) e de 3,5% para o arroz (10,6 milhões de toneladas). São esperados decréscimos de 3,4% para o milho (crescimento de 2,2% no milho de primeira safra e decréscimo de 5,4% no milho de segunda safra), com produção de 97,1 milhões de toneladas (26,6 milhões de toneladas de milho na primeira safra e 70,6 milhões de toneladas de milho na segunda safra) e declínio de 2,0% para o algodão herbáceo (6,8 milhões de toneladas).

A distribuição da produção de cereais, leguminosas e oleaginosas foi a seguinte: Centro-Oeste (115,2 milhões de toneladas), Sul (76,1 milhões de toneladas), Sudeste (24,1 milhões de toneladas), Nordeste (21,1 milhões de toneladas) e Norte (10,5 milhões de toneladas). Isso representa aumento em quase todas as regiões: Centro-Oeste (3,3%), Região Norte (7,0%), Região Nordeste (1,5%) e Região Sudeste (1,4%). A Região Sul declinou 1,4%.
Na distribuição da produção pelas Unidades da Federação, o Mato Grosso lidera como maior produtor nacional de grãos, com uma participação de 27,9%, seguido pelo Paraná (16,7%), Rio Grande do Sul (11,4%), Goiás (10,4%), Mato Grosso do Sul (8,0%) e Minas Gerais (6,0%), que, somados, representaram 80,4% do total nacional. Com relação à participação das regiões brasileiras, tem-se a seguinte distribuição: Centro-Oeste (46,6%), Sul (30,8%), Sudeste (9,8%), Nordeste (8,5%) e Norte (4,3%).
Destaques na estimativa de abril de 2020 em relação a março
Em abril, destacaram-se as variações nas seguintes estimativas de produção em relação a março: trigo (27,7%), da cevada (11,3%), da aveia (6,0%), do tomate (2,3%), do sorgo (2,1%), do feijão 1ª safra (1,6%) e da soja (0,3%). Houve declínios na produção do feijão 2ª safra (-7,7%), da mandioca (-1,8%) e do milho 2ª safra (-0,2%).
Em números absolutos, os destaques foram para as variações do trigo (1,4 milhão de toneladas), soja (324,0 mil toneladas), milho de 2ª safra (-114,8 mil toneladas), tomate (88,1 mil toneladas), sorgo (56,5 mil toneladas), aveia (54,8 mil toneladas), cevada (42,6 mil toneladas), feijão de 1ª safra (21,2 mil toneladas), feijão 2ª safra (-96,8 mil toneladas) e mandioca (-346,5 mil toneladas).
CEREAIS DE INVERNO (em grão) – A produção do trigo foi estimada em 6,2 milhões de toneladas, crescimento de 27,7% em relação a março. Em relação ao ano anterior, a estimativa é 19,4% maior. A Região Sul deve responder, em 2020, por 88,7% da produção tritícola nacional. No Paraná, a produção foi estimada em 3,5 milhões de toneladas, crescimento de 63,2% em relação ao mês anterior. O rendimento médio e a área plantada cresceram 55,4% e 5,0%, respectivamente. A produção paranaense subiu 64,1% em relação a 2019. O Rio Grande do Sul deve produzir 1,9 milhão de toneladas, declínio de 17,5% em relação ao ano anterior e, Santa Catarina, 155,1 mil toneladas.
A estimativa da produção da aveia foi de 972,1 mil toneladas, crescimento de 6,0% em relação ao mês anterior. Os maiores produtores do cereal são Rio Grande do Sul, com 632,6 mil toneladas, e Paraná, com 231,5 mil toneladas. Em relação a 2019, a produção da aveia deve crescer 6,6%.
Para a cevada, a produção estimada é de 418,6 mil toneladas, crescimento de 11,3% em relação a março. Os maiores produtores do cereal são Paraná, com 286,6 mil toneladas, e Rio Grande do Sul, com 117,0 mil toneladas. Em relação ao ano anterior, a produção de cevada deve crescer 4,5%.
FEIJÃO (em grão) – A estimativa da produção foi de 3,0 milhões de toneladas, declínio de 2,4% em relação ao mês anterior. A estimativa para a área plantada e para o rendimento médio diminuíram 0,6% e 1,8%, respectivamente. Neste levantamento, os maiores produtores, somadas as três safras, são Paraná com 22,2%, Minas Gerais com 16,6% e Goiás com 11,3% de participação na produção nacional. Com relação à variação anual, a estimativa para a área plantada e para a produção foi reduzida em 4,8% e 1,9%, respectivamente. Já o rendimento médio foi reduzido em 1,4%.
A 1ª safra de feijão foi estimada em 1,4 milhão de toneladas, aumento de 1,6% frente à estimativa de março, o que representa 21,1 mil toneladas. Destaque positivo para o Ceará, que teve a produção aumentada 18,3%, o equivalente a 17,8 mil toneladas, em decorrência do crescimento do rendimento médio, que foi de 23,7%. Houve crescimentos de 5,8% na produção, de 0,8% na área colhida e de 5,0% no rendimento médio, em relação ao ano anterior. Nesta avaliação, as Unidades da Federação com maior participação na estimativa de produção foram Paraná (23,8%), Minas Gerais (11,9%) e São Paulo (10,5%).
A 2ª safra de feijão foi estimada em 1,2 milhão de toneladas, redução de 7,7% frente à estimativa de março, refletindo o rendimento médio que ficou 7,6% menor. Devido a uma forte estiagem, houve declínio de 22,7% na estimativa de produção do Paraná (98,2 mil toneladas.) Em contrapartida, Alagoas aguarda um aumento de 10,5% em sua estimativa de produção. Já em relação à variação anual, a estimativa de produção nacional recuou 0,6%. Para o rendimento médio, está previsto um aumento de 5,1% e, para a área a ser colhida, um declínio de 5,4%. As maiores estimativas de produção, para esta safra, foram dos Estados do Paraná (28,8%), Bahia (15,9%) e Minas Gerais (14,6%).
Com relação à 3ª safra de feijão, a estimativa de produção foi de 464,1 mil toneladas, aumento de 0,6% frente a março. A área a ser plantada também teve sua estimativa aumentada em 0,5%. Destaque para Goiás que prevê aumento de 1,9% para a estimativa de produção e de 1,8% para a área plantada. Em relação ao ano anterior, a estimativa de produção sofreu uma redução de 21,1%, com a área a ser plantada declinando 20,2%.
MANDIOCA (raiz) - A estimativa da produção foi de 18,8 milhões de toneladas, 1,8% abaixo do mês anterior. Houve redução de 1,3% na área plantada e de 0,5% no rendimento médio. Em abril, caíram as estimativas de produção do Acre (-39,0%) e de Rondônia (-5,7%).
Os aumentos na estimativa da produção mais importantes foram em Alagoas (4,1%), Minas Gerais (5,5%) e Paraná (0,3%), embora insuficientes para compensar o declínio da produção na Região Norte. Preços pouco compensadores têm desestimulado o plantio da mandioca.
MILHO (em grão) – A estimativa da produção cresceu 0,1%, totalizando 97,1 milhões de toneladas. Em relação ao ano anterior, a produção encontra-se menor em 3,5 milhões de toneladas (-3,4%), com queda de 5,7% no rendimento médio, e aumentos de 1,8% na área a ser plantada e de 2,4% na área a ser colhida.
Na 1ª safra de milho, a produção alcançou 26,6 milhões de toneladas, acréscimo de 0,8% em relação a março. Em relação a 2019, a produção foi 2,2% maior, havendo incrementos de 2,3% na área plantada e declínio de 1,9% no rendimento médio. A área a ser colhida apresentou aumento de 4,1%.
Houve aumento na produção do Ceará (37,6% ou 132,6 mil toneladas), tendo o rendimento médio crescido 40,5% em decorrência do clima favorável. Outros crescimentos da produção foram verificados em Rondônia (9,5% ou 12,3 mil toneladas), Maranhão (0,8% ou 9,4 mil toneladas) e Paraná (1,8% ou 62,0 mil toneladas). Apesar da concorrência pelas áreas disponíveis de plantio com a soja, que normalmente apresenta rentabilidade maior, a demanda crescente pelo cereal manteve os preços do produto em patamares elevados, o que contribuiu para aumentar os investimentos nas lavouras do milho da primeira safra.
Para a 2ª safra, a estimativa da produção foi de 70,6 milhões de toneladas, declínio de 0,2% em relação ao mês anterior. A redução mais intensa da estimativa da produção foi no Paraná (2,0% ou 250,3 mil toneladas). Já os maiores crescimentos devem vir de Rondônia (9,0% ou 73,6 mil toneladas), Alagoas (12,7% ou 6,5 mil toneladas) e Goiás (0,6% ou 54,9 mil toneladas). Na comparação anual, a produção do milho 2ª safra apresenta declínio de 5,4%.
SOJA (em grão) – A estimativa de produção de soja para 2020 totalizou 121,0 milhões de toneladas, o que representa um aumento de 6,7% em relação à safra anterior. Na atualização mensal, verificou-se um acréscimo de 0,3% no volume colhido, impactado, principalmente, pela atualização de dados em Rondônia e na Bahia, e com registro de uma leve redução da produção no Paraná. Com esses novos dados, a produção nacional estimada para o ano permanece superior ao recorde de volume de soja registrado no País em 2018.
Houve revisão de dados em Rondônia, que registrou acréscimo de 196,5 mil toneladas, o que representa um aumento de 16,9% na comparação com o mês anterior. O rendimento médio da cultura na Bahia, que neste ano deve atingir 3 549 kg/ha, também foi revisto em 2,9%, elevando a estimativa de produção em 159,0 mil toneladas.
Por outro lado, o Paraná, segundo maior produtor nacional, com o fechamento da colheita da primeira safra, revisou o rendimento médio da cultura, registrando decréscimo de 0,3%, o que impactou na redução de 61,2 mil toneladas de grãos, na comparação com a produção levantada no mês de março. Ainda assim, a produção deve alcançar 20,7 milhões de toneladas em 2020, novo recorde para o estado.
Em relação ao ano anterior, o Rio Grande do Sul e Santa Catarina devem apresentar queda na produção anual de 27,7% e 3,5%, respectivamente, em decorrência de uma forte estiagem nos primeiros meses do ano. O Mato Grosso, que em 2020 deve responder por 28,7% do volume de soja a ser produzido pelo País, com um volume estimado de 34,7 milhões de toneladas, segue como maior produtor nacional.
SORGO (grão) – A estimativa da produção foi de 2,7 milhões de toneladas, aumento de 2,1% em relação ao mês anterior. O rendimento médio apresentou crescimento de 1,2% devido às boas condições climáticas ocorridas em algumas Unidades da Federação. Na Região Centro-Oeste, Goiás aumentou sua estimativa de produção em 4,5%. Com uma produção de 1,3 milhão de toneladas, é o maior produtor brasileiro do cereal, devendo participar com 47,7% do total nacional em 2020.
A estimativa de produção do sorgo está 5,9% maior que a produção obtida em 2019, influenciada, principalmente, pelo aumento do rendimento médio, estimado em 5,2%. Diversas Unidades da Federação aumentaram as estimativas de produção, dentre elas: Ceará (150,0%), Pernambuco (104,9%), Bahia (22,7%), Mato Grosso (15,2%), Goiás (19,5%) e Distrito Federal (58,0%).
TOMATE - A produção deve alcançar 3,9 milhões de toneladas, um aumento de 2,3% em relação ao divulgado em março. As variações positivas ocorreram, principalmente, no Paraná (60,2%), Minas Gerais (0,9%) e Rio de janeiro (0,6%). Apesar do aumento em abril, diversos fatores têm afetado negativamente a cultura, como, o elevado custo de produção, que tem afastado os produtores e, consequentemente, reduzido a área cultivada. Em relação ao ano anterior, a queda na produção chega a 4,8%, com redução de 3,9% na área plantada.
Produção agrícola. Em ano de perdas na economia com a Covid-19, safra deve ser recorde em 2020. Colheita da soja deve crescer 121 milhões de toneladas este ano
Diferente dos outros indicadores da economia que acumulam perdas em razão da pandemia de Covid 19, a safra nacional de grãos deve bater novo recorde e chegar a 247 milhões de toneladas em 2020, segundo a estimativa de abril do Levantamento Sistemático da Produção Agrícola (LSPA), divulgado hoje (12) pelo IBGE. Isso corresponde a um aumento de 0,8% em relação à previsão de março e de 2,3% na comparação com a colheita de 2019, uma diferença de 5,5 milhões de toneladas.
De acordo com o analista Agropecuária do IBGE, Carlos Antônio Barradas, esse aumento na comparação anual deve-se, principalmente, ao crescimento da estimativa de 6,7% para a soja (mais 121 milhões de toneladas) e de 3,5% para o arroz (mais 10,6 milhões de toneladas).
“O clima beneficiou bastante a soja, com a exceção do Rio Grande do Sul. Além disso, como os preços da soja estão bons, os produtores ampliaram a área de plantio”, disse o pesquisador. “Por outro lado, o Rio Grande do Sul teve uma boa safra de arroz, o que elevou as estimativas de produção para este ano”.
Barradas destaca ainda decréscimo de 3,4% na safra do milho (97,1 milhões de toneladas). “Principalmente no milho de segunda safra (-5,4%). No ano passado, o clima ajudou muito, houve uma janela de plantio maior. Neste ano a janela de plantio foi mais restrita”, disse o pesquisador, acrescentando que soja, arroz e milho representam 92,6% da estimativa da produção e 87,4% da área a ser colhida.
Já na comparação com o mês de março, a variação de 0,8% da safra resulta do crescimento das estimativas de colheita do trigo (mais 1,4 milhão de toneladas) e da soja (mais 322 mil toneladas), principalmente. A cevada (mais 42,6 mil toneladas) e a aveia (mais 64,8 mil toneladas), que integram junto com o milho os grãos de inverno, também subiram no comparativo mensal.
“O aumento na cotação do dólar favoreceu o preço do trigo e, com isso, o produtor deve plantar uma área maior”, disse Barradas. “O mesmo aconteceu com a soja. A medida que foi colhendo o grão, o produtor se deparou com um rendimento um pouco melhor, o que resultou em alta de 0,3% na estimativa de colheita”.
Mato Grosso estima colher quase 35 milhões de toneladas de soja em 2020
Em 2020, o Mato Grosso deve seguir como maior produtor nacional de soja. O estado deve responder por 28,7% do volume do grão a ser produzido no país, um volume estimado de 34,7 milhões de toneladas.
Já Paraná, segundo maior produtor de soja, com o fechamento da colheita da primeira safra, revisou o rendimento médio da cultura, registrando decréscimo de 0,3%, o que impactou na redução de 61,2 mil toneladas de grãos, na comparação com a produção levantada no mês de março. Ainda assim, a produção deve alcançar 20,7 milhões de toneladas este ano, novo recorde para o estado.
DOCUMENTO: https://agenciadenoticias.ibge.gov.br/agencia-sala-de-imprensa/2013-agencia-de-noticias/releases/27649-em-abril-ibge-preve-alta-de-2-3-na-safra-de-2020
CONAB. 12 de Maio de 2020. Levantamento de grãos confirma produção acima de 250 milhões de toneladas na safra 2019/2020
Apesar do impacto causado pelos problemas climáticos na Região Sul sobre a produtividade de soja e milho, o volume da produção de grãos no país está estimado em 250,9 milhões de toneladas, 3,6% ou 8,8 milhões de t superior ao colhido em 2018/19. Em relação ao levantamento passado (abril/2020), houve uma queda de 0,4%, mas a estimativa de safra recorde para essas duas culturas se mantém. É o que aponta o 8º Levantamento da Safra 2019/2020, divulgado nesta terça-feira (12) pela Companhia Nacional de Abastecimento (Conab).
As culturas de primeira safra estão com a colheita praticamente encerrada e a conclusão da produção ainda depende do comportamento climático nas culturas de segunda safra, que se encontram em estágio avançado de desenvolvimento. Em relação às culturas de terceira safra e de inverno, o plantio ainda está em andamento. Vale lembrar que os agricultores continuam suas atividades, tomando os cuidados necessários para o enfrentamento da pandemia de COVID-19. Com relação à área plantada, a estimativa é de um crescimento de 3,5%, ou 2,2 milhões de hectares em relação à safra passada, que significa um total de 65,5 milhões de ha.
A produção de soja está estimada em 120,3 milhões de t, um ganho de 4,6% em relação à safra 2018/19. Com o avanço da colheita no Rio Grande do Sul, foi confirmado o menor rendimento ocasionado pelas condições climáticas desfavoráveis.
Com o fim da colheita próximo, a produção do milho primeira safra é de 25,3 milhões de t, 1,5% inferior à safra passada. O milho segunda safra deverá ter uma produção de 75,9 milhões de t, com área total de 13,8 milhões de ha, um crescimento de 7%. Já o milho terceira safra deverá alcançar uma produção de 1,17 milhão de t, com uma área plantada de 511,2 mil ha. Para o milho total, que é o somatório dos três, a produção deverá ser de 102,3 milhões de t com área de 18,5 milhões de ha.
A produção de feijão primeira safra ficará em 1,08 milhão de t, 8,9% superior ao volume produzido no período anterior. O feijão segunda safra deve alcançar uma produção de 1,24 milhão de t. A colheita já está iniciada. Estima-se uma redução de 0,8% na área cultivada. O feijão terceira safra está em fase de plantio. A área está estimada em 589,5 mil hectares, com um crescimento de 1,5% sobre a área da safra anterior. O feijão total apresenta uma produção de 3 milhões de toneladas e uma área de 2,9 milhões de ha. Desse total de produção, 1,9 mil t são de feijão-comum cores, 687,4 mil t de feijão-caupi e 509,5 mil t de feijão-comum preto.
As condições climáticas vêm favorecendo o desenvolvimento do algodão. Esta cultura deverá ter uma produção de 2,88 milhões de toneladas de pluma, 3,6% superior à safra passada. A colheita do arroz está próxima de se encerrar. A produção está estimada em 10,8 milhões de toneladas, 3,9% superior ao volume produzido na safra passada. Dessas, 9,9 milhões de toneladas em áreas de cultivo irrigado e o restante em áreas de plantio de sequeiro.
Culturas de inverno – Sobre as culturas de inverno (aveia, canola, centeio, cevada, trigo e triticale), o plantio ainda está no início. Deve ocorrer um crescimento de 2% na área plantada, com destaque para o trigo. O plantio em andamento mostra boas perspectivas, com crescimento de 2,4% na área a ser cultivada, 2,1 milhões de hectares ao todo, e uma produção de 5,4 milhões de toneladas.
8º Levantamento – Safra 2019/20: https://www.conab.gov.br/info-agro/safras/graos/boletim-da-safra-de-graos
COMÉRCIO EXTERIOR BRASILEIRO
MEconomia. 11/05/2020. COMÉRCIO EXTERIOR. Balança comercial tem superávit de US$ 2,475 bilhões na primeira semana de maio. Corrente de comércio no período, com cinco dias úteis, chega a US$ 9,414 bilhões
Abalança comercial brasileira registrou superávit de US$ 2,475 bilhões e corrente de comércio de US$ 9,414 bilhões, na primeira semana de maio de 2020 – com cinco dias úteis –, como resultado de exportações no valor de US$ 5,945 bilhões e importações de US$ 3,47 bilhões. Os dados foram divulgados nesta segunda-feira (11/5) pela Secretaria de Comércio Exterior (Secex) do Ministério da Economia.
No ano, as exportações totalizam US$ 73,306 bilhões e as importações, US$ 59,031 bilhões, com saldo positivo de US$ 14,275 bilhões e corrente de comércio de US$ 132,336 bilhões.
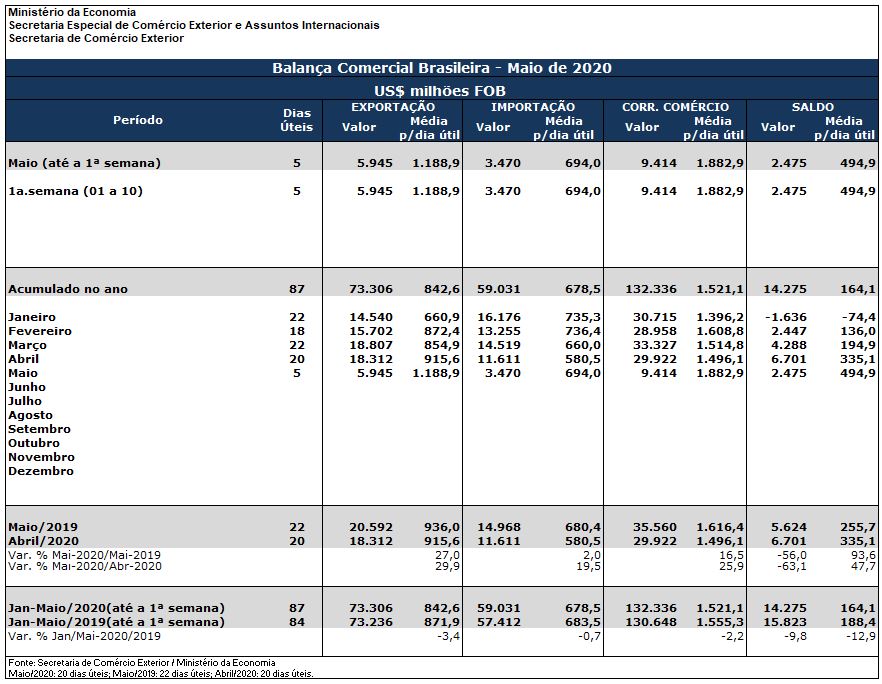
Análise do mês
Nas exportações, comparadas a média até a primeira semana de maio de 2020 (US$ 1.188,9 milhões) com a de maio de 2019 (US$ 936,02 milhões), houve crescimento de 27%, devido ao aumento nas vendas em Agropecuária (+104,5%) e em produtos da Indústria de Transformação (+15,5%). Por outro lado, caíram as vendas na Indústria Extrativa (-16,7%).
O aumento nas exportações foi puxado, principalmente, pelo crescimento de vendas nos seguintes produtos agropecuários: Soja (+124,1%); Café não torrado (+ 74,5%); Algodão em bruto (+ 45,7%); Arroz com casca, paddy ou em bruto (+ 756,1%) e Especiarias (+ 183,0%). Na Indústria de Transformação, o crescimento das exportações se deu pelo aumento das vendas de Açúcares e melaços (+ 140,2%); Carne bovina fresca, refrigerada ou congelada (+ 114,5%); Ouro, não monetário - excluindo minérios de ouro e seus concentrado - (+ 144,9%); Farelos de soja e outros alimentos para animais, excluídos cereais não moídos, farinhas de carnes e outros animais (+ 70,3%) e Celulose (+ 37,2%).
RESULTADOS PRELIMINARES
Na 1ª semana de Maio de 2020, a balança comercial registrou superávit de US$ 2,475 bilhões e corrente de comércio de US$ 9,414 bilhões, resultado de exportações no valor de US$ 5,945 bilhões e importações de US$ 3,47 bilhões. No ano, as exportações totalizam US$ 73,306 bilhões e as importações, US$ 59,031 bilhões, com saldo positivo de US$ 14,275 bilhões e corrente de comércio de US$ 132,336 bilhões.
DOCUMENTO: http://www.mdic.gov.br/index.php/comercio-exterior/estatisticas-de-comercio-exterior/balanca-comercial-brasileira-semanal
AVIAÇÃO
EMBRAER. BOEING. 12/05/2020. Embraer entrega cinco jatos comerciais e nove executivos no 1T20
São José dos Campos - SP, 12 de maio de 2020 – A Embraer (NYSE; ERJ; B3; BOVESPA; EMBR3) entregou um total de 14 jatos no primeiro trimestre de 2020, sendo cinco comerciais e nove executivos (cinco leves e quatro grandes). Em 31 de março de 2020, a carteira de pedidos firmes a entregar totalizava USD 15,9 bilhões.
Historicamente, a Embraer realiza menos entregas no primeiro trimestre do ano, e em 2020 em particular, as entregas da aviação comercial no 1T20 foram também impactadas negativamente pela conclusão do processo de separação da unidade da Aviação Comercial da Embraer, em janeiro.
No 1T20, a Embraer Aviação Executiva anunciou a certificação tripla do novo Phenom 300E por parte da Agência Nacional de Aviação Civil (ANAC), da Federal Aviation Administration (FAA) e da Agência Europeia para a Segurança da Aviação (European Aviation Safety Agency – EASA). O novo Phenom 300E é a versão aprimorada da série Phenom 300, jato executivo com o maior número de entregas da última década.
Ainda no período, a EMGEPRON, empresa estatal independente vinculada ao Ministério da Defesa por intermédio do Comando da Marinha do Brasil, e a Águas Azuis, empresa formada pela thyssenkrupp Marine Systems, Embraer Defesa & Segurança e Atech, assinaram o contrato para a construção dos quatro navios Classe Tamandaré de última geração, com entrega prevista entre 2025 e 2028.
PORTAL G1. REUTERS. Embraer culpa queda em entregas de jatos a acordo fracassado com Boeing
Empresa disse nesta terça que entregou apenas cinco jatos comerciais no primeiro trimestre.
A Embraer disse nesta terça-feira (12) que entregou apenas cinco jatos comerciais no primeiro trimestre, menos da metade do que entregou há um ano, atrelando a queda aos preparativos para vender para a Boeing o controle da divisão responsável pelos aviões, negócio que acabou fracassando.
A Embraer esperava que a venda da divisão de aviação comercial para a Boeing impulsionasse as vendas dos jatos E2. Mas a Boeing desistiu do negócio no mês passado sob circunstâncias controversas.
Os números são o primeiro vislumbre do que está em jogo para a terceira maior fabricante de aviões do mundo. Analistas temem que a Embraer tenha dificuldades para competir com o duopólio Boeing-Airbus.
Os resultados da Embraer parecem incluir alguns cancelamentos de pedidos, algo que todas as fabricantes de aviões têm enfrentado desde que a pandemia de coronavírus levou o setor aéreo global a uma paralisação a partir das últimas duas semanas de março.
As encomendas firmes do avião mais vendido da Embraer - o E175, com capacidade para até 90 pessoas - caíram 15 jatos, sem contar os aviões que foram entregues no período. Incluindo as chamadas "opções" mais flexíveis, que também caíram 15 jatos. No geral, a carteira de pedidos para o jato é de 456.
As encomendas de outros modelos de aviões comerciais da Embraer permaneceram iguais.
A Embraer não comentou imediatamente os aparentes cancelamentos de pedidos.
Os números da Embraer foram baixos mesmo considerando que foi o primeiro trimestre, normalmente o mais fraco do ano. A empresa entregou 11 jatos comerciais em 2019 e 14 em 2018.
A companhia afirmou que as entregas tiveram "um impacto negativo" pela preparação em janeiro para concluir a transação com a Boeing.
Em janeiro, a Embraer enviou seus funcionários para casa por duas semanas e suspendeu a produção para se preparar para a venda do controle da divisão para a Boeing.
A empresa também disse que sua carteira de pedidos firmes a entregar, um indicador de receita futura, totalizou 15,9 bilhões de dólares em 31 de março, ante 16,8 bilhões no final de 2019. As entregas de jatos executivos também caíram ligeiramente, para 9 entregas, em comparação com 11 no ano passado.
_______________
SPECIAL
CHINA
Rhodium Group. CHINA. May 12, 2020. COVID-19 and China's Household Debt Dilemma
By Logan Wright and Allen Feng
China’s households have been among the world’s best savers—until recently. In only five years, household debt has surged to 128% of household income, and 56% of Chinese GDP. While most of this growth is tied to China’s property market in the form of mortgage debt, consumer credit has expanded rapidly as well: credit card debt in China now exceeds US levels in absolute terms. Economic fallout from the COVID-19 outbreak now threatens to intensify the financial risks arising from the increase in household borrowing, with implications for financial stability, consumption growth, and the broader economy.
We recently examined China’s rising household debt burden in detail, including the financial vulnerabilities from virus-related shutdowns. Our key findings are:
China’s recent household debt expansion rivals that of the United States pre-crisis, within a smaller economy. Over the past five years from 2015 to 2019, China’s households have added $4.6 trillion in borrowing, compared to a $5.1 trillion expansion in US household debt from Q3 2003 to Q3 2008.
Most household debt is linked to the property market, so household debt growth should slow this year. Property sales have been impacted by the virus, and mortgage loan growth should decelerate, along with overall household debt.
The economic fallout of the virus outbreak may include rising household defaults. The industries hit hardest by virus-related shutdowns are among the lower-wage industries in China.
***
China’s households have been among the world’s best savers—until recently. In only five years, household debt has surged to 128% of household income, and 56% of Chinese GDP. While most of this growth is tied to China’s property market in the form of mortgage debt, consumer credit has expanded rapidly as well: credit card debt in China now exceeds US levels in absolute terms. Economic fallout from the COVID-19 outbreak now threatens to intensify the financial risks arising from the increase in household borrowing, with implications for financial stability, consumption growth, and the broader economy.
We recently examined China’s rising household debt burden in detail, including the financial vulnerabilities from virus-related shutdowns. Our key findings are:
- China’s recent household debt expansion rivals that of the United States pre-crisis, within a smaller economy. Over the past five years from 2015 to 2019, China’s households have added $4.6 trillion in borrowing, compared to a $5.1 trillion expansion in US household debt from Q3 2003 to Q3 2008.2008.
- Most household debt is linked to the property market, so household debt growth should slow this year.Property sales have been impacted by the virus, and mortgage loan growth should decelerate, along with overall household debt.
- The economic fallout of the virus outbreak may include rising household defaults. The industries hit hardest by virus-related shutdowns are among the lower-wage industries in China.
For years, China’s financial system grew rapidly, but most bank credit was allocated to state-owned enterprises. Loans were generally backed by fixed assets as collateral or government guarantees, and the proceeds were invested in new fixed capital rather than consumed. As a result, even though credit expansion was extremely fast, China’s credit growth was thought to be different in nature from the consumer debt bubbles that had produced financial institution defaults and insolvencies in developed markets when they finally burst. Corporate leverage to fund new investment was generally viewed as more stable than household leverage to fund consumption.
What a difference five years makes. From the end of 2014 to 2019, China’s corporates added an astonishing 37.9 trillion yuan in new formal borrowing ($5.5 trillion). But China’s households joined in the party for the first time, adding 32.2 trillion yuan in debt from banks alone ($4.6 trillion). The surge in China’s household borrowing is comparable in size to the runup in US household debt in advance of the global financial crisis (although household debt was not the only factor involved in that crisis, of course). US household debt rose by $5.1 trillion from Q3 2003 to Q3 2008.
Simply put, the structure of China’s debt has changed significantly in the last five years, and risks from both corporate and household borrowing are now prominent. There are already limits to how much new debt corporates can add, given the rise in defaults, the declining marginal returns to new credit and investment, and the rising proportion of credit used to service older debt. The historically underleveraged household balance sheets were the last frontier of China’s historic credit expansion.
Some expansion in household borrowing was therefore predictable, as households have historically been underbanked in China, when the system favored state-owned corporates. The question now is whether or not the rise in household debt has been too fast, given the pressure that the virus outbreak and its corresponding economic shutdowns will place on employment and household incomes. The imbalanced structure of the Chinese economy is a key source of financial system risk: household incomes make up a far smaller proportion of China’s economy than in a more developed one. They are estimated at only 43% of GDP in 2019, a proportion that has remained relatively stable throughout the past decade. As a result, even though the aggregate level of household debt in China (conservatively estimated via bank loans at 56.5 trillion yuan or $8.0 trillion at the end of March) is only a bit over half of US levels, the debt level is now similar in size to the pre-crisis United States level as a proportion of household income
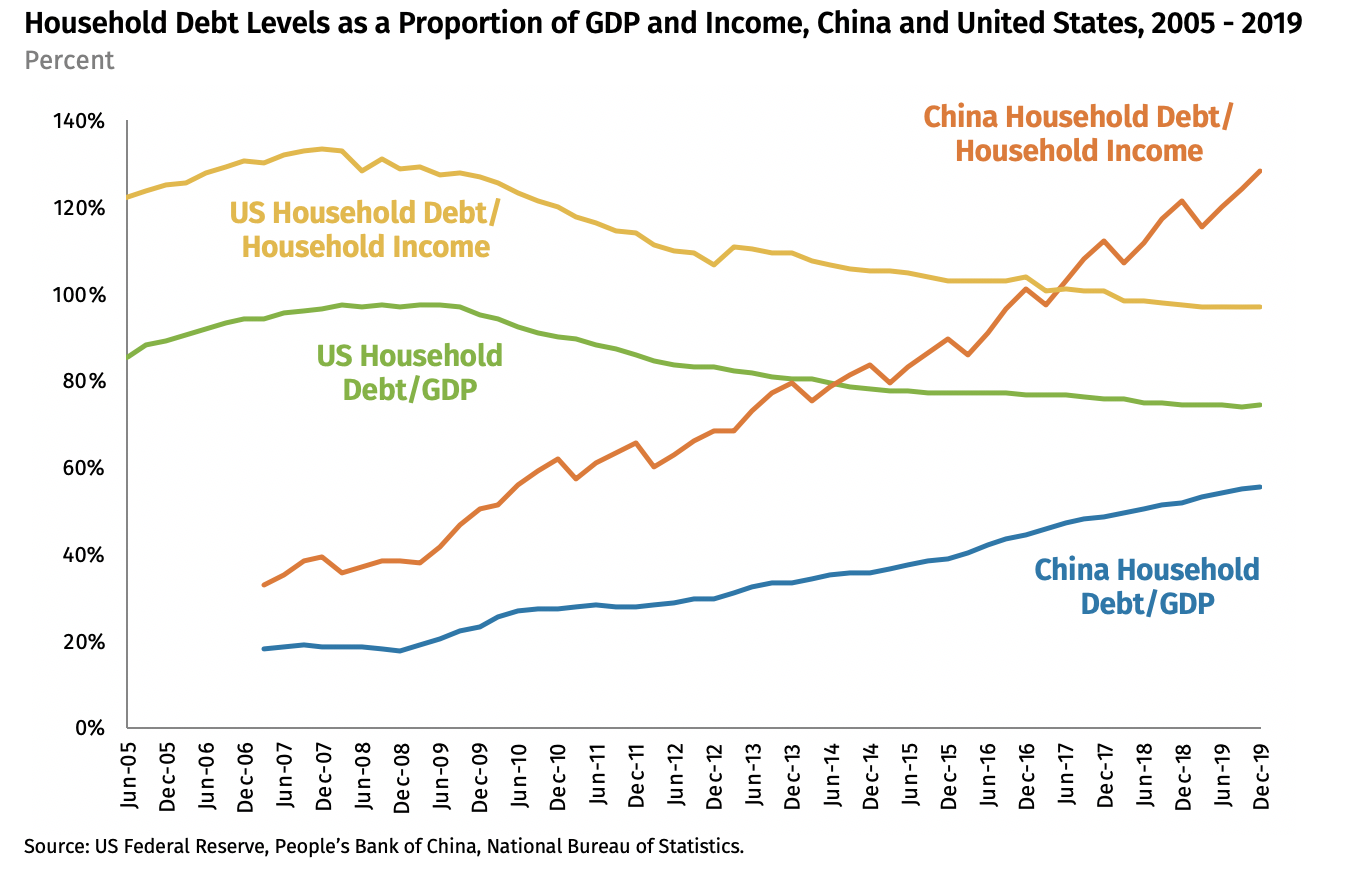
There is no magical threshold of danger in household debt to income ratios: those in other developed economies are higher and likely sustainable. But as the second-largest economy in the world, the absolute levels of debt incurred in China are already quite large. Throughout the past decade, China’s households have outpaced their American counterparts in adding new incremental borrowing in absolute US dollar terms every year since 2009.
How did we get here?
How and why did China’s household debt rise so quickly? We would argue that four factors were involved, which are critical to understand how household debt growth might change in the future.
First, because of slowing economic growth in 2014 and 2015, China’s leaders directly and indirectly encouraged household borrowing. The sharp slowdown in China’s property sector and the deflationary forces gripping China’s industrial sector in 2014 and 2015 left the government with few options. More credit flowing to zombie enterprises was producing surpluses of raw materials and manufacturing goods, and deepening deflationary pressure, while demand was weak. The 2015 stock market boom and bust, and the corresponding capital outflow following the exchange rate adjustment in August 2015 forced policy-makers to look around for new drivers of growth. Consumer credit was seen as facilitating the rebalancing of the economy at the time by accelerating consumption, and Chinese authorities encouraged consumer borrowing.
Second, the still-buoyant property market facilitated and then required a rapid expansion in household borrowing. Most of China’s expansion in household debt in recent years has been mortgage debt, which the PBOC places at 30.1 trillion yuan ($4.3 trillion) as of the end of 2019, up from 11.5 trillion yuan at the end of 2014. As official mortgage debt has almost tripled in five years, property prices have also risen, and households have needed to borrow more to participate in the market. Without strong investment-driven demand for property, it is unlikely that China’s household debt would have grown so quickly. But the rise in property prices also requires additional borrowing by households to sustain the market. Even the average purchase of a house at the average price nationally currently requires annual mortgage service costs higher than urban per capita annual income at present (See Apr 2, “Property Developers’ Dollar Bonds: Dancing in a Minefield”).
Third, the deleveraging campaign launched in late 2016 redirected banks’ incentives to lend to households rather than corporates. The deleveraging campaign first saw banks’ funding costs in China’s money markets rise, and then saw regulatory crackdowns on shadow financing instruments that had previously delivered higher returns. Regulators pressured banks to migrate assets back to formal balance sheets, which reduced banks’ net interest margins. The net result of this was to encourage banks to add lending to households, since mortgage interest rates were higher than corporate lending rates, particularly on loans to state-owned enterprises and local government financing vehicles. As a result, lending to households actually outpaced lending to corporates during the most intense six quarters of the deleveraging campaign (Q3 2017 to Q4 2018).
Fourth, online payment platforms and new financial technologies created new mechanisms for households to engage with the financial system and borrow, from both banks and non-bank intermediaries. Some of the debt incurred by households via peer-to-peer lenders or online payment platforms is not included in the totals above, which reflect official totals from the banking system. But the availability of financial services on mobile platforms also helped consumers to service their debt burdens by borrowing for bridge payments. The growth of financial technologies has helped to normalize consumer credit for Chinese citizens and has helped to facilitate other forms of borrowing, such as credit card debt.
The Virus and the Outlook for Household Debt
The COVID-19 outbreak and corresponding economic shutdowns now pose new risks to the stability of China’s household debt, and thus the broader economic recovery. While state-owned enterprises were capable of returning to work quickly in March after the February shutdowns, many migrant workers and employees in the private sector and the services sector have been much slower to return, costing them incomes (See Apr 6, “China Industrial Recovery Chartbook”). Employment prospects are weakening at present in the construction sector and export-oriented manufacturing as the property sector and global demand sputter, while services sector activity has yet to return to normal levels. Activity levels are increasing gradually, but remain below typical patterns in production and capacity utilization.
Low-wage industries are among those most likely to be affected by virus-related closures. This increases the risk of defaults on consumer credit, because lower-income borrowers are more likely to be impacted by the recent shutdowns. Even if the overall household debt burden appears sustainable in a macro sense, the distributional impact of household debt on lower-income borrowers may drive additional risks as the economy slows. Particularly at risk from this potential hit to household incomes is short-term credit card debt. China’s credit card debt now totals 7.59 trillion yuan at the end of 2019, or $1.09 trillion, compared to $927 billion in the United States at the end of last year. Credit card borrowing in China has risen by 87% since the end of 2016, and credit lines available now total 17.4 trillion yuan ($2.5 trillion). Even though household lending growth has slowed, it continues to outpace corporate lending growth.
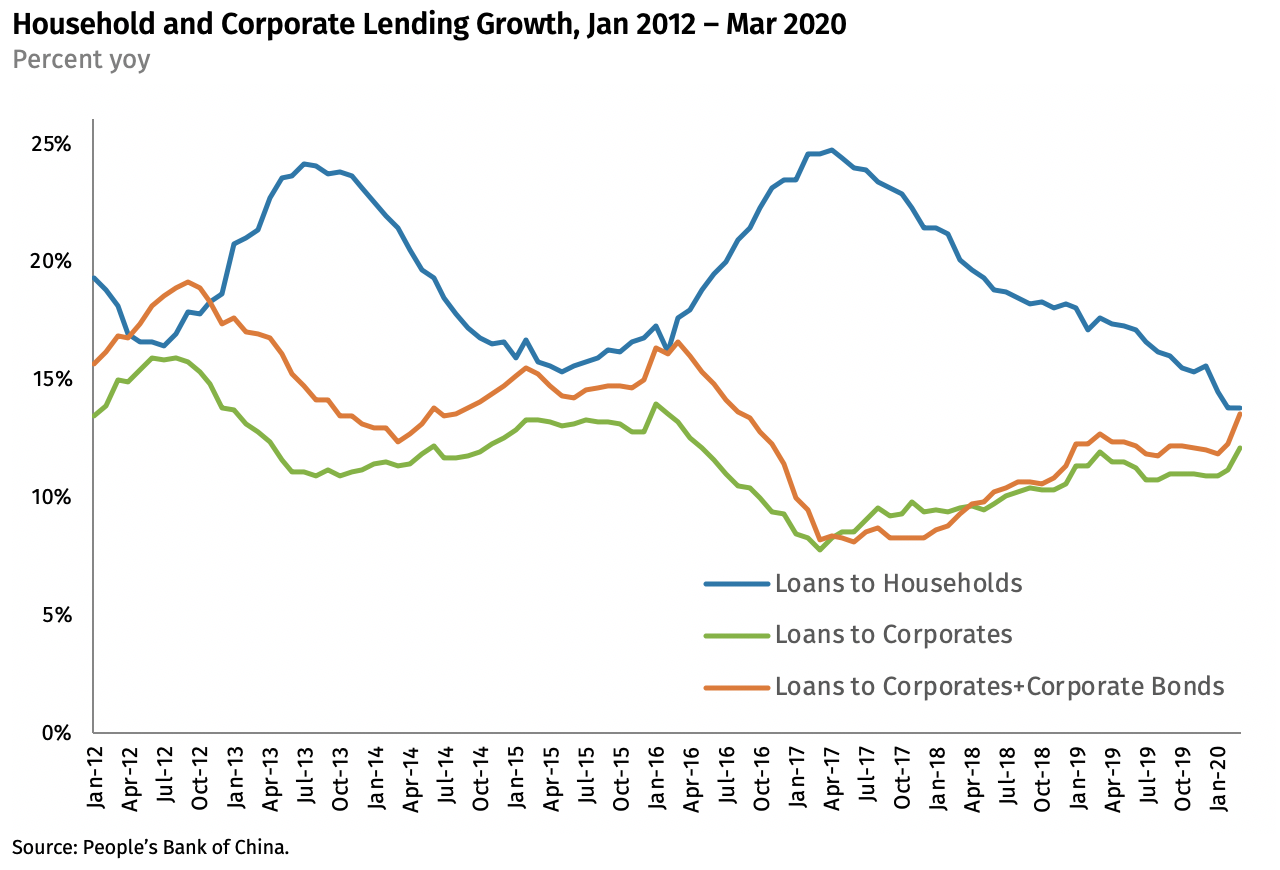
While China’s household debt burden is currently slowing discretionary spending, household consumption continues rising gradually as a proportion of China’s economy. Should the virus-related shutdowns weaken household incomes and employment, the impact on consumption may dwarf any pickup in investment-led growth from more traditional stimulus measures. This is what makes the prospect of defaults on household debt so dangerous for the overall growth outlook, by magnifying the ongoing slowdown in household consumption.
Exposure by regions and banks
Our research also delved into which Chinese regions and banks are most exposed to the rise in household debt. It showed that most household debt is concentrated in eastern and southeastern coastal provinces, where property prices are higher. This includes the four so-called “tier one” property markets – Beijing, Shanghai, Guangzhou and Shenzhen.
As for the banks, we expect those with heavy exposure to retail borrowing, especially credit card loans, to see more delinquencies. Forbearance measures by regulators may help banks postpone recognition and provisioning for non-performing loans, but these assets will remain on their balance sheets, amplifying capital pressure on China’s commercial banks. We expect that most of the impact of the virus outbreak on banks’ asset quality will not emerge until the Q2 or Q3 interim reports.
FULL DOCUMENT: https://rhg.com/research/china-household-debt/
________________
LGCJ.: