US ECONOMICS
VENEZUELA
THE WHITE HOUSE. March 27, 2019. First Lady of Venezuela visits the White House
Venezuelan Interim President Juan Guaido is a tremendous leader working hard to free his country from the grips of a socialist dictatorship. Today, President Donald J. Trump welcomed his wife, Interim First Lady Fabiana Rosales, to the White House.
Venezuela’s story is unfathomable. Once the wealthiest country in South America, years of massive wealth confiscation, suppressed free speech, and rigged elections have brought the country to the brink of ruin. Today, nearly 90 percent of Venezuelans live in poverty. In 2018, hyperinflation in Venezuela exceeded a staggering 1 million percent.
“Everything's broken,” President Trump said today of the Maduro regime’s destruction. “They have no water . . . The lights are out.”
First Lady Rosales thanked the United States today for its leadership on the world stage. In January, Venezuela’s National Assembly invoked its constitutional right to declare Guaido, President of the Assembly, as the country’s legitimate leader. Within 30 minutes, America was the first nation in the world to officially recognize President Guaido.
“To see [President Guaido] and his courageous wife stand before the crowds and take that oath of office under the constitution of Venezuela was inspiring not just to people across our hemisphere and across this country, but all over the world,” Vice President Mike Pence said before today’s bilateral meeting between U.S. and Venezuelan officials. In the days that followed that oath, the Maduro regime unleashed untold horror—blocking humanitarian aid, killing innocent civilians, and burning medical supplies.
“Eighty percent of the population in Venezuela has no power. They are trying to break our morale,” Ms. Rosales said today. “They want to submerge us in eternal darkness. But let me tell you that there is light, and the light is here.”
America and the rest of the world are watching closely. The Venezuelan people do not stand alone.
President Trump Participates in a Bilateral Meeting with the First Lady of the Bolivarian Republic of Venezuela: https://www.youtube.com/watch?v=Z_tQujbGWiQ
VENEZUELA. RÚSSIA. REUTERS. 28 DE MARÇO DE 2019. Rússia afirma que enviou "especialistas" para a Venezuela
Por Tom Balmforth e Maxim Rodionov
MOSCOU (Reuters) - A Rússia afirmou nesta quinta-feira que enviou “especialistas” para a Venezuela sob um acordo militar de cooperação, mas disse que eles não oferecem ameaça à estabilidade regional, em resposta a um pedido do presidente dos Estados Unidos, Donald Trump, pela completa retirada de militares russos do país sul-americano.
Trump disse na quarta-feira que “todas as opções” estavam sobre a mesa para que a retirada acontecesse, após dois aviões da Força Aérea russa pousaram no aeroporto internacional de Caracas no sábado levando cerca de 100 militares, segundo informado pela mídia.
Na recente crise política venezuelana, a Rússia apoiou o presidente Nicolás Maduro, ao passo que os Estados Unidos apoiam o líder da oposição, Juan Guaidó, além de terem imposto sanções.
Um adido militar venezuelano em Moscou disse nesta quinta-feira que foram enviados “integrantes das Forças Armadas russas” para a Venezuela, mas que eles não vão participar de operações militares, segundo a agência de notícias Interfax.
“A presença de militares russos na Venezuela está relacionada à discussão de cooperação no campo técnico-militar”, disse o adido militar José Rafael Torrealba Pérez, de acordo com a Interfax.
Em entrevista coletiva mensal, a porta-voz do Ministério das Relações Exteriores russo, Maria Zakharova, descreveu os enviados como apenas “especialistas russos”.
“A Rússia não está mudando as relações de poder na região, a Rússia não está ameaçando ninguém, diferentemente de cidadãos (autoridades) em Washington”, disse.
“Especialistas russos desembarcaram na Venezuela em linha com o previsto por um acordo bilateral intergovernamental sobre cooperação técnico-militar. Ninguém cancelou esse documento”, acrescentou.
Em janeiro, Guaidó evocou a Constituição para assumir uma Presidência interina da Venezuela, apontando que a reeleição de Maduro, em 2018, foi ilegítima.
Maduro, que detém o controle das funções estatais e das forças militares do país, afirma que Guaidó é uma marionete dos EUA.
GDP
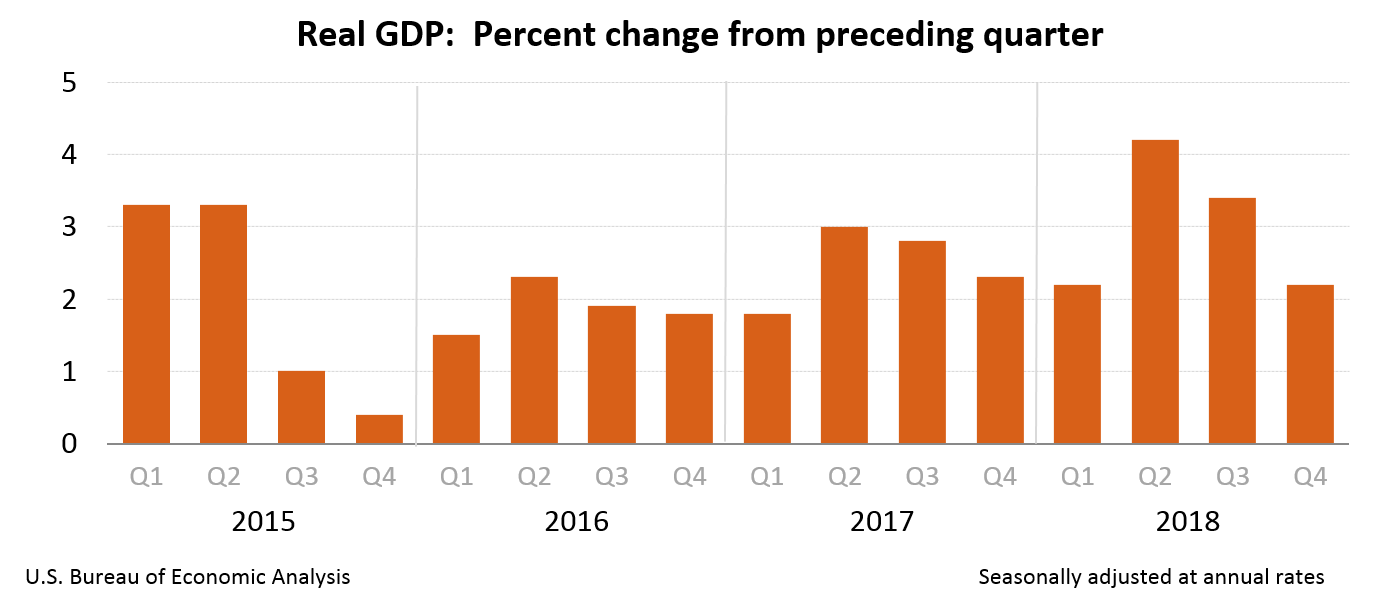
DoC. BEA. March 28, 2019. Gross Domestic Product, 4th quarter and annual 2018 (third estimate); Corporate Profits, 4th quarter and annual 2018
Real gross domestic product (GDP) increased at an annual rate of 2.2 percent in the fourth quarter of 2018 (table 1), according to the "third" estimate released by the Bureau of Economic Analysis. In the third quarter, real GDP increased 3.4 percent.
The GDP estimate released today is based on more complete source data than were available for the "initial" estimate issued last month. In the initial estimate, the increase in real GDP was 2.6 percent. With this estimate for the fourth quarter, the general picture of economic growth remains the same; personal consumption expenditures (PCE), state and local government spending, and nonresidential fixed investment were revised down; imports, which are a subtraction in the calculation of GDP, were also revised down (see "Updates to GDP" on page 2).
Real gross domestic income (GDI) increased 1.7 percent in the fourth quarter, compared with an increase of 4.6 percent in the third quarter. The average of real GDP and real GDI, a supplemental measure of U.S. economic activity that equally weights GDP and GDI, increased 1.9 percent in the fourth quarter, compared with an increase of 4.0 percent in the third quarter (table 1).
The increase in real GDP in the fourth quarter reflected positive contributions from personal consumption expenditures (PCE), nonresidential fixed investment, exports, private inventory investment, and federal government spending. Those were partly offset by negative contributions from residential fixed investment and state and local government spending. Imports, which are a subtraction in the calculation of GDP, increased (table 2).
The deceleration in real GDP growth in the fourth quarter reflected decelerations in private inventory investment, PCE, and federal government spending and a downturn in state and local government spending. These movements were partly offset by an upturn in exports and an acceleration in nonresidential fixed investment. Imports increased less in the fourth quarter than in the third quarter.
Current dollar GDP increased 4.1 percent, or $206.9 billion, in the fourth quarter to a level of $20.87 trillion. In the third quarter, current-dollar GDP increased 4.9 percent, or $246.3 billion (table 1 and table 3).
The price index for gross domestic purchases increased 1.7 percent in the fourth quarter, compared with an increase of 1.8 percent in the third quarter (table 4). The PCE price index increased 1.5 percent, compared with an increase of 1.6 percent. Excluding food and energy prices, the PCE price index increased 1.8 percent, compared with an increase of 1.6 percent.
Updates to GDP
The fourth-quarter change in real GDP was revised down 0.4 percentage point, reflecting downward revisions to PCE, state and local govermment spending, and nonresidential fixed investment that were partly offset by a downward revision to imports. For more information, see the Technical Note. A detailed "Key Source Data and Assumptions" file is also posted for each release. For information on updates to GDP, see the "Additional Information" section that follows.
| Initial Estimate | Third Estimate | |
|---|---|---|
| (Percent change from preceding quarter) | ||
| Real GDP | 2.6 | 2.2 |
| Current-dollar GDP | 4.6 | 4.1 |
| Real GDI | … | 1.7 |
| Average of Real GDP and Real GDI | … | 1.9 |
| Gross domestic purchases price index | 1.6 | 1.7 |
| PCE price index | 1.5 | 1.5 |
2018 GDP
Real GDP increased 2.9 percent in 2018 (from the 2017 annual level to the 2018 annual level), compared with an increase of 2.2 percent in 2017 (table 1).
The increase in real GDP in 2018 primarily reflected positive contributions from PCE, nonresidential fixed investment, exports, federal government spending, private inventory investment, and state and local government spending that were slightly offset by a small negative contribution from residential fixed investment. Imports, which are a subtraction in the calculation of GDP, increased (table 2).
The acceleration in real GDP from 2017 to 2018 primarily reflected accelerations in nonresidential fixed investment, private inventory investment, federal government spending, exports, and PCE, and an upturn in state and local government spending that were partly offset by a downturn in residential investment.
Current-dollar GDP increased 5.2 percent, or $1.01 trillion, in 2018 to a level of $20.49 trillion, compared with an increase of 4.2 percent, or $778.2 billion, in 2017 (table 1 and table 3).
Real GDI increased 2.4 percent in 2018, compared with an increase of 2.3 percent in 2017 (table 1).
The price index for gross domestic purchases increased 2.2 percent in 2018, compared with an increase of 1.9 percent in 2017 (table 4). The PCE price index increased 2.0 percent, compared with an increase of 1.8 percent. Excluding food and energy prices, the PCE price index increased 1.9 percent, compared with an increase of 1.6 percent (table 4).
Measured from the fourth quarter of 2017 to the fourth quarter of 2018, real GDP increased 3.0 percent during the period. That compared with an increase of 2.5 percent during 2017. The price index for gross domestic purchases increased 2.1 percent during 2018, compared with an increase of 1.9 percent. Real GDI increased 2.7 percent during 2018, compared with an increase of 2.3 percent (table 6).
Corporate Profits (table 10)
Profits from current production (corporate profits with inventory valuation and capital consumption adjustments) decreased $9.7 billion in the fourth quarter, in contrast to an increase of $78.2 billion in the third quarter.
Profits of domestic financial corporations decreased $25.2 billion in the fourth quarter, compared with a decrease of $6.1 billion in the third quarter. Profits of domestic nonfinancial corporations increased $13.6 billion, compared with an increase of $83.0 billion. Rest-of-the-world profits increased $1.9 billion, compared with an increase of $1.3 billion. In the fourth quarter, receipts increased $8.8 billion, and payments increased $6.9 billion.
FULL DOCUMENT: https://www.bea.gov/system/files/2019-03/gdp4q18_3rd_0.pdf
ECONOMY
FED. March 28, 2019. Speech. Global Shocks and the U.S. Economy. Vice Chair Richard H. Clarida. At the "The Euro Area: Staying the Course through Uncertainties" BDF Symposium and 34th SUERF Colloquium sponsored by Banque de France and the European Money and Finance Forum, Paris, France
Good afternoon. It is a pleasure to be here at the Banque de France and take part in this important symposium on the "Euro Area: Staying the Course through Uncertainties."1
Both in the financial press and in international policy circles, one hears a great deal about the spillovers of U.S. monetary policy to other economies. One hears somewhat less, though, about how global shocks affect the U.S. economy.2 So, in my remarks today, I will discuss how the U.S. economy's increasing integration with the rest of the world has made it more exposed to foreign shocks, and I will focus in particular on the channels of transmission through which these shocks operate. I will close with a few words on current prospects, in which global crosscurrents are again posing challenges for the U.S. economy and monetary policy.
Greater Integration between the United States and the Rest of the World
The U.S. economy's integration with the rest of the world, both in terms of trade and finance, has risen substantially over the past 60 years. Since the 1960s, both U.S. exports and imports have about tripled as a share of gross domestic product (GDP), with their sum now about 30 percent of GDP--still relatively small by international standards, but certainly notable.
Financial linkages have grown enormously as well. The United States has had open capital markets for a long time, but the sum of U.S. external assets and liabilities has grown from about 25 percent of GDP in 1960 to more than 300 percent today. And, reflecting the greater integration of global financial markets, the correlation of U.S. and foreign equity and bond markets has trended broadly upward for several decades.3
Channels of Transmission of Global Shocks to the U.S. Economy
This increased integration I have described has heightened the exposure of the U.S. economy to external shocks. But what are the channels of transmission of these shocks to the United States?
For concreteness, let us consider the case of a negative demand shock originating abroad, such as a foreign recession. First, this shock affects the United States through direct trade links, lowering demand for U.S. exports and, thus, lowering U.S. GDP.
Second, the foreign recession leads to lower interest rates abroad and, other things being equal, raises the value of the dollar, which in turn lowers U.S. exports and boosts U.S. imports. The dollar appreciation also puts downward pressure on U.S. import prices and, thereby, inflation. The extent to which foreign worries lead to safe-haven flows may add to the dollar's strength.
Finally, there is contagion to U.S financial markets. Let me first elaborate on the exchange rate channel I just mentioned. The traditional determinants of exchange rates--that is, differentials in expected rates of return--apply to the United States as to other countries. But the U.S. economy is different because of the special role of U.S. government bonds as global safe assets. As a consequence, an adverse foreign shock that damped the demand for risky assets would be expected to trigger safe-haven flows that boost the dollar, weighing on the U.S. economy.4 The spillover of risk aversion to U.S. markets might well also push down equity prices and widen corporate credit spreads, adding to the contractionary pressures. However, the same safe-haven flows into Treasury securities would cause U.S. long-term yields to fall, mitigating these adverse effects on domestic demand and activity.5
Historical Experience
Let us consider some historical examples of the effect of adverse foreign shocks on the U.S. economy. The Mexican peso crisis of 1994 and '95 and the Asian financial crisis of 1997 through '98 resulted in substantial hits to aggregate emerging market economy (EME) growth, but they had fairly muted effects on U.S. growth.6 In part, this limited response in previous decades reflected the smaller share of the EMEs in the global economy and, as a related matter, in U.S. trade. Furthermore, the weight of EMEs in the global financial system was lighter in previous decades, so their crises were less disruptive to global markets.7 Finally, even back then, the safe-haven flows into dollar assets that I highlighted earlier were an important mitigating factor, pushing down U.S. long-term yields. To be sure, the Russian default of August 1998, followed by the collapse of Long-Term Capital Management, had more-substantial effects on global markets and posed greater risk to the U.S. economy, which triggered a policy response by the Fed in which the federal funds rate was cut 75 basis points between September and November of that year.8 Of note, after economic prospects appeared to stabilize, the Fed reversed those cuts in 1999.
In recent times, global shocks have also been consequential for U.S. economic prospects and monetary policy. Examples include the 2011-13 euro-zone recession and the China devaluation and capital flight episode of 2015 and '16, when worries about a hard landing and renminbi depreciation, respectively, roiled world markets. Both of these shocks originated in economies with large footprints in the global economy and financial system, and, as a result, they induced substantial disruptions in global financial markets. During both episodes, U.S. stock markets fell and the dollar appreciated, especially during 2015 and 2016. As ever, these negative shocks were associated with safe-haven flows that pushed U.S. Treasury yields down.9 Despite the drop in yields, overall financial conditions in the United States tightened, weighing on aggregate demand.10
Yet, in these episodes, accommodative policy responses in the United States helped ward off actual contractions of U.S. activity. During the 2011-13 euro-zone recession, the United States was already pursuing very accommodative policies in the wake of the Global Financial Crisis, but the timing of the maturity extension program and the third phase of U.S. quantitative easing suggests they were helpful responses to the spillovers to the United States from this downturn.11 For the China episode of 2015 and '16, Federal Open Market Committee (FOMC) statements from the time indicate that concerns about foreign developments and their effect on U.S. financial conditions were a factor contributing to the delay in previously anticipated policy rate increases, thereby supporting the economy.
The message from these recent episodes is not just about the importance of timely policy adjustments by the central bank. It is also about the importance of the enhanced resilience of financial institutions that has been achieved since the Global Financial Crisis. Undoubtedly, this resilience helped prevent adverse financial shocks from contributing to a more serious downturn.
Recent Developments
Let me conclude with some remarks on recent developments. U.S. and other financial markets are attuned to a number of prominent downside global risks, which include Brexit, a sharp slowdown in global growth prospects, and trade tensions.
Even though the Fed has been and is committed to a dual mandate to achieve maximum employment and price stability, in today's world, U.S. policymakers can hardly ignore these risks, and three of our most recent FOMC statements have highlighted concerns about global economic and financial developments. In addition, in our policy statements, as well as in other communications, we have indicated that, in the presence of these risks and with inflation pressures muted, we can afford to be patient and data dependent as we assess in future meetings what adjustments in our policy rate might be necessary to sustain growth, employment, and price stability in the U.S. economy.
References
- Board of Governors of the Federal Reserve System (2018). "The Recent Rise in Oil Prices (PDF)," Monetary Policy Report. Washington: Board of Governors, July 13.
- Bodenstein, Martin, Christopher J. Erceg, and Luca Guerrieri (2009). "The Effects of Foreign Shocks When Interest Rates Are at Zero (PDF)," International Finance Discussion Papers 983. Washington: Board of Governors of the Federal Reserve System, October.
- Clarida, Richard H. (2012). "The Euro Crisis and the U.S. Economy," interview by Christopher Alessi, Council on Foreign Relations, Washington, D.C., May 25.
- Dell'Ariccia, Giovanni, Jeronimo Zettelmeyer, and Isabel Schnabel (2002). "Moral Hazard and International Crisis Lending: A Test," IMF Working Paper WP/02/181. Washington: International Monetary Fund, October.
- Duca, John V., David M. Gould, and Lori L. Taylor (1998). "What Does the Asian Crisis Mean for the U.S. Economy? (PDF)" Federal Reserve Bank of Dallas, Southwest Economy, March/April, pp. 1-7.
- Economist (2015). "The Causes and Consequences of China's Market Crash," Market Turmoil, Economist, April 24.
- Ferrara, Laurent, and Charles-Emmanuel Teuf (2018). "International Environment and U.S. Monetary Policy: A Textual Analysis," Banque de France, Eco Notepad, September 25.
- Harrigan, James (2000). "The Impact of the Asian Crisis on U.S. Industry: An Almost-Free Lunch? (PDF)" Federal Reserve Bank of New York, FRBNY Economic Policy Review, vol. 6 (September), pp. 71-81.
- Kilian, Lutz (2008). "The Economic Effects of Energy Price Shocks," Journal of Economic Literature, vol. 46 (December), pp. 871-909.
- Kilian, Lutz, and Robert J. Vigfusson (2017). "The Role of Oil Price Shocks in Causing U.S. Recessions," Journal of Money, Credit and Banking, vol. 49 (December), pp. 1747‑76.
- Kohn, Donald L. (2008). "Global Economic Integration and Decoupling," speech delivered at the International Research Forum on Monetary Policy, Frankfurt, Germany, June 26.
- Pollard, Patricia S., and Cletus C. Coughlin (1999). "Going Down: The Asian Crisis and U.S. Exports (PDF)," Federal Reserve Bank of St. Louis, Review, vol. 81 (March/April).
- van Wincoop, Eric, and Kei-Mu Yi (2000). "Asian Crisis Postmortem: Where Did the Money Go and Did the United States Benefit? (PDF)" Federal Reserve Bank of New York, FRBNY Economic Policy Review, vol. 6 (September).
- The views expressed are my own and not necessarily those of other Federal Reserve Board members or Federal Open Market Committee participants. I am grateful to Shaghil Ahmed of the Federal Reserve Board staff for his assistance in preparing this text.
- A recent exception is Ferrara and Teuf (2018), who construct an international environment indicator, based on a textual analysis of Federal Open Market Committee minutes, and examine the connection between this indicator and U.S. monetary policy.
- Among others, Kohn (2008) documents the increase in recent decades of U.S. trade links with the rest of the world, including through internationally integrated production as well as the increased financial linkages of the United States with the rest of the world.
- Other countries that are also recipients of safe-haven flows include Japan and Switzerland.
- An additional channel I have abstracted from here is that of commodity prices, which often move significantly in response to foreign factors. Since the United States is both a large exporter of some commodities and a large importer of some other commodities, the overall implications for U.S. activity are likely to be mixed. In particular, the effects of oil prices on the U.S. economy have been quite extensively studied. For example, Kilian (2008) and Kilian and Vigfusson (2017) present evidence on how increases in oil prices have historically adversely affected U.S. economic performance, as the United States is a net importer of oil. More recently, as outlined in Board of Governors (2018, pp. 16-17), with the net oil import share trending lower in the United States, the drag on U.S. GDP from higher oil prices has likely declined.
- Most studies discussing contagion effects of the Mexican peso crisis focus on effects on other Latin American countries and do not highlight effects on U.S. growth. Studies on the effects of the Asian financial crisis on U.S. activity generally find from modest adverse to even slightly positive effects (see, for example, Duca, Gould, and Taylor, 1998; Harrigan, 2000; and van Wincoop and Yi, 2000). Duca, Gould, and Taylor (1998) called the effect on the United States "more of a swell rather than a tsunami" (p. 1). One study, Pollard and Coughlin (1999), found significant negative effects of the Asian crisis on U.S. exports in certain industries, but it also concluded that this effect did not translate into much of an effect on industry outputs.
- Support provided by the official international financial community also helped mute global market disruptions during these EME crises.
- Dell'Ariccia, Zettelmeyer, and Schnabel (2002) argue that the more-substantial response of global financial markets to the Russian default was because investors were expecting Russia to be rescued from having to default by the International Monetary Fund, and there was a global retreat from risk when that did not happen.
- Media commentary from 2015 and 2016 is replete with descriptions of the rout in global financial markets resulting from financial turbulence in China. See, for example, Economist (2015).
- In May 2012, I gave an interview at the Council on Foreign Relations highlighting the potential risks to the fragile U.S. economic recovery posed by the euro-zone sovereign debt crisis; see Clarida (2012).
- The quantitative easing was important, because the United States had already reduced the policy rate to zero and--as argued, for example, in Bodenstein, Erceg, and Guerrieri (2009)--the spillover effects of adverse foreign demand shocks to the U.S. economy are significantly amplified at the zero lower bound for the policy rate in the absence of other expansionary policies.
FINANCIAL SECTOR
FED. March 28, 2019. Speech. The Financial Stability Board in 2019. Vice Chair for Supervision and Chair of the Financial Stability Board Randal K. Quarles. At the Joint Conference of the European Central Bank and the Journal of Money, Credit, and Banking, Frankfurt, Germany
It is a pleasure to be here today at the European Central Bank in my capacity as chair of the Financial Stability Board (FSB) to help celebrate the Journal of Money, Credit and Banking's (JMCB) 50th anniversary. The broad scope of the JMCB, and the diversity of its scholarship parallels, in some ways, the FSB itself. As we dealt with the global financial crisis, the heads of state and government of the G20 tasked the FSB with identifying and addressing vulnerabilities in the global financial system and developing stronger regulatory and supervisory policies to create a more resilient global financial system in the pursuit of financial stability. Our broad mandate has considerable overlap with the fields that the JMCB covers within its pages. The FSB includes 24 jurisdictions and 73 representatives, including all the members of the G20. Also similar to the JMCB, the FSB is celebrating an anniversary this year, with its creation having occurred 10 years ago. We are a far cry from the JMCB's 50 years, but I hope that in time our continuing work--and not just our response to the late crisis--will prove valuable enough that we one day merit a similar celebration.
I am especially pleased to speak at this conference today because the FSB welcomes and encourages the participation of the academic community in tackling issues of global financial stability. I would like to see a greater and more direct contribution of academic subject-matter experts to our work. You may have noticed that the FSB sent out a call for nominations last month for academics to advise our work in evaluating post-crisis reforms--in this particular instance, the evaluation that will examine the effects of the too-big-to-fail reform package that the G20 endorsed in 2010 and that the FSB and other standard setters have implemented since then. In our initiatives to examine the consequences of post-crisis reform, the academic community can help advance the field with analytical tools and critical insight.
The financial crisis exposed fault lines in the financial system that had to be addressed immediately, comprehensively, and vigorously. The body of post-crisis regulation that resulted was founded on the work of academics, including important papers published in the JMCB, and involved the energy and efforts of many standard setters, regulators, supervisors, and central banks. It was an exemplary feat of cooperation and coordination, and it has unquestionably made the financial system safer and more resilient.
Today, the post-crisis reform agenda has been largely completed. Basel III is final, the largest global banks have substantially more capital and liquidity, over-the-counter derivatives markets are safer, and steps have been taken to address the risks of too-big-to-fail institutions. Through greater monitoring and policy measures, the FSB is addressing risks from nonbank financial intermediation. And there has been remarkable progress on the difficult and unglamorous task of establishing workable resolution regimes that are consistent with the FSB's clearly defined principles. While we must still work to ensure full, timely, and consistent implementation of the agreed reforms, it is time for the FSB to turn more of its energy and attention to the future.
In my time with you today, I would like to do two things. First, I would like to share with you my view on how the work of the FSB must evolve if we are to merit that future celebration and some of the core principles that I think should inform that work. After discussing those principles, I want to focus your attention on some of the work priorities that the FSB will be addressing throughout 2019 and beyond, including nonbank financing, fintech, and evaluating the too-big-to-fail reforms.
Core Principles
Let me turn to the core principles--engagement, rigor, and analysis. These core principles reflect goals that are both inward and outward looking. From within, FSB members have the occasion to reflect on how our work is executed--that is, we must ask ourselves how we can accomplish our mission more effectively, improving the financial sector's ability to support economic growth without threatening financial stability. Outwardly, we will endeavor to reach out to a greater number of constituents and stakeholders for their input on the important financial stability issues they are encountering. This is also a good time to inform a wider public audience on the nature of our mission in a clear, articulate, and jargon-free manner.
Engagement
As the FSB pivots away from the urgency of post-crisis reform development, it is an opportune time to improve our efforts at effective engagement. Recognizing the wide-reaching effects of its work, the FSB must seek input from a broad range of stakeholders, each of whom brings a different perspective to the issues under consideration. While we are directly accountable to the G20, we are, through the G20, accountable to all of the people affected by our actions. In my view, that means we must engage in genuine, substantial dialogue with all of these stakeholders, to a greater and more effective degree than we have in the past.
To start, we can strengthen the role of the six regional groups that are a part of the FSB organization. In 2011, the FSB established six consultative groups representing large regions of the globe--the Americas, Europe, the Middle East and North Africa, Sub-Saharan Africa, the Commonwealth of Independent States, and Asia. The intent was to expand its outreach program beyond the membership in a systematic manner to better reflect the FSB's global mission. Each group meets once or twice a year and helps the FSB obtain broader input into its policy development agenda. These groups should be re-engineered to not only promote implementation of international policy initiatives within their respective regions, but also to be in a strong position to keep abreast of developments in financial markets and thus inform FSB policy. We have initiated a study of the operations of the regional groups that will help inform us on ways to upgrade their effectiveness as an outreach and feedback mechanism. I am particularly interested in how we can take lessons learned from this study to move forward with our enhanced engagement.
Engagement outside of the FSB is also very important to our mission. We currently engage with businesses, institutions, market participants, and academics on much of our FSB work. For example, we have in the past conducted public consultations on FSB policy recommendations, albeit sometimes with very short timetables. We have now established an expectation that public consultation will be at least 60 days. We need to give the public adequate time to comment on FSB proposals, which can, at times, be quite complex.
Beyond public consultation, we must convene more meetings with the private sector and academic community to build a more robust and meaningful dialogue. For example, we kicked off the work we have undertaken at the behest of the Japanese G20 Presidency to study differences in regulatory environments and market conditions across jurisdictions that may have financial stability implications--often referred to as "market fragmentation"--by hosting a workshop with key stakeholders and academics. This was quite successful, and I look forward to such interactions being the rule. In addition, we need to improve our interaction and cooperation with other standard-setting bodies, such as the Basel Committee, the Committee on Payments and Market Infrastructure, the International Association of Insurance Supervisors, and the International Organization of Securities Commissions (IOSCO). While we have worked together in the past, we all owe it to the global community to seek out opportunities for improved cooperation and engagement.
To improve FSB transparency, we will be taking a number of important steps. For example, on February 12, 2019, the FSB published a comprehensive work program on its website for the year ahead.1 This is the first time in the FSB's history that the work program was disseminated publicly. Over the term of my chairmanship, I will continue to look for steps that will allow all stakeholders to have a more open window into the FSB's decisionmaking process and products. I believe improved transparency into the FSB process is critical to our mission. I'm reminded of Lord Hewart's famous--and oft-quoted--remark concerning the importance of jurisprudence to the public: "Not only must justice be done; it must also be seen to be done." We should be able to apply this concept to the field of global financial standard setting.
Rigorous Vigilance
The second principle I would like to discuss concerns how we assess and mitigate vulnerabilities in the global financial system. The post-crisis reforms addressed the fault lines that led to the crisis and the contagion effects felt around the world, but they will never replace the need for vigilance. If we are not rigorously vigilant, we still risk another crisis. What we need are forward-looking methodologies that use the most advanced analytical tools to spot vulnerabilities well in advance before they lead to widespread financial distress and economic costs. Here the academic community can continue to contribute with cutting-edge and robust modeling techniques.
We can only mitigate financial vulnerabilities if we identify them accurately and in a timely manner. As such, the FSB's Standing Committee on Assessment of Vulnerabilities under the leadership of FSB Vice Chair Klaas Knot of the Dutch National Bank will be directing a considerable amount of energy to developing a cutting-edge framework for the identification and assessment of financial vulnerabilities. Again, the principles of transparency and engagement will shape the work of the group. It is important that a wide spectrum of financial participants be brought into the process, from banks and nonbank financial institutions to financial regulators to national authorities and multilateral standard-setting bodies and the broad academic community. This task is essential to the mission of the FSB; financial developments move at a rapid pace, and being able to quickly and accurately assess vulnerabilities is essential if we are to take action to prevent future crises.
Analysis
Finally, the FSB members must employ a critical eye toward the effects of the regulations that have been put in place. Many of the reforms have been in place long enough for them to be evaluated. We can judge whether reforms are having their intended effects and making the financial system more resilient. Are any regulatory reforms causing unintended, adverse effects? Can we achieve the same, strong level of financial resilience with reforms that are more efficient, simple, transparent, and tailored? The FSB must champion efficient and effective regulation in order to maintain public support for the progress we have made.
Key Pieces of the FSB's Work Plan
Now I would like to turn to three prominent issues on the FSB's agenda in 2019. I will start with two relatively new issues that continue to evolve and grow in sophistication: nonbank financing and fintech, and then I will turn to the important work we are beginning on evaluating the effects of reforms aimed at ending too big to fail.
Fintech
I will loosely define fintech as technology-enabled financial innovation that results in material changes to the provision of financial services. As is often the case when technological innovation meets established business, fintech has attracted a great deal of attention, ranging from utopian claims to hostile skepticism. Claims about fintech's promise abound: it has the power and potential to reduce economic inequality, increase financial inclusion, and boost economic growth. Through the introduction of new methodologies, greater information curation, and reduction in processing costs, fintech could potentially reduce financial volatility and vulnerabilities.
We are already seeing significant changes to how many people around the world obtain financial services. For example, in Kenya, a mobile payments technology has introduced mobile wallets to millions of people, many of whom never had a bank account. In the United States, the largest mortgage provider is an online lender. In China, a technology firm started the world's largest money market fund.
Yet, alongside this growth in fintech, as my predecessor as FSB chair emphasized, we as regulators must ensure that as we maximize the potential benefits in the development of fintech we minimize the potential risks and costs. The FSB monitors and analyzes the financial stability implications of financial innovation as part of our mandate to identify and address vulnerabilities in the global financial system. Let me outline two areas that we have started to examine in greater detail: the potential effects from the entry of large technology firms into financial services and the potential effects from the growth in decentralized financial technologies.
Over the last decade, the world has witnessed an explosion of large technology firms that are weaving themselves into our daily lives: for example, Facebook, Amazon, Apple, Tencent, and Baidu. Some of these firms are increasingly providing some financial services, such as payments, credit, insurance, and asset management. Their involvement can support financial services broadly. For example, their technology may increase speed and efficiency, and the ubiquity of their presence in our lives may allow them to offer financial services in a more convenient way or at lower cost to consumers. Further, as they are only dipping their toes into the edges of the financial services water, the effects they have on the provision of financial services could grow enormously if they were to dive in.
Looking at the technologies that underlie some of the recent innovative financial products, we see a move toward decentralization--that is, a movement toward technologies that connect financial market participants directly without an intermediary. The potential areas of impact are broad: settling interbank payments; verifying and reconciling trade finance invoices; executing, enforcing and verifying the performance of contracts; and keeping an audit trail to deter money laundering.
Both the potential entry of large, established technology companies into financial services and the ability of technology to decentralize financial transactions raise a number of issues, some of which may touch on financial stability. Technological innovation offers the promise of a substantially more efficient financial system. But new systems, processes, and types of businesses will bring with them novel fragilities. We continue to be responsible for ensuring that the financial system be sufficiently resilient that businesses and households worldwide need not fear the collapse of the system that serves their needs.
These are open questions that need to be addressed, and because they touch on issues of financial stability, the FSB is putting significant resources into understanding these potentially important developments. To be clear, we are not trying to oppose innovation, because innovation, including fintech, offers the world many potential benefits. As the group charged with ensuring financial stability, however, we have to work to ensure that we can reap the benefits offered by these new technologies without harming financial stability. We hope to offer some answers to these questions in the coming years and to do so in line with the principles I outlined earlier. We will address the questions with discipline and analytical rigor in a way that incorporates the views of the public and key stakeholders and that results in answers that are practical and intelligible.
Nonbank Financial Intermediation
The second issue I would like to discuss is nonbank financing. Since the global financial crisis, nonbank financing has grown relatively rapidly, in both its absolute size and its relative importance in intermediating credit. In the jurisdictions that the FSB closely monitors, nonbank financial assets are just under 50 percent of total global financial assets, a share that has grown by close to 5 percentage points since 2009. Nonbank financial intermediation (the artist formerly known as "shadow banking") provides a valuable alternative to bank financing and helps to support real economic activity. Accordingly, the shift within the financial system toward nonbank financing represents a welcome increase in the diversity of the sources of lending to both firms and households.
Even though the core of the financial system is much more resilient than before the global financial crisis, with strengthened bank capital and liquidity requirements, nonbank financing has been a source of systemic risk. Nonbank financing often features high leverage, maturity and liquidity mismatches, opaque structures, and concentrated holdings of risky assets. Nonbank financing can also lead to lower lending standards, bidding up the price of risky assets and sending an encouraging signal to credit underwriters. All of these channels played a role in the recent global financial crisis. More recently, new forms of interconnectedness between nonbank financial firms and the banking system have emerged that could, in some scenarios, act as channels for domestic and cross-border amplification of risks.
Given these potential risks, and the large--and increasing--role for nonbank financing, we need to monitor closely its development. Is the growth of nonbank financing altering the existing market structures? Are there new vulnerabilities in the financial system? How will nonbank financing develop?
To answer these important questions, the FSB is progressing on three related tracks. First, the FSB produces an annual report that outlines the developments in nonbank financing, detailing the global trends and potential risks. Second, the FSB promotes the resilience of nonbanks through the development of a range of policies to address systemic vulnerabilities where they arise, while not impeding the growth of sustainable nonbank financing models. In this way, we hope to promote resilient nonbank financial intermediation. The FSB, working alongside other standard-setting bodies such as the Basel Committee and IOSCO, is monitoring the implementation of these policies. Finally, knowing it is arrogant to expect that we got everything right the first time around, it is imperative that we start analyzing the effectiveness of the policies that have been implemented. How should we alter our policies? Have we modelled the risks from nonbank financing accurately? Have we missed a crucial new source of systemic risk? These are all questions that we must ask ourselves.
Evaluation of Too-Big-To-Fail Reforms
The third issue that I would like to raise is the problem of "too big to fail"--that is, the perception by investors that some institutions will receive support from their governments if they become distressed. This weakens market discipline and allows such firms to become even larger, more leveraged and more complex. To address this challenge, the FSB and other global standard setters developed a framework and a set of policy measures intended to reduce the moral hazard risks posed by systemically important financial institutions. These measures are intended to make the financial system more resilient, for example through higher capital and liquidity requirements, while simultaneously allowing these institutions to fail without causing disruption to critical services, such as payments. A key element of the FSB's policy measures to address too big to fail is its total loss absorbing capacity standard. Under this standard, the FSB introduced a bail-in (in contrast to a bailout) strategy that necessarily employs a gone concern or post-failure loss-absorbing and recapitalization capacity for the set of global systemically important banks.
Crucially, by raising resolution standards, we have improved the potential for non-disruptive bank failure. The implementation of these standards is most advanced in the banking sector, especially for the largest globally important banks. The FSB established crisis management groups, collections of supervisors who monitor resolution plans of the firms. At the same time, we must be conscious that we have not actually tested the failure of a large bank in the marketplace--surely a good thing!
Standing over a decade on from the start of the financial crisis, we must ask ourselves, how effective have we been at reducing the problem of too big to fail? Have we achieved our objective to reduce or eliminate the problem? Have we introduced new unintended risks to the financial system or costs to other financial market participants?
To start answering these important questions, as part of its broader effort to evaluate the effects of reforms, the FSB is launching an evaluation of the effects of these too-big-to-fail reforms. We intend to bring analytical rigor to these questions, and we recognize that the academic community has undertaken much work in this area. As a result, we will draw extensively on academic advisors during all phases of the work we are undertaking. I also encourage other experts in this field to look closely to the consultative document that will be coming from the study next year. We welcome the input as we undertake the study of this signature issue from the crisis.
Conclusion
Let me conclude by reiterating some of the broad themes I intended to convey today. First, I touched on some of the key principles that I hope will guide the FSB work while I am chair. Those principles include expanded engagement with a broad range of stakeholders and experts, rigorous and careful examination of financial vulnerabilities that may threaten our financial system, and analytical examination of past reforms to ensure that they are making the financial system as resilient as it can be in the most efficient manner possible.
Second, I shared some of the key questions we are working on relating to the rise of large technology firms in the financial sector and decentralized financial technologies, the growing importance of the nonbank financial sector, and our burgeoning efforts to look at how well we have addressed too big to fail, the signature issue of the recent financial crisis.
Moving forward there will surely be additional issues to address and areas to examine.a During my time as chair of the FSB, I hope to make progress not only on the areas I have outlined but on a range of forward-looking issues and continue to demonstrate the value of the FSB. International standard-setting bodies serve an important role within our global financial sector, and I look forward to the FSB advancing our progress and work in these areas.
NOTE:
- The document is available at http://www.fsb.org/2019/02/fsb-work-programme-for-2019/
FULL DOCUMENT: https://www.federalreserve.gov/newsevents/speech/quarles20190328a.htm
INDUSTRY
FED. March 27, 2019. Industrial Production and Capacity Utilization: The 2019 Annual Revision
The Federal Reserve has revised its index of industrial production (IP) and the related measures of capacity and capacity utilization.[1] On net, the revisions to the growth rates for total IP for recent years were small and positive, with the estimates for 2016 and 2017 a bit higher and the estimates for 2015 and 2018 slightly lower.[2] Total IP is still reported to have increased from the end of the recession in mid-2009 through late 2014 before declining in 2015 and rebounding in mid-2016. Subsequently, the index advanced around 7 1/2 percent over 2017 and 2018.
Capacity for total industry expanded modestly in each year from 2015 to 2017 before advancing 1 1/2 percent in 2018; it is expected to advance about 2 percent in 2019. Revisions for recent years were very small and showed slightly less expansion in most years relative to earlier reports.
In the fourth quarter of 2018, capacity utilization for total industry stood at 79.4 percent, about 3/4 percentage point above its previous estimate and about 1/2 percentage point below its long-run (1972–2018) average. The utilization rate in 2017 is also higher than its previous estimate.
This revision incorporated newly available annual data on output and prices. The IP indexes for publishing reflect new data for 2017 and revised data for 2016 from the U.S. Census Bureau's Service Annual Survey, and the IP indexes for logging were updated with 2017 data from the U.S. Forest Service. In addition, the indexes for metallic and nonmetallic minerals were updated with revised annual data for 2017 from the U.S. Geological Survey (USGS). The nominal benchmark data used for manufacturing industries—the Census Bureau's Census of Manufactures—are not yet available for 2017. However, data on prices from the Bureau of Labor Statistics (BLS) were incorporated into most of the manufacturing indexes.
The monthly estimates of production have been updated to include late-arriving or revised quarterly or monthly indicator data. These data include direct measures of output as well as the benchmark revisions to production-worker hours from the BLS's Current Employment Statistics report.[3] The monthly IP estimates also now reflect recalculations of seasonal factors.
The revised estimates of capacity and capacity utilization incorporated data from the Census Bureau's Quarterly Survey of Plant Capacity Utilization (QSPC) for the fourth quarter of 2018, along with new data on capacity from the USGS, the Energy Information Administration (EIA), and other organizations.
RESULTS OF THE REVISION
Industrial Production
Manufacturing output edged up in 2016 before advancing more than 2 percent in both 2017 and 2018. Compared with previous reports, the gain in 2018 is a little smaller, while the rates of change for 2017 and 2016 are larger. Despite the net upward revision, manufacturing IP in February 2019 was about 4 1/2 percent below its pre-recession peak.
The revised contour for mining output is little different from before: Output dropped significantly in 2015 and 2016 but then jumped more than 10 percent in both 2017 and 2018. The output of utilities advanced moderately in 2016 through 2018; the gains in 2016 and 2018 are now reported to be slightly weaker than before, while the gain in 2017 is stronger.
Production by Industry Group
The output of durable manufacturing industries edged down in 2016 before rising about 2 1/2 percent and 4 percent in 2017 and 2018, respectively. The output of nondurable goods increased about 3/4 percent in 2016, jumped more than 2 1/2 percent in 2017, and then moved up about 3/4 percent again in 2018. For both durable and nondurable manufacturing, current estimates of growth rates are slightly higher for 2016 and 2017 and slightly lower in 2018 than previously reported. The revisions for the 2016–18 period were generally small and were widespread across industries.
The output index for industries in scope for manufacturing IP that are not part of manufacturing under the North American Industry Classification System (NAICS)—that is, logging and publishing—fell in every year from 2014 to 2018. Relative to earlier reports, the index now declines more steeply in 2015 and 2018 and less steeply in 2016 and 2017.
Production by Market Group
The index for consumer goods has increased in each of the past six years, with the revised index growing at roughly the same pace as the previously published index over this period. Likewise, the index for business equipment was little revised; it increased 4.0 percent or more in both 2017 and 2018 after falling in the previous two years. The indexes for construction supplies and business supplies have increased in each of the past three years, with somewhat stronger gains in 2016 and 2017 and weaker gains in 2018 than what was previously published. The revisions to the output of defense and space equipment are more notable; the index is now estimated to have fallen significantly more slowly in 2017 and to have risen less steeply in 2018. The index for materials has increased sharply in each of the past two years, with the gain in 2017 a bit faster than previously reported.
Capacity
Manufacturing capacity contracted slightly in 2015 but then increased modestly in subsequent years, with annual increases averaging about 3/4 percent. These rates of changes are generally a little lower than previously reported values. The capacity indexes for durables and nondurables have increased in recent years, while capacity for ``other manufacturing'' (logging and publishing) has declined fairly steeply.
Capacity at mines declined nearly 3 percent in 2016 but then edged up in 2017 and jumped 7 percent in 2018; it is expected to advance 5 percent in 2019. Capacity was previously reported to have fallen in 2017, and the rates of change for 2016 and 2018 were also revised up. Capacity at utilities is reported to have increased about 1 1/2 percent per year from 2016 to 2018; these rates of increase are modestly lower than reported earlier.
Capacity Utilization
Capacity utilization for total industry declined in 2016 but rose in 2017 and 2018.[4] The increases in 2017 and 2018 resulted from sizable gains in the rates for mining and from smaller advances in the rates for both manufacturing and utilities. Compared with earlier estimates, capacity utilization for total industry is now reported to have been somewhat lower in 2015 but higher in 2017 and 2018.
Utilization at manufacturers fell in 2016 and increased in 2017 and 2018; for the fourth quarter of 2018, the utilization rate is estimated to have been around 1 1/4 percentage points below its long-run average. The rates for 2017 and 2018 are now reported to be higher than published earlier. By the fourth quarter of 2018, the utilization rate for durables was about the same as its long-run average. By contrast, the utilization rate for nondurable manufacturing remained below its long-run average at the end of 2018 and had been so for several years. The utilization rate for ``other manufacturing'' industries has been declining for many years; at the end of 2018, it stood far below its long-run average.
Capacity utilization rates for mining fell in 2016 before rising sharply in 2017 and advancing further in 2018. The gains in 2017 and 2018 were largely due to output increases for oil and gas extraction, drilling, and servicing that outstripped capacity growth. By the end of 2018, the utilization rate for mining stood 5 percentage points above its long-run average of 87.1 percent. Relative to the previously published rates, utilization at mines for 2018 is about 2 1/2 percentage points lower; revisions to other recent years were smaller. The operating rate for utilities has been well below its long-run average for the past several years. Compared with the previous estimates, utilization rates for utilities are slightly lower in 2015 and 2016 and somewhat higher in 2017 and 2018.
TECHNICAL ASPECTS OF THE REVISION
The IP indexes represent the level of real output relative to a base year. At the monthly frequency, movements of the indexes are based on indicators that are derived using industry-specific data from a variety of government and private sources. The monthly production indexes, however, are anchored to annual benchmarks that are less timely but typically based on more comprehensive data. In most cases, the annual benchmark is nominal gross output reported by the Census Bureau deflated by a suitable price index.
Annual revisions to the IP and capacity measures involve (1) incorporating new or revised annual benchmark data on output, prices, and value-added proportions; (2) incorporating new monthly or quarterly data that were revised or that arrived too late to be included in the regular six-month reporting window for monthly IP; (3) updating seasonal adjustment factors; and (4) updating the methods and industry structure used to construct the indexes.
Annual Benchmark Data on Output, Prices, and Value-Added Proportions
Output
The annual benchmark output indexes for IP are measures of real gross output at the six-digit NAICS level. The Census Bureau provides annual figures for value added and for the cost of materials for manufacturing industries, which can be summed to obtain nominal gross output. The Census Bureau has not yet published the 2017 Census of Manufactures, so new nominal benchmark data are not available for manufacturing.
New annual data were incorporated for several non-manufacturing industries. The benchmark indexes for metallic and nonmetallic mineral mining were updated with revised 2017 data from the USGS, and the benchmark indexes for logging and publishing were advanced through 2017 based on data from the U.S. Forest Service and the U.S. Census Bureau.
Prices
To obtain individual benchmarks of real gross output, the measures of nominal gross output are deflated by annual price deflators. In general, the benchmark industry price deflators consist of price indexes from the Bureau of Economic Analysis (BEA) through 2011 that are extended with the related producer price indexes (PPIs) from the BLS.[5] However, for a few selected industries, the annual price deflators are constructed by the Federal Reserve.[6]
Value-Added Proportions (Weights for Aggregation)
The IP system is organized as a hierarchical structure where the individual production indexes are combined using a version of the Fisher-ideal index formula to construct broader measures of production. Individual IP measures are combined into more aggregate measures using weights based on the value added from the industry (calculated as gross output less cost of materials). Value-added weights are used to avoid double counting the contributions of upstream producers in the output of their downstream consumers (for example, to avoid double counting the contributions of steel used in automobile production). For IP indexes in manufacturing that are defined at the six-digit (or more aggregate) NAICS level, the value-added weights are derived from either the Economic Census or the Annual Survey of Manufactures. For IP indexes that cover only part of a six-digit NAICS industry, the aggregation weights are constructed by allocating value added (as defined by the Census Bureau) for a six-digit industry across the various components of IP that compose that industry. Data from the Economic Census and the ASM on shipments of different types of products within a six-digit NAICS industry are used to determine the share of an industry's value added that is assigned to each component IP index.
The Federal Reserve derives estimates of value added for the electric and gas utility industries from annual revenue and expense data issued by other organizations. For electric utilities, the measures of value added incorporate data from the Energy Information Administration of the U.S. Department of Energy and from the Edison Electric Institute. For gas utilities, the value-added estimates incorporate data from the American Gas Association. The weights for aggregation for mining industries are derived from value-added data from the Economic Census. For the years between the quinquennial Economic Censuses, measures of value added for mining are estimated based on both output and price changes for the industry.
The weights for aggregation expressed as value added per unit were estimated with data on producer prices for the period after 2016.
Revised Quarterly and Monthly Data
This revision incorporated source data on production, shipments, inventories, and production-worker hours that became available or were revised after the regular six-month reporting window for monthly IP was closed. These data were released with too great of a lag to be included with monthly IP estimates but were available for inclusion in the annual revision. The revised IP indexes include information from the QSPC for 2018 and from other industry reports.
Revised Seasonal Factors
Seasonal factors for production-worker hours—which adjust for timing, holiday, and monthly seasonal patterns—were updated with data through January 2019. The updated factors for the physical product series, which include adjustments for holiday and workday patterns, used data through December 2018 where available.
Seasonal factors for unit motor vehicle assemblies have been updated, and projections through June 2020 are available on the Board's website at https://www.federalreserve.gov/releases/g17/mvsf.htm. These factors are based on production data through January 2019 and were revised back to January 2014. The seasonal factors explicitly incorporate the holiday schedule for the industry specified in the latest collective bargaining agreements with domestic manufacturers.
Methodological Changes to Individual Production and Capacity Indexes
Consolidation of Production Indexes for Wool Fabrics and for Cotton and Synthetic Fabrics
This revision combines the indexes for wool fabrics (NAICS 31321pt.) and cotton and synthetic fabrics (NAICS 31321pt.) into a consolidated index for broadwoven fabric mills (NAICS 31321).[7] The individual indexes for both wool fabrics and cotton and for synthetic fabrics used production-worker hours as an indicator of output for the period from 2003 to the present, and the consolidated index relies on production-worker hours. For the period prior to 2003, the monthly index relies on data from other sources (a combination of physical product data and electric power usage).
Change in Source Data for Four Production Indexes
With this revision, four indexes that previously were based on physical product data are now based on production-worker hours. The changes occurred because the issuing organizations discontinued the reports from which the physical product data were derived. The affected indexes include artificial and synthetic fibers and filaments (NAICS 32522); copper refining (NAICS 33141pt.); copper rolling, drawing, extruding, and alloying (NAICS 33142); and office furniture (NAICS 3372). For office furniture, the monthly production index is based on physical product data for the period from 1972 to 2012 and on production-worker hours thereafter. The other three indexes are based on physical product data from 1972 to 2017 and on production-worker hours thereafter.
New Annual Data for Military Aircraft Production Index
The monthly production index for military aircraft (NAICS 336411pt.) is based on production-worker hours for overall aircraft and is influenced by the value of expected and actual annual deliveries for different types of military aircraft for years when benchmark data are not yet available. Prior to this revision, the sources for the value of deliveries were manufacturers' reports for certain aircraft models. The source data used in this revision also include information on deliveries and prices from Aviation Week that were not used previously.
Changes to Capacity Index for Artificial and Synthetic Fibers and Filaments
With this revision, the capacity index for artificial and synthetic fibers and filaments (NAICS 32522) for the period beginning in 2017 is based on data from the Census Bureau's Quarterly Survey of Plant Capacity and Utilization. For the period prior to 2017, the capacity index remains based on data for capacity in pounds from the Fiber Economics Bureau.
Updated Base Year for Gross Value of Output Measures
This revision updates the base year used in the published measures of gross value of final products and nonindustrial supplies. The measures are now reported in billions of 2012 dollars, which is consistent with the measures reported in the national income and product accounts published by the BEA.
Data Availability and Publication Changes
Files containing the revised data and the text and tables from this release are available on the Board's website at https://www.federalreserve.gov/releases/g17, as are updated data for the annual revision and for all of the regularly issued series on IP, capacity, and capacity utilization. Other changes are listed on the Board's website at https://www.federalreserve.gov/releases/g17/g17_revision_series.htm.
- The revision affected rates of change for IP from 1972 forward. When necessary to maintain consistency with any revisions to the data for 1972 and subsequent years, the levels of production for the years before 1972 were multiplied by a constant. However, the rates of change in IP for the years before 1972 were not revised. Utilization rates and capacity growth rates were revised minimally between 1968 and 1971, but they were unchanged before then.
- Rates of change are calculated as the percent change in the seasonally adjusted index from the fourth quarter of the previous year to the fourth quarter of the year specified.
- Production-worker hours are used as output indicators for IP indexes for which no direct measures of production are available.
- Unless otherwise noted, rates of capacity utilization are reported for the fourth quarter of the reference year.
- Overall, at the industry level, the BEA and PPI measures are quite similar, as the BEA used weighted product-level PPIs to derive its industry-level shipments deflator.
- For selected industries, the Federal Reserve constructs price indexes from alternative sources. These industries include communications equipment (NAICS 3342), computer storage devices (NAICS 334112), semiconductors (NAICS 334413), and pharmaceuticals (NAICS 325412). Updated price indexes for computer storage devices are available on the Board's website at https://www.federalreserve.gov/releases/g17.
- Industry codes followed by ``pt.'' indicate that the index covers only part of the entire NAICS code listed.
FULL DOCUMENT: https://www.federalreserve.gov/releases/g17/revisions/Current/DefaultRev.htm
AGRICULTURE
FED. March 28, 2019. Speech. Agriculture and Community Banking. Governor Michelle W. Bowman. At the Ag Lenders Conference, sponsored by The Independent Community Bankers Association of New Mexico, Deming, New Mexico
Good morning. It is a pleasure to be here today to discuss the important role agriculture plays in our economy, a role that is supported by many community banks. I would like to thank the Independent Community Bankers Association and their New Mexico state association for inviting me to participate in the conversation we will have today. In addition to the bankers and state leaders here, agricultural bankers and other leaders in the industry are listening in from around the country, and I look forward to hearing their views in a few moments.
During our time together, I would like to offer some observations on the current state of the farm economy. And because I see community bankers as playing a vital role in this sector, I'll explain why I believe the community banking model is well-suited to supporting agricultural businesses. Finally, I will highlight the Federal Reserve's approach to supervising agricultural banks.
As many of you know, before joining the Federal Reserve, I worked at a community bank that primarily served ranchers and farmers and the businesses that support them. More recently, as Kansas state bank commissioner, I supervised many banks whose business and customers were closely connected to the land and the people who work it. I now have the honor of being the first governor to fill the role designated for someone with community banking experience on the Federal Reserve Board, a position that was created by statute in 2015.1 I plan to fulfill this unique responsibility by traveling widely and listening closely to community bankers, consumers, farmers, ranchers, and dairy farmers--all of the stakeholders with an interest in our work. My goal is to bring back the knowledge I gain from discussions and visits like the one we are having today and use it to improve our work. In doing so, I am confident our work will be more effective and efficient. And in the process, I hope to help you better understand the role of the Federal Reserve and what we are trying to accomplish.
The Federal Reserve's monetary policy mandate is twofold: to promote maximum employment and stable prices. To do that, we continuously monitor the health of the U.S. economy in general, and because of its sizable share of overall activity, the agricultural sector in particular. U.S. agriculture and its related industries support about 22 million jobs in the United States and produce close to 10 percent of our exports.2 A healthy farm economy also supports many rural and regional economies. We track commodity prices, ag credit, and exports as factors that influence our outlook on inflation and economic growth. As bank supervisors, we work to ensure safe and sound banking practices. We also monitor trends in asset quality and risk-management practices at agricultural banks as part of our ongoing assessment of the level and direction of risk at these financial institutions and within the agricultural economy.
Earlier this week, I had the privilege of welcoming farm sector leaders to the Federal Reserve Board in Washington, where we hosted the 2019 National Agricultural Credit Conference. For nearly 80 years, this conference has brought together leaders in this sector to discuss important issues related to farm credit. Attendees at this year's conference recognized that, while the outlook for the farm economy in 2019 may be similar to a year ago, there are ongoing concerns that increasing stress on producers could lead to repayment difficulties.
Farm incomes are expected to remain relatively low this year after declining sharply from the 2013 peak. The price of major agricultural commodities has also remained low in early 2019. For example, today, the price of corn is about 40 percent lower than it was from 2010 to 2013. Dairy producing states like New Mexico are well aware that average milk prices were about 15 percent lower in 2018 than from 2010 to 2013, and well below the highs of 2014. As noted in recent Federal Reserve System Beige Books, higher tariffs on soybeans and other U.S. exports and continued uncertainty over trade policy represent headwinds for American producers.
Here in New Mexico, agricultural production rose 5 percent to $3.4 billion in 2017, with strong gains in milk production and livestock. Coming from a ranching family, I'm well aware of the challenges facing livestock producers. New Mexico is also the nation's second largest producer of pecans, producing a record 92 million pounds worth $220 million in 2017. I'm also looking forward to touring a farm later today to learn more about a crop we don't grow a lot of in Kansas--chili peppers. The demand for chili peppers and pecans grown in New Mexico is a good example of the kinds of regional variations we see in agriculture and many other industries.
While it is important to understand regional trends, I would like to focus this morning on some overarching themes that have emerged in recent years. Recently, a great deal of attention understandably has been paid to an increase in the number of U.S. farm bankruptcies. While this is, of course, an important indicator to watch, it's equally important to note that the rise over the past few years has been fairly modest. Specifically, Chapter 12 filings increased from 360 in 2014 to about 500 in 2018. The Federal Reserve tracks these developments closely because of their potential implications for both the economy and banking supervision.
The challenging outlook has prompted some to wonder if the industry is about to relive the hard times of the 1980s farm crisis. But here, I think, the historical contrast is somewhat reassuring. In the 1970s, farm income in the United States had advanced rapidly as exports surged. The broad increase in farm income led to a significant rise in capital investments in the years that followed. But exports began to soften and fell sharply after the suspension of trade with the then-Soviet Union. Farm incomes dropped, profits declined rapidly, and liquidity in the U.S. farm sector dried up.
Other factors turned the sharp downturn into a crisis. High interest rates in the early 1980s, in response to the Great Inflation, contributed to the stress.3 Despite the reductions in profits and liquidity, capital spending remained elevated in the early 1980s, and was financed with higher levels of debt made possible by rising land values. With debt burdens rising and incomes falling, many farm operations were forced to sell their land, causing the value of farmland to decline rapidly. The result was a sharp increase in farm bankruptcies and a number of bank failures.
What about now? There are some similarities. Farm incomes rose rapidly from 2000 before reaching their peak in 2013 at $123 billion.4 During that time, spurred by rising demand in China and a boom in biofuels, farmers invested heavily in new equipment and technology to meet this rising demand. And, in a troubling echo of the 1980s, farm incomes have now been cut roughly in half.
That said, there are some important differences between the 1980s and today. With current inflation low and stable, interest rates are substantially lower than in the 1980s, and overall leverage has been less pronounced. And in contrast to the 1980s, farmland values have declined only modestly in recent years. The combination of relatively low interest rates and modest debt levels has resulted in more-manageable debt service requirements for many agricultural borrowers.5
Some farm operations have faced significant financial stress, and it is important to recognize that there are still risks. Farmland prices are quite high, and working capital continues to decline. However, returns at banks with a concentration in agriculture have generally remained healthy, as most producers have continued to make loan payments despite weakening revenue streams.
Let me shift focus now to the role of banks, particularly community banks, in the U.S. farm economy. Community banks foster strong long-term relationships with farmers, ranchers, and others involved in the local business of agriculture. Often, these relationships are cultivated through community bankers' service on local civic and business organizations or by participation with local farmers and their families in activities to support the local community and economy. Agricultural community banks and agricultural borrowers share a common goal of serving and strengthening their local communities. They are also responsible for providing jobs that maintain the viability of these rural communities. Frequently, community bankers' ties to local agricultural businesses include running family farms, ranches, orchards, and dairies. In other instances, members of the boards of directors that help to oversee community banks are heavily involved in the business of agriculture. These close connections to local agricultural businesses provide community banks with a unique and important perspective in helping to meet local agricultural credit needs.
Additionally, community banks can be more agile than their larger competitors, as they employ lenders with a deep understanding of local products and conditions and are able to offer customized funding options in response to changing lending conditions. This agility ultimately allows for better informed lending decisions and provides agricultural borrowers with the means to fund their operations and sustain their communities.
As bank supervisors, we pay close attention to the performance of all banks, including agricultural banks. Before we start our conversation today, I would like to discuss how the Federal Reserve approaches bank supervision with a focus on agriculture lending and the challenges our farmers and the community banks that support these operations are facing.
Overview of Agricultural Banks
There are approximately 1,400 "agricultural banks" in the United States, all of which play a vital role in providing rural producers with access to credit.6 Agricultural banks hold approximately 50 percent of all agricultural loans outstanding at U.S. commercial banks. As I noted earlier, farm income has declined by approximately 50 percent since 2013, yet agricultural loans have steadily increased. Additionally, agricultural banks have more challenging funding structures given the seasonal funding needs of their agricultural customers and the difficulty of attracting deposits at rural institutions. This combination of a cyclical deposit base, lower inflows of deposits into rural community banks, and growing loan demand from agricultural borrowers has resulted in a greater dependence on borrowed funds to support the recent growth in agricultural lending.
Approximately one-third of all agricultural banks are highly concentrated agricultural banks, and the number of these banks has declined slightly over the past several years--from 479 in December 2016 to 449 in September 2018. Although there are some unique risks and challenges for highly concentrated agricultural banks and their supervisors, these banks also generally remain in sound financial condition. And capital levels and liquidity metrics at most ag banks are generally in line with other banks that do not share these concentrations.
While concentrated agricultural banks are currently operating with adequate capital ratios, regulators continue to closely monitor capital levels and to encourage prudent capital planning and concentration risk management, given the potential for unforeseen challenges and emerging risks associated with agricultural lending.
With respect to liquidity, as previously noted, rapid asset growth can strain a bank's liquidity position if its funding sources turn out to be unstable. As supervisors, we work with bankers to understand their liquidity planning process, their challenges around attracting deposits, and the risks associated with potentially relying too heavily on noncore sources of funding. We have observed the increasing pressure on community banks to compete for deposits; however, we still see many community banks overcoming this challenge and effectively competing for deposits in their communities.
Another key component of all community bank examinations is a focus on asset quality. Financial indicators for agriculture banks remain at manageable levels as highlighted by the nonperforming agricultural loans to total loans ratio of 1.36 percent as of September 2018.
In addition to the traditional focus on the financial factors related to agricultural lending, the Federal Reserve has provided examiners with helpful insights into the appropriate treatment of agricultural carryover debt. We understand that bankers need to work constructively with borrowers when problems arise. And this is particularly true for highly concentrated agricultural banks, where maintaining enhanced agricultural credit risk-management practices to facilitate prudent underwriting, early detection of problems, and well-thought-out restructuring plans for agricultural borrowers are imperative to limiting losses and maintaining a sound banking institution.
In 2011, the Federal Reserve also issued guidance to the industry on key risk factors in agricultural lending and supervisory expectations for a financial institution's risk-management practices.7 This guidance applies in all economic environments, but it is especially important in periods of economic stress, because it reminds bankers that the identification of a troubled borrower does not prohibit a banker from working with the borrower.
Many banks engaged in agricultural lending are located in communities where farming is the primary economic driver, and simply pushing every borrower with challenges out of the bank does not benefit the long-term interests of the bank or the community it serves. The Federal Reserve recognizes the benefits when lenders work prudently with troubled borrowers in a way that serves the long-term interests of all stakeholders.
I would like to conclude by recognizing how fortunate we are to have so many highly skilled and experienced farmers and operators, and agricultural lenders who support them. Modern agriculture is a sophisticated and complex business that requires skilled forecasting of supply and demand, rigorous financial and operational management, and sharp technical expertise. Our farmers and operators are pushing forward the frontiers of agriculture. The integration of robotics, data analytics, geolocation, and advanced sensors holds the promise of a new, more efficient and productive era of "precision agriculture."
A close working relationship between farmers and agricultural lenders is essential to the economic growth of agricultural borrowers and the continued success of many rural communities. The outlook for U.S. agriculture is challenging, though agricultural banks remain relatively stable. As such, it is important for the Federal Reserve to continue to tailor effective supervision and regulation to ensure the safety and soundness of agricultural banks, while also making sure that undue burden does not constrain the capacity of these institutions to continue supporting the agricultural communities that they serve.
NOTES
- Terrorism Risk Insurance Program Reauthorization Act of 2015 (Pub. L. 114-1, 129 Stat. 3).
- See U.S Department of Agriculture, Economic Research Service at https://www.ers.usda.gov/data-products/ag-and-food-statistics-charting-the-essentials/ag-and-food-sectors-and-the-economy/.
- Jerome H. Powell, "Monetary Policy in a Changing Economy" (speech at Changing Market Structure and Implications for Monetary Policy, a symposium sponsored by the Federal Reserve Bank of Kansas City, Jackson Hole, Wyoming, August 24, 2018).
- U.S. Department of Agriculture, Economic Research Service, "Highlights from the March 2019 Farm Income Forecast."
- Cortney Cowley and Ty Kreitman, "Farmland Values Stable, but Risks to Outlook Remain," Federal Reserve Bank of Kansas City, February 14, 2019.
- Agricultural banks are defined as banks with farm production and farm real estate loans equal to 25 percent or more of total loans.
- See Supervision and Regulation SR Letter 11-14, "Supervisory Expectations for Risk Management of Agriculture Credit Risk."
FULL DOCUMENT: https://www.federalreserve.gov/newsevents/speech/bowman20190328a.htm
________________
ORGANISMS
IMF. MARCH 25, 2019. Corporate Taxation in the Global Economy
By Christine Lagarde
The public perception that some large multinational companies pay little tax has led to political demands for urgent action.
It is not difficult to see why.
Let me highlight three reasons why a new approach to international corporate taxation is urgent.
First, the ease with which multinationals seem able to avoid tax, and the three-decade long decline in corporate tax rates, undermines faith in the fairness of the overall tax system.
Second, the current situation is especially harmful to low-income countries, depriving them of much-needed revenue to help them achieve higher economic growth, reduce poverty, and meet the 2030 Sustainable Development Goals.
Advanced economies have long shaped international corporate tax rules, without considering how they would affect low-income countries.
IMF analysis shows, for example, that non-OECD countries lose about $200 billion in revenue per year, or about 1.3 percent of GDP, due to companies shifting profits to low-tax locations.
These countries need a seat at the table. The Platform for Collaboration on Tax, a joint effort by the IMF, World Bank, OECD and the UN is helping on this front.
Advanced economies have long shaped international corporate tax rules, without considering how they would affect low-income countries.
Third, an impetus for rethinking international corporate taxation stems from the rise of highly profitable, technology-driven, digital-heavy business models.
These business models rely heavily on intangible assets, such as patents or software that are hard to value.
They also demonstrate that assuming a link between income and profits and physical presence has become outdated.
This in turn has sparked fairness concerns. Countries with many users or consumers of digital services find themselves with little or no tax revenue from these companies. Why? Because they have no physical presence there.
So, we clearly need a fundamental rethink of international taxation.
Yet this means countries must work together. Making progress requires coordination among all, and in the right direction.
New IMF research analyzes various options in the context of three key criteria: better addressing profit-shifting and tax competition; overcoming the legal and administrative obstacles to reform; and ensuring full recognition of the interests of emerging and developing countries.
The current international corporate tax architecture is fundamentally out of date. By rethinking the existing system and addressing the root causes of its weakness, all countries can benefit, including low-income nations.
GLOBAL DEVELOPMENT
THE WORLD BANK. 03/25/2019. 7 reasons for land and property rights to be at the top of the global agenda
Laura Tuck's
This week, more than 1,500 development professionals from around the world are gathering at the World Bank’s annual Land and Poverty Conference, discussing the latest research and innovations in policies and good practice on land governance.
Secure property rights and efficient land registration institutions are a cornerstone of any modern economy. They give confidence to individuals and businesses to invest in land, allow private companies to borrow – using land as a collateral – to expand job opportunities, and enable governments to collect property taxes, which are necessary to finance the provision of infrastructure and services to citizens.
Unfortunately, a mere 30% of the global population has legally registered rights to their land and homes.
Without land tenure systems that work, economies risk missing the foundation for sustainable growth, threatening the livelihoods of the poor and vulnerable the most. It is simply not possible to end poverty and boost shared prosperity without making serious progress on land and property rights.
The international community has recognized the fundamental role that land plays in sustainable economic growth by including it in 8 targets and 12 indicators of the Sustainable Development Goals. However, to achieve these ambitious goals, policymakers and governments will need to deliberately explicitly move secure land and property rights to the top of the global agenda. Here are seven reasons why:
1. Secure land rights are an important pillar for agriculture.
As populations and consumption continue to grow, the global demand for food will continue to increase as well. A multifaceted and comprehensive global strategy is necessary to ensure sustainable and equitable food security. This strategy will need to include interventions to increase agricultural yields through improved security of land rights, research and extension, and more agricultural inputs (such as fertilizers). Research has shown that secure land titles provide incentives for farmers to invest in land, borrow money for agricultural inputs and improvements to their land, and enable land sale and rental markets to ensure full utilization of land.
2. Secure land rights are essential for urban development.
In 1950, about two-thirds of the global population lived in rural settlements and one-third in urban settlements. By 2050, we will observe roughly the reverse distribution with more than 6 billion people living in urban areas. Most of the increase in urban areas will occur in Africa and Asia. Failure to clarify land rights and fix distorted land policies contributes to increased property values, making them potentially unaffordable to the urban poor. These gaps have already led to the formation of large informal settlements in many cities around the world. According to the World Bank report “Africa’s Cities: Opening Doors to the World,” the top priority for African cities to create more affordable and livable urban environments is to formalize land markets, clarify property rights, and institute effective urban planning.
3. Secure property rights help protect the environment.
Research has shown that people are better stewards of the environment and their natural resource base when their property rights are secure. One of the most destructive environmental practices over the last 50 years has been forest degradation. In the 1950s and 1960s, many countries tried to protect the forest by delineating forest boundaries, but failed to do so because the legal status of these lands was unclear. To reverse this pattern, governments will need to develop policies that improve tenure security in forest areas – so environmentally sensitive land remains as forest – and allow the transfer land use in non-environmentally-sensitive areas to agriculture or other production.
4. Secure property rights and access to land are crucial for private sector development and job creation.
The private sector needs land to build factories, commercial buildings, and residential properties. According to a report that assesses private sector performance in the Middle East and North Africa, the top constraints to the region’s private sector include the lack of access to land as well as issues related to land titling and registration. Companies often use land or property titles as collateral to finance operational costs as well as to expand existing businesses or open news ones, thus creating more jobs.
5. Secure property rights are important for empowering women.
The World Bank Group’s gender strategy highlights access to assets as one of the three main pillars for women’s empowerment. Unfortunately, many women around the world continue to be denied land rights for multiple reasons: i) the legal framework does not fully support equal access to property ownership or use of land titles as a collateral without a male guardian; ii) men don’t always register their properties in the names of both husband and wife, resulting in women often losing their home or land in the case of a divorce or the death of the husband; and iii) in some cultures, women do not inherit land or properties despite having legal rights to do so – they are often forced by male relatives to waive their rights. To close the gap between law and practice on women’s land rights, a multi-stakeholder global advocacy campaign called “Stand for Her Land” has been launched by the World Bank, Landesa, Global Land Tool Network (GLTN) Partners, UN-Habitat, Habitat for Humanity, the Huairou Commission, and local women and communities worldwide.
6. Secure property rights help secure indigenous peoples’ rights.
Many countries do not legally recognize indigenous peoples’ land rights, even though they have lived on their ancestral land for many generations, often predating the establishment of the modern state and even the modern recording of rights. Recognizing indigenous peoples’ land rights is not only a human rights issue, but it also makes economic and environmental sense. Once their land rights are recognized, indigenous peoples will be able to use the resources on their land more sustainably, thus improving their economic and social status as a constructive force in society.
7. Secure property rights are vital for keeping peace.
Today, we are witnessing the horrors of war and conflict in many regions around the world. Conflicts force millions of people to flee, leaving their properties behind. Without their property rights legally protected at home, displaced people will not be able to go back to their homes and livelihoods. In fact, peace cannot be fully achieved if land and property rights are not well addressed, potentially triggering a second round of conflict. On a hopeful note, when these conflicts end, secure property rights can become a critical foundation for reconstruction.
With current commitments of approximately $1.5 billion, the World Bank has supported more than 50 countries over the last 25 years to improve land tenure security through policy and legal support, institutional and capacity development, and financing efforts for land titling and digitalizing land registration systems, in addition to analytical products and technical assistance to many countries.
Secure land and property rights are not only at the heart of sustainable development, but they should also be lifted to the top of the global agenda.
The good news is that with modern tools to capture data – such as drone mapping and handheld GPS devices – and disruptive technologies such as artificial intelligence and blockchain, we can do things faster, better, and more cheaply.
Our hope is that by 2030, collectively, we can reverse the ratio of tenure security, and see 70% of the world’s population with secure property rights – benefiting from the support of new technology, continued work on legal and policy frameworks, and increased financing. That would bring us one major step closer to achieving inclusive, resilient, and sustainable communities for all.
FULL DOCUMENT: https://blogs.worldbank.org/voices/7-reasons-land-and-property-rights-be-top-global-agenda?cid=ECR_E_NewsletterWeekly_EN_EXT&deliveryName=DM10746
________________
ECONOMIA BRASILEIRA / BRAZIL ECONOMICS
PIB
IPEA. 28/03/2019. Ipea prevê crescimento de 2% no PIB e inflação de 3,85% em 2019. Estudo estima que espaço fiscal pode cair de R$ 151 bilhões neste ano para R$ 51 bilhões em 2023 sem reforma da Previdência
O Instituto de Pesquisa Econômica Aplicada (Ipea) reviu de 2,7% para 2% a previsão de crescimento do Produto Interno Bruto em 2019. Segundo estudo divulgado nesta quinta-feira, 28, pelo Grupo de Conjuntura do instituto, os primeiros indicadores do ano mostram que a recuperação da atividade econômica permanece lenta. As projeções para inflação foram reduzidas de 4,10% para 3,85%.
A análise aponta que, dada a limitação para a atuação das políticas fiscal e monetária, o estímulo de curto prazo à economia fica condicionado à melhora nas expectativas e à implementação de políticas de aumento de produtividade, como novas concessões na área de infraestrutura e a medidas na área de crédito.
A necessidade de redução de deficit fiscal primário faz com que o estímulo da economia tenha que vir, necessariamente, do setor privado. “Tendo como base um cenário em que a reforma da Previdência é aprovada com impacto fiscal relevante em meados de 2019, projetamos a aceleração do crescimento trimestral ao longo do ano, condição necessária para atingir o crescimento anual esperado de 2%”, afirma a Carta de Conjuntura.
O crescimento do PIB será liderado pelo bom desempenho da absorção doméstica, na avaliação dos pesquisadores. Embora não seja esperada uma melhora significativa dos indicadores de mercado de trabalho este ano, o consumo das famílias deverá crescer 2,6% no período. Com um ambiente econômico caracterizado por um mercado doméstico mais aquecido e níveis de incerteza decrescentes, a recuperação dos indicadores de confiança dos empresários deverá se traduzir em mais investimentos ao longo do ano – a Formação Bruta de Capital Fixo (FBCF), que mede os investimentos da indústria, deve fechar 2019 com expansão de 4,7%, mantida a baixa participação do setor da construção civil.
A previsão para o PIB agrícola permanece a mesma, em 0,4%, considerando as perspectivas de safra do ano. O PIB industrial, estimado em 1,8%, reflete a lenta retomada dos índices mensais de atividade industrial. Para o PIB de serviços, a previsão é de crescimento de 2,2%. Em relação às exportações, o Ipea estima um crescimento de 4% no ano.
Para 2020, a expectativa de crescimento do PIB, ainda condicionada à aprovação da reforma da Previdência, é de 3%. As projeções indicam ainda um aumento de 7,8% nos investimentos, graças ao amadurecimento do programa de concessões para infraestrutura. O avanço das medidas de liberalização e produtividade deve ter impacto positivo na economia, alavancando o consumo e a renda das famílias. A aceleração do consumo estará associada também à gradual redução nos índices de desemprego e ao amadurecimento das medidas de crédito.
A expectativa mais positiva de crescimento do PIB do ano que vem é compatível com a estimativa de manutenção da taxa básica de juros no atual nível, o mais baixo historicamente, devido ao comportamento do grau de ociosidade da economia brasileira. O Indicador Ipea de Hiato do Produto mostra que o PIB se encontra, atualmente, em 3,2% de seu nível potencial. Além disso, mesmo com a recuperação mais intensa, algum nível de ociosidade deve ser mantido até o fim de 2020.
O Grupo de Conjuntura também analisa o impacto da Previdência no espaço fiscal – diferença entre o teto dos gastos e as despesas obrigatórias e incomprimíveis – e os possíveis efeitos da reforma proposta pelo governo federal, em termos de economia para o país. Caso a reforma seja aprovada na íntegra pelo Congresso, a margem fiscal aumentará, em média, cerca de R$ 40 bilhões por ano em termos reais (já descontada a inflação) no período 2020-2023. Se a reforma não ocorrer, o espaço fiscal passará de R$ 151 bilhões neste ano para R$ 51 bilhões em 2023.
DOCUMENTO: http://www.ipea.gov.br/portal/images/stories/PDFs/conjuntura/190328_cc_42_visao_geral.pdf
ECONOMIA
FGV. IBRE. 28/03/19. Indicador de Incerteza da Economia. Indicador de Incerteza da Economia. Incerteza da Economia permanece acima da média histórica
O Indicador de Incerteza da Economia (IIE-Br) da Fundação Getulio Vargas recuou 2,1 pontos em março, para 109,2 pontos, permanecendo acima da média histórica.
“Apesar da queda, o indicador permanece acima da média histórica. A redução desse nível depende de um alinhamento do Congresso com o Governo na aprovação de reformas que são necessárias para a recuperação econômica” afirma a pesquisadora Raíra Marotta, da FGV IBRE
O recuo do IIE-Br foi influenciado por todos os seus componentes. O componente de Mídia recuou 2,2 pontos entre fevereiro e março de 2019, contribuindo com uma redução de 2,0 pontos no resultado agregado. O componente de Expectativa recuou 0,5 ponto no mesmo período, contribuindo com -0,1 ponto para o comportamento final do indicador.
DOCUMENTO: https://portalibre.fgv.br/navegacao-superior/noticias/noticias-1414.htm
POLÍTICA MONETÁRIA
BACEN. 27 março 2019. BC divulga Estatísticas Monetárias e de Crédito até fevereiro de 2019.
1. Operações de crédito
O saldo das operações de crédito do sistema financeiro nacional (SFN) totalizou R$3,2 trilhões em fevereiro, aumentando 0,3% no mês. As operações com pessoas físicas, saldo de R$1,8 trilhão, cresceram 0,4%, enquanto a carteira de pessoas jurídicas variou 0,1%, totalizando R$1,4 trilhão. Na comparação em doze meses, a carteira total de crédito do SFN cresceu 5,5%, composta por expansões de 9% no crédito para famílias e de 1,4% para empresas.
Nas operações com pessoas físicas, a carteira livre alcançou R$962 bilhões (crescimento de 0,4% no mês e de 12,2% em doze meses). No mês, destacaram-se as modalidades crédito pessoal e financiamentos de veículos. O saldo do crédito direcionado para famílias cresceu 0,5% no mês e 5,6% em doze meses, alcançando R$853 bilhões, com ênfase no crédito imobiliário com taxas reguladas.
O crédito livre para pessoas jurídicas atingiu R$791 bilhões, com crescimento de 0,6% no mês e de 10,6% em doze meses. Destacaram-se expansões em aquisição de veículos, antecipação de faturas de cartão e operações do comércio exterior (adiantamentos sobre contratos de câmbio e financiamentos a exportações). O crédito às empresas com recursos direcionados contraiu 0,6% no mês e 8% em doze meses, totalizando R$636 bilhões.
As concessões de crédito somaram R$304 bilhões em fevereiro, permanecendo estáveis no mês, com expansão das contratações com empresas, 4,2%, e retração às famílias, -2,9%. Em fevereiro, houve dois dias úteis a menos que em janeiro. No acumulado do ano, comparando com o mesmo período do ano anterior, as concessões totais cresceram 12,3%, sendo 12,9% para pessoas jurídicas e 11,9% para pessoas físicas. Utilizando-se a série dessazonalizada, as concessões totais cresceram 0,6% no mês, com expansão de 1,7% nas contratações com empresas e contração de 0,2% com famílias.
O Indicador de Custo do Crédito (ICC), média do custo de toda a carteira do SFN, atingiu 21,1% a.a. em fevereiro, com aumento de 0,2 p.p. no mês e diminuição de 0,6 p.p. em doze meses, repercutindo, na variação mensal, a elevação nas operações de crédito livre, 0,4 p.p., para 32,5%. No crédito livre não rotativo, o ICC permaneceu estável em 29,1%. O spread geral do ICC alcançou 14,4 p.p., elevação de 0,3 p.p. no mês e redução de 0,1 p.p. em doze meses.
A taxa média de juros das contratações em fevereiro alcançou 25% a.a., o que representou elevação de 0,3 p.p. no mês e redução de -1,8 p.p. em doze meses. A elevação mensal refletiu aumento no custo das operações livres com pessoas físicas, 1,9 p.p., atingindo 53,2% a.a., com aumentos nas modalidades cheque especial (2,3 p.p.), crédito não consignado (6,1 p.p.), cartão rotativo (8,6 p.p.) e parcelado (7,4 p.p.). No crédito livre a empresas, a taxa de juros das contratações reduziu-se em 0,7 p.p. no mês, alcançando 19,7% a.a., destacando-se a redução nas operações de capital de giro, 0,8 p.p.
A taxa de juros do crédito livre, excluindo-se as operações rotativas, situou-se em 29,3%, com aumento de 0,5 p.p. no mês e redução de 1,4 p.p. em doze meses.
O spread bancário referente às contratações totais do mês atingiu 19 p.p., o que representou ampliação de 0,4 p.p. no mês, enquanto houve declínio de 1,4 p.p. na comparação com o mesmo mês do ano anterior.
2. Agregados monetários
A base monetária alcançou R$290,1 bilhões em fevereiro, aumento de 4% no mês (e de 9,7% em doze meses), refletindo elevação de 30,1% nas reservas bancárias, enquanto o saldo do papel moeda emitido permaneceu praticamente estável, variação de -0,1% no mês. Entre os fluxos mensais dos fatores condicionantes da base monetária, destacaram-se os impactos expansionistas das operações com títulos públicos federais (R$10,3 bilhões, com compras líquidas de R$43,9 bilhões no mercado secundário e colocações líquidas de R$33,6 bilhões no mercado primário), dos depósitos de instituições financeiras, compreendendo as variações nos saldos de recolhimentos compulsórios (R$8,9 bilhões) e das operações do setor externo (R$6,1 bilhões), que refletem, especialmente, a recompra de divisas no mercado interbancário a termo. Em contrapartida aos fatores expansionistas, as operações do Tesouro Nacional provocaram contração de R$13,6 bilhões na base monetária em fevereiro.
Os meios de pagamento restritos (M1) totalizaram R$372,4 bilhões em fevereiro, crescimento de 0,8% no mês, acompanhando o saldo de depósitos à vista, 2,7%, enquanto o estoque do papel moeda em poder do público reduziu-se 0,8% no mês. O M2 totalizou R$2,8 trilhões, com expansão mensal de 0,3%. Esse resultado refletiu os crescimentos do M1 e de 0,4% nos títulos privados (saldo de R$1,6 trilhão). O saldo dos depósitos de poupança recuou 0,2%, para R$791,3 bilhões. No mês, ocorreram resgates líquidos de R$4,5 bilhões nos depósitos de poupança e captações líquidas de R$14,1 bilhões nos depósitos a prazo. O M3 cresceu 0,3%, situando-se em R$6,3 trilhões, com elevação de 0,5% nas quotas de fundos monetários (saldo de R$3,3 trilhões). O M4 aumentou 0,5% no mês e 8,2% nos últimos doze meses, totalizando R$6,7 trilhões, com crescimento de 4% no estoque de títulos federais adquiridos em operações definitivas pelo público não financeiro.
DOCUMENTO: https://www.bcb.gov.br/content/estatisticas/Documents/Estatisticas_mensais/Monetaria_credito/Nota%20para%20a%20imprensa%20-%20Estat%C3%ADsticas%20Monet%C3%A1rias%20e%20de%20Cr%C3%A9dito.pdf
CONTAS PÚBLICA
MEconomia. STN. 27/03/2019. Contas públicas. Estoque da dívida pública federal totalizou R$ 3,874 trilhões em fevereiro. Resultado indica aumento de 1,71% em termos nominais; não residentes ampliaram participação
O Tesouro Nacional divulgou nesta quarta-feira (27) o Relatório Mensal da Dívida Pública Federal (DPF) do mês fevereiro. O estoque da DPF apresentou aumento, em termos nominais, de 1,71%, passando de R$ 3,808 trilhões em janeiro para R$ 3,873 trilhões.
A Dívida Pública Mobiliária Federal Interna (DPMFi) teve seu estoque ampliado em 1,69%, passando de R$ 3,669 trilhões para R$ 3,732 trilhões. O acréscimo é devido à emissão líquida de R$ 36,5 bilhões e apropriação positiva de juros no valor de R$ 25,91 bilhões.
Figura: Emissões e resgates da Dívida Mobiliária Federal Interna (DPMFi)

Fonte: Relatório Mensal da Dívida Pública Federal (DPF) – Fevereiro de 2019 da Secretaria do Tesouro Nacional
Em fevereiro, as emissões da DPMFi alcançaram R$ 55,14 bilhões, sendo R$ 25,67 bilhões em títulos com remuneração prefixada, R$ 7,86 bilhões remunerados por índice de preços e R$ 21,61 bilhões em títulos indexados a taxa flutuante. Desse total, foram emitidos R$ 51,95 bilhões nos leilões tradicionais, R$ 850 milhões em leilão de troca, R$ 2,30 bilhões relativos às vendas de títulos do Programa Tesouro Direto e R$ 30 milhões relativos às emissões diretas.
Segundo o coordenador-geral de Operações da Dívida Pública, Luis Felipe Vital, de modo geral “no mês de fevereiro, o mercado externo teve tom positivo, marcado por redução de volatilidade e melhora na percepção não apenas do risco-Brasil, mas também de países comparáveis, como México e Colômbia. Já o mercado doméstico, em fevereiro, foi marcado por relativa estabilidade”.
Com relação ao estoque da Dívida Pública Federal externa (DPFe), houve aumento de 2,24% sobre o apurado em janeiro, encerrando o mês de fevereiro em R$ 141,92 bilhões. Desse total, R$ 127,75 bilhões são referentes à dívida mobiliária e R$ 14,17 bilhões à dívida contratual.
Detentores
Os não-residentes apresentaram aumento de R$ 21,49 bilhões no estoque, o que elevou a participação relativa desse grupo de 11,80% para 12,18%. O grupo Governo teve uma participação relativa de 4,12%. O estoque das Seguradoras encerrou o mês em R$ 156,18 bilhões.
No grupo Previdência, houve variação negativa de estoque, que passou de R$ 918 bilhões para R$ 916,38 bilhões. Instituições financeiras aumentaram o estoque em R$ 17,21 bilhões, atingindo R$ 824,68 bilhões no mês. O grupo Fundos de Investimento também aumentou o estoque, de R$ 992,95 bilhões para R$ 1,016 trilhão.
Figura: Participação relativa dos detentores da Dívida Mobiliária Federal Interna (DPMFi)

Fonte: Relatório Mensal da Dívida Pública Federal (DPF) – Fevereiro de 2019 da Secretaria do Tesouro Nacional
Tesouro Direto
O maior destaque no mês vai para o índice de operações cujo valor é inferior ou igual a mil reais, que foi de 65% em fevereiro. Esta fração de praticamente dois terços corresponde à maior participação dessa modalidade de operação em toda a série histórica. “Essa é mais uma prova de que o Tesouro Direto tem caminhado em direção ao seu maior objetivo, que é justamente a democratização do acesso ao investimento”, comentou Luis Felipe Vital.
As operações de até R$ 5 mil reais corresponderam a 85% do total. Pelo segundo mês consecutivo, o número de novos investidores ativos — isto é, que efetivamente realizaram operação já no primeiro mês de participação no programa — superou a marca de 50 mil, totalizando 51.161 novos investidores ativos. O total de investidores cadastrados chegou a 3.590.394, o que representa incremento de 80,86% em relação a fevereiro de 2018.
As emissões do Tesouro Direto em fevereiro atingiram R$ 2,304 bilhões, enquanto os resgates corresponderam a R$ 1,590 bilhão, o que resultou em emissão líquida de R$ 714,42 milhões. O título mais demandado pelos investidores foi o Tesouro Selic, que representou 45,70% do montante vendido.
Já no mês de março, o destaque foi a emissão do título ‘Global 2029’ em volume equivalente a um bilhão de meio de dólares estadunidenses e cujo vencimento se dará em 30 de maio de 2029.
Perspectiva
Em sua avaliação, Vital destacou o tom misto que tem marcado o mercado no mês de março. Afirmou que, apesar do aumento da preocupação com a desaceleração do crescimento global, principalmente nos continentes europeu e asiático, a sinalização de que o Banco Central dos Estados Unidos passará mais tempo sem aumentar a taxa de juros tende a ser positiva para mercados emergentes.
Especificamente quanto ao mercado doméstico, Vital afirmou que são esperadas oscilações ao longo do mês de março, “porém, nada fora do padrão de normalidade”.
- Relatório: http://www.tesouro.fazenda.gov.br/documents/10180/749053/Texto_RMD_Fev_19.pdf/6cbf5e1a-6240-49ad-b7e3-6761efcd9f4d
- Apresentação: http://www.tesouro.fazenda.gov.br/documents/10180/749053/Apresenta%EF%BF%BD%EF%BF%BDo-RMD_GEEST.pdf/45902471-2958-4726-b05c-aa92a4751678
MEconomia. STN. PORTAL G1. 28/03/2019. Contas do governo registram rombo de R$ 18,27 bilhões em fevereiro. Déficit apresentou pequena queda frente ao mesmo período de 2018, e foi o melhor resultado para fevereiro em quatro anos. Previdência registrou rombo de R$ 14,229 bilhões no mês.
Por Alexandro Martello, G1 — Brasília
A Secretaria do Tesouro Nacional informou nesta quinta-feira (28) que as contas do governo registraram déficit primário de R$ 18,274 bilhões em fevereiro.
Quando as despesas do governo superam as receitas com impostos e contribuições, o resultado é deficitário. Quando acontece o contrário, há superávit. O conceito "primário" não engloba os gastos com juros da dívida pública.
O resultado de fevereiro representa pequena melhora frente ao mesmo período do ano passado, quando foi registrado um déficit primário de R$ 19,218 bilhões. Embora negativo, trata-se, também, do melhor resultado para o mês desde 2015.
Contas do governo
Para meses de fevereiro, em R$ bilhões
2018
-19.218
-19.218
Fonte: Tesouro Nacional
Ao todo, segundo o Tesouro, as receitas (após transferências aos estados e municípios) somaram R$ 85,367 bilhões no mês passado – alta real de 5% na comparação com fevereiro de 2018 –, e as despesas, R$ 103,641 bilhões – aumento real de 2,3% na mesma comparação.
Primeiro bimestre e meta fiscal
No acumulado do primeiro bimestre deste ano, as contas do governo apresentaram superávit primário (receitas maiores do que despesas, sem contar juros da dívida) de R$ 11,772 bilhões, valor próximo ao resultado positivo do mesmo período de 2018, que somou R$ 11,624 bilhões.
Para o ano de 2019, o governo busca atingir a meta fiscal, que prevê rombo de até R$ 139 bilhões nas contas públicas. Para isso, bloqueou cerca de R$ 30 bilhões em gastos – o que, segundo analistas, pode comprometer a prestação de serviços públicos para a população.
No ano passado, as contas do governo registraram déficit primário de R$ 120 bilhões, quinto ano seguido de rombo nas contas públicas.
Rombo da Previdência
De acordo com a Secretaria do Tesouro Nacional, o déficit nas conta do Instituto Nacional do Seguro Social (INSS), sistema público que atende aos trabalhadores do setor privado, somou R$ 14,229 bilhões em fevereiro (alta de 3,8% na comparação com o mesmo mês do ano passado).
Na parcial do primeiro bimestre deste ano, o resultado negativo somou R$ 28,885 bilhões, com queda de 1% frente ao mesmo período de 2018, quando totalizou R$ 29,186 bilhões.
Para este ano, a estimativa do governo é que as contas do INSS registrem resultado negativo de R$ 218 bilhões. No ano passado, o déficit foi de R$ 195 bilhões.
Em razão dos seguidos déficits bilionários, o governo enviou ao Congresso uma proposta de reforma da Previdência. Entre outros pontos, o texto prevê idade mínima de 65 anos para homens e de 62 para mulheres poderem se aposentar.
Concessões e subsídios
Segundo o governo, as receitas com concessões somaram R$ 142 milhões em fevereiro deste ano, contra R$ 136 milhões no mesmo mês de 2018. No primeiro bimestre de 2019, somaram R$ 639 milhões, contra R$ 560 milhões no mesmo período do ano passado.
No caso dos subsídios e subvenções, houve queda. Em fevereiro de 2019, somaram R$ 127 milhões, contra R$ 188 milhões no mesmo mês do último ano. No primeiro bimestre deste ano, totalizaram R$ 4,798 bilhões, com queda de 23% na comparação com o mesmo período de 2018 (R$ 6,233 bilhões).
MEconomia. STN. PORTAL G1. 28/03/2019. Estimativa do Tesouro aponta que carga tributária subiu para 33,5% do PIB em 2018, maior em 9 anos. Valor oficial da carga tributária será divulgado pela Receita Federal somente no segundo semestre deste ano. Divulgação atende determinação da Controladoria-Geral da União.
Por Alexandro Martello, G1 — Brasília
Estimativa da Secretaria do Tesouro Nacional aponta que a carga tributária brasileira, que é o patamar de impostos pagos em relação à riqueza do país, cresceu em 2018 e atingiu 33,58% do Produto Interno Bruto (PIB).
Em 2017, a carga tributária, estimada pelo órgão, havia ficado em 32,62% do PIB. Trata-se do maior patamar desde o início da série histórica do Tesouro Nacional, que começa em 2010. Ou seja, é o maior nível em nove anos.
CARGA TRIBUTÁRIA DO BRASIL
ESTIMATIVAS DO TESOURO NACIONAL - EM % DO PIB
2013
● : 32,62
● : 32,62
Fonte: TESOURO NACIONAL
A carga tributária oficial do ano passado, porém, só vai ser conhecida no segundo semestre deste ano, quando for divulgada pela Secretaria da Receita Federal.
A divulgação dessa estimativa, pelo Tesouro Nacional, atende à uma determinação da Controladoria Geral da União, que precisa utilizá-la na prestação das contas do presidente da República - que, por sua vez, será avaliada pelo Tribunal de Contas da União e pelo Congresso Nacional.
O secretário do Tesouro Nacional, Mansueto Almeida, observou que a carga tributária brasileira é alta na comparação com os países da América Latina, cerca de 10 ponto do PIB acima da média da região. "A carga tributária muito alta para o nosso nível de desenvolvimento", declarou ele.
/i.s3.glbimg.com/v1/AUTH_59edd422c0c84a879bd37670ae4f538a/internal_photos/bs/2019/2/x/rFVZs5SgmM19sXXpPTmw/cargatributaria-tesouro2018.jpg)
Segundo Mansueto, à medida que o país fica rico, aumenta a sua capacidade de tributar. Ele lembrou que a carga tributária é elevada no Brasil por conta do alto nível de despesas. "A carga cresce de acordo com o nível de desenvolvimento. A produtividade do trabalhador é muito maior em países desenvolvidos do que o Brasil", declarou.
- A carga tributária somente da União somou 22,66% do PIB no ano passado, contra 22,13% do PIB em 2017 e 22,08% do PIB em 2016
- No caso dos estados, a carga tributária, estimada pelo órgão, somou 8,65% do PIB em 2018, em comparação com 8,42% em 2017 e 8,22% do PIB em 2016
- Os municípios, por sua vez, tiveram sua carga estimada em 2,27% do PIB em 2018, contra 2,06% do PIB em 2017 e 2% do PIB em 2016
INFLAÇÃO
BACEN. 28 março 2019. BC divulga o Relatório Trimestral de Inflação do primeiro trimestre de 2019.
Introdução
O relatório de inflação apresenta as diretrizes das políticas adotadas pelo Copom para cumprir o seu trabalho, considerações acerca da evolução recente do cenário econômico e previsões para a inflação. As projeções para a inflação são apresentadas em cenários com condicionantes para algumas variáveis econômicas. Tradicionalmente, os condicionantes referem-se às trajetórias da taxa de câmbio e da taxa do Sistema Especial de Liquidação e de Custódia (Selic) ao longo do horizonte de projeção. Essas trajetórias normalmente são oriundas das expectativas coletadas pela pesquisa Focus, realizada pelo BC com analistas independentes.
Sumário Executivo
A economia brasileira segue em processo de recuperação gradual. Embora mostrando arrefecimento, o Produto Interno Bruto (PIB) cresceu no quarto trimestre de 2018, em relação ao trimestre anterior, pelo oitavo período consecutivo nessa base de comparação. Pelo lado da oferta, destacou-se o desempenho do setor de serviços, que compensou a retração na atividade industrial. Do lado da demanda, houve expansão do consumo das famílias, que contrastou com recuos no consumo do governo e na Formação Bruta de Capital Fixo (FBCF).
O menor crescimento da atividade no último trimestre de 2018 diminuiu o carregamento estatístico para o ano corrente e concorreu para que a projeção de crescimento do PIB em 2019 fosse reduzida para 2,0% ante 2,4% apresentado na edição anterior do Relatório de Inflação.
A economia segue operando com elevado nível de ociosidade dos fatores de produção, refletido nos baixos índices de utilização da capacidade da indústria e, principalmente, na taxa de desemprego.
O cenário externo permanece desafiador. Por um lado, os riscos associados à normalização das taxas de juros em algumas economias avançadas recuaram. Por outro lado, os riscos associados a uma desaceleração da economia global, em função de diversas incertezas, mostram-se mais elevados.
Não obstante, a economia brasileira apresenta maior capacidade de absorver eventual revés no cenário internacional, devido ao seu balanço de pagamentos robusto, à ancoragem das expectativas de inflação e à perspectiva de recuperação econômica.
As expectativas de inflação para 2019, 2020 e 2021 apuradas pela pesquisa Focus encontram-se em torno de 3,9%, 4,0% e 3,75%, respectivamente.
O Copom avalia que diversas medidas de inflação subjacente se encontram em níveis apropriados ou confortáveis, inclusive os componentes mais sensíveis ao ciclo econômico e à política monetária.
No que se refere às projeções condicionais de inflação, no cenário com trajetórias para as taxas de juros e câmbio extraídas da pesquisa Focus, as projeções do Copom situam-se em torno de 3,9% para 2019 e 3,8% para 2020. Esse cenário supõe trajetória de taxa Selic que encerra 2019 em 6,50% a.a. e se eleva a 7,75% a.a. em 2020. Também supõe trajetória para a taxa de câmbio que termina 2019 em R$3,70/US$ e 2020 em R$3,75/US$. No cenário com taxa Selic constante a 6,50% a.a. e taxa de câmbio constante a R$3,85/US$, as projeções situam-se em torno de 4,1% para 2019 e 4,0% para 2020.
As projeções apresentadas utilizam o conjunto de informações disponíveis até a última reunião do Copom, realizada em 19 e 20.3.2019 (221ª reunião). Para os condicionantes utilizados nas projeções, em especial os advindos da pesquisa Focus, realizada pelo Banco Central do Brasil, a data de corte é 15.3.2019, a menos de indicação contrária.
Em sua reunião mais recente (221ª reunião), o Copom decidiu, por unanimidade, pela manutenção da taxa básica de juros em 6,50% a.a. O Comitê entende que essa decisão reflete seu cenário básico e balanço de riscos para a inflação prospectiva e é compatível com a convergência da inflação para a meta no horizonte relevante para a condução da política monetária, que inclui o ano-calendário de 2019 e, com peso gradualmente crescente, de 2020.
Na ocasião, o Copom comunicou que, em seu cenário básico para a inflação, permanecem fatores de risco em ambas as direções. Por um lado, (i) o nível de ociosidade elevado pode produzir trajetória prospectiva abaixo do esperado. Por outro lado, (ii) uma frustração das expectativas sobre a continuidade das reformas e ajustes necessários na economia brasileira pode afetar prêmios de risco e elevar a trajetória da inflação no horizonte relevante para a política monetária. O risco (ii) se intensifica no caso de (iii) deterioração do cenário externo para economias emergentes. O Comitê avalia que o balanço de riscos para a inflação mostrase simétrico.
O Copom reitera que a conjuntura econômica prescreve política monetária estimulativa, ou seja, com taxas de juros abaixo da taxa estrutural.
O Comitê enfatiza que a continuidade do processo de reformas e ajustes necessários na economia brasileira é essencial para a manutenção da inflação baixa no médio e longo prazos, para a queda da taxa de juros estrutural e para a recuperação sustentável da economia. O Comitê ressalta ainda que a percepção de continuidade da agenda de reformas afeta as expectativas e projeções macroeconômicas
correntes.
Na avaliação do Copom, a evolução do cenário básico e do balanço de riscos prescreve manutenção da taxa Selic no nível vigente. O Comitê julga importante observar o comportamento da economia brasileira ao longo do tempo, com menor grau de incerteza e livre dos efeitos dos diversos choques a que foi submetida no ano passado. O Copom considera que esta avaliação demanda tempo e não deverá ser concluída a curto prazo. O Comitê ressalta que os próximos passos da política monetária continuarão dependendo da evolução da atividade econômica, do balanço de riscos e das projeções e expectativas de inflação.
O Copom avalia que cautela, serenidade e perseverança nas decisões de política monetária, inclusive diante de cenários voláteis, têm sido úteis na perseguição de seu objetivo precípuo de manter a trajetória da inflação em direção às metas.
DOCUMENTO: https://www.bcb.gov.br/publicacoes/ri
APRESENTAÇÃO: https://www.bcb.gov.br/conteudo/home-ptbr/TextosApresentacoes/Apresentacao_Carlaos_Viana_RI_28032019.pdf
FGV. IBRE. 28/03/19. Índices Gerais de Preços. IGP-M. IGP-M avança para 1,26% em março
O Índice Geral de Preços – Mercado (IGP-M) subiu 1,26% em março, percentual superior ao apurado em fevereiro, quando variou 0,88%. Com este resultado, o IGP-M acumulada alta de 2,16% no ano e de 8,27% nos últimos 12 meses. Em março de 2018, o índice havia subido 0,64% no mês e acumulava alta de 0,20% em 12 meses.
O Índice de Preços ao Produtor Amplo (IPA) subiu 1,67% em março, após alta de 1,22% em fevereiro. Na análise por estágios de processamento, a taxa do grupo Bens Finais variou 1,93% em março, contra 1,19% no mês anterior. A principal contribuição para este resultado partiu do subgrupo combustíveis para o consumo, cuja taxa de variação passou de -0,04% para 9,11%, no mesmo período. O índice relativo a Bens Finais (ex), que exclui os subgrupos alimentos in natura e combustíveis para o consumo, subiu 0,06% em março, ante queda de 0,12% no mês anterior.
A taxa de variação do grupo Bens Intermediários passou de -0,35% em fevereiro para 0,87% em março. O principal responsável por este movimento foi o subgrupo materiais e componentes para a manufatura, cujo percentual passou de -1,12% para -0,02%. O índice de Bens Intermediários (ex), obtido após a exclusão do subgrupo combustíveis e lubrificantes para a produção, variou -0,03% em março, contra -0,81% em fevereiro.
O índice do grupo Matérias-Primas Brutas desacelerou passando de 3,23% em fevereiro para 2,33% em março. Contribuíram para o recuo da taxa do grupo os seguintes itens: minério de ferro (11,98% para 2,94%), leite in natura (8,63% para 3,10%) e cana-de-açúcar (1,76% para -0,05%). Em sentido oposto, destacam-se os itens soja (em grão) (-2,04% para 2,25%), aves (0,32% para 7,66%) e bovinos (-0,72% para 1,31%).
O Índice de Preços ao Consumidor (IPC) subiu 0,58% em março, ante 0,26% em fevereiro. Cinco das oito classes de despesa componentes do índice registraram avanço em suas taxas de variação. A principal contribuição partiu do grupo Transportes (0,00% para 0,82%). Nesta classe de despesa, vale citar o comportamento do item gasolina, cuja taxa passou -2,98% para 1,30%.
Também apresentaram avanço em suas taxas de variação os grupos Alimentação (0,65% para 1,09%), Vestuário (-0,66% para 0,38%), Educação, Leitura e Recreação (-0,16% para 0,11%) e Saúde e Cuidados Pessoais (0,29% para 0,45%). As principais influências para a aceleração dos grupos partiram dos seguintes itens: hortaliças e legumes (-0,33% para 12,35%), roupas (-0,94% para 0,51%), show musical (-7,51% para 3,56%) e artigos de higiene e cuidado pessoal (-0,46% para 0,77%).
Em contrapartida, os grupos Despesas Diversas (0,20% para -0,10%), Habitação (0,37% para 0,31%) e Comunicação (0,24% para 0,21%) apresentaram decréscimo em suas taxas de variação. Nestas classes de despesa, os maiores recuos foram observados nos itens cigarros (0,00% para -0,49%), tarifa de eletricidade residencial (1,01% para 0,80%) e tarifa de telefone residencial (-0,09% para -0,47%).
O Índice Nacional de Custo da Construção (INCC) permaneceu estável em março, repetindo a taxa do mês anterior, que foi de 0,19%. Os três grupos componentes do INCC registraram as seguintes variações na passagem de fevereiro para março: Materiais e Equipamentos (0,23% para 0,38%), Serviços (0,86% para 0,52%) e Mão de Obra (0,05% para 0,00%).
DOCUMENTO: https://portalibre.fgv.br/navegacao-superior/noticias/noticias-1412.htm
COMÉRCIO VAREJISTA
FGV. IBRE. 28/03/19. Sondagens e Índices de Confiança. Sondagem do Comércio. Confiança do Comércio recua e atinge menor nível desde outubro de 2018
O Índice de Confiança do Comércio (ICOM) da Fundação Getulio Vargas recuou 3,2 pontos em março, ao passar de 100,0 para 96,8 pontos, menor valor desde outubro de 2018 (94,4 pontos). O índice acumula uma perda de 8,3 pontos nos últimos três meses, 53% da recuperação do setor no período entre outubro e dezembro de 2018. Em médias móveis trimestrais, o indicador cedeu 2,8 pontos, após de seis meses de altas consecutivas.
“Os primeiros resultados da confiança do comércio em 2019 sugerem certa frustração e cautela dos empresários com o andamento do ritmo das vendas. As quedas dos índices, tanto de situação atual quanto de expectativas, reforçam o cenário de lenta recuperação do setor influenciado pelo elevado nível de incerteza e do arrefecimento da confiança dos consumidores ”, avalia Rodolpho Tobler, Coordenador da Sondagem do Comércio da FGV IBRE.
Em março, a confiança caiu em 9 dos 13 segmentos e foi influenciada tanto pela piora da percepção dos empresários com relação ao momento presente quanto das expectativas. O Índice de Situação Atual (ISA-COM) caiu 4,2 pontos, para 89,0 pontos, menor valor desde maio de 2018 (88,9). Já o Índice de Expectativas (IE-COM), recuou 2,2 pontos, ao passar de 106,8 pontos para 104,6 pontos, patamar próximo ao observado em novembro de 2018 (104,8).
Resultado trimestral
Com os resultados de março, o Índice de Confiança do Comércio (ICOM) médio do trimestre voltou a fechar em alta em relação ao trimestre anterior, porém em ritmo muito abaixo do observado ao final de 2018. Vale ressaltar que a alta no trimestre decorre apenas da melhora do Índice de Expectativas. A queda do ISA-COM no trimestre e a recente calibragem nas expectativas sugerem que o ritmo de vendas não tenha ocorrido como era esperado para o 1º trimestre de 2019 e a velocidade da recuperação do setor deve se manter lenta.
A edição de março de 2019 coletou informações de 849 empresas entre os dias 1 e 26 deste mês.
A próxima divulgação da Sondagem do Comércio ocorrerá em 26 de abril de 2019.
DOCUMENTO: https://portalibre.fgv.br/navegacao-superior/noticias/noticias-1413.htm
COMÉRCIO INTERNACIONAL
EUA. OMC. BOEING. PORTAL G1. REUTERS. 28/03/2019. EUA ignoram pedido para retirar incentivos fiscais para Boeing, diz OMC. Disputa comercial já dura 15 anos; União Europeia diz que a empresa norte-americana continua a receber subsídios considerados ilegais.
A Organização Mundial do Comércio (OMC) informou nesta quinta-feira (28) que os Estados Unidos ignoraram um pedido para retirar os incentivos fiscais subsidiados concedidos à Boeing em Washington, à medida que essa disputa comercial transatlântica, que já dura 15 anos, se aproxima de sanções recíprocas.
A União Europeia (UE) disse que a decisão da OMC confirmou as alegações de que a Boeing continuava a receber subsídios considerados ilegais, mas os Estados Unidos disseram que apenas uma medida, uma redução de impostos no valor de cerca de US$ 100 milhões por ano, violava as regras.
EUA. CHINA. PORTAL G1. AFP. 28/03/2019. EUA e China retomam negociações comerciais em Pequim. Os dois países iniciam uma nova rodada de negociações para superar as tensões que afetam a economia mundial.
Estados Unidos e China iniciam nesta quinta-feira (28) uma nova rodada de negociações, em um novo esforço para superar as tensões comerciais que afetam a economia mundial.
O representante americano do Comércio, Robert Lighthizer, e o secretário do Tesouro, Steven Mnuchin, devem retomar as conversações, as primeiras desde que a China adotou medidas internas que foram interpretadas como um gesto de apoio ao esforço bilateral.
Embora o presidente americano Donald Trump tenha expressado recentemente a esperança de conseguir assinar em breve um acordo com o colega chinês Xi Jinping, as negociações se arrastam, sem chegar aos temas substanciais do desentendimento.
Por este motivo, Lighthizer reduziu as expectativas antes do encontro em Pequim, que terá na sequência novas conversações em abril em Washington.
"Se houver um grande acordo para assinar, nós faremos isso. Em caso contrário, vamos procurar outro plano ", disse durante a semana.
Tensão comercial
Os dois gigantes econômicos adotaram em 2018 reciprocamente tarifas de importação que alcançam bilhões de dólares, um duelo que afetou a indústria e a agricultura dos dois países, com efeitos colaterais para diversas outras economias.
Trump deu a entender que as tarifas adotadas por Washington poderiam ser mantidas mesmo no caso de um acordo, para verificar se a China cumpre com sua parte.
Pequim, no entanto, aprovou medidas para atender as reclamações americanas.
No início de março, o Parlamento chinês aprovou uma lei que protege as empresas estrangeiras da necessidade de transferir tecnologia, uma das principais queixas do governo dos Estados Unidos.
O primeiro-ministro chinês Li Keqiang reiterou nesta quinta-feira o compromisso de aumentar as sanções aos que violam a propriedade intelectual, um tema central na disputa com Washington.
/i.s3.glbimg.com/v1/AUTH_59edd422c0c84a879bd37670ae4f538a/internal_photos/bs/2018/f/R/gsrGdYRSOXDr5WqVJKFw/guerra-comercial.jpg)
_________________
LGCJ.: