US ECONOMICS
VENEZUELA
U.S. Department of State. October 12, 2017. Gubernatorial Elections in Venezuela. Statement. Heather Nauert. Department Spokesperson
Washington, DC - The Venezuelan people deserve to have their voices heard through their nation’s Gubernatorial Elections this Sunday, October 15. The United States and the international community are paying close attention to this vote. The United States calls on the regime to hold free and fair elections.
We note with great concern that the regime will not permit the presence of independent international electoral observers. We call on the Venezuelan government to permit independent domestic observers to fully monitor the election and its tabulation of results.
The United States is concerned that a series of actions by the National Electoral Council (CNE) calls into question the fairness of the electoral process. These concerns include CNE steps such as: closing voting centers in opposition strongholds; manipulating ballot layout; not providing for a complete, independent auditing of vote tabulation software; and a pattern of politically-motivated, arbitrary disqualifications of opposition leaders and candidates.
Just this week, for example, the CNE announced the closing or relocation of 203 polling stations in 16 states, typically in opposition-dominated areas, and potentially disenfranchising as many as 450,000 voters.
The United States also notes with deep concern the August 2, public denunciation by Smartmatic of “manipulation,” with more than one million “ghost” votes added to the results of the July 30, referendum. That balloting, which was boycotted by a majority of voters, paved the way for the establishment of an illegitimate Constituent Assembly.
We continue to support the Venezuelan people as they work toward a democratic, peaceful, and prosperous future.
________________
NAFTA
REUTERS. 13 DE OUTUBRO DE 2017. Autoridades de México e Canadá resistem à "cláusula de caducidade" no Nafta
CIDADE DO MÉXICO (Reuters) - Autoridades do México e do Canadá disseram nesta sexta-feira que a conversas em andamento para renegociar o Acordo de Livre Comércio da América do Norte (Nafta) não devem incluir a chamada “cláusula de caducidade” que forçaria uma renegociação do pacto de 1 trilhão de dólares a cada cinco anos.
O ministro da Economia do México, Ildefonso Guajardo, disse em um programa na televisão mexicana que o Nafta não deve exigir que seus membros (EUA, México e Canadá) refaçam o tratado a cada cinco anos ou o vejam desaparecer, conforme proposto por negociadores norte-americanos.
Guajardo acrescentou que, se os EUA optarem por abandonar o tratado, como o presidente Donald Trump tem ameaçado, México e Canadá ainda estariam sujeitos às regras do Nafta.
O ministro do Comércio Internacional do Canadá, François-Philippe Champagne, falando com Guajardo no mesmo programa de televisão, disse que uma cláusula de caducidade causaria certa incerteza.
Por Daina Beth Solomon
REUTERS. 13 DE OUTUBRO DE 2017. EUA querem incluir aço e alumínio em regras do Nafta para automóveis, dizem fontes
WASHINGTON (Reuters) - O governo Trump quer usar o Nafta para impulsionar os setores de aço e outras matérias-primas nos Estados Unidos, ao propor regras mais rígidas para o conteúdo de automóveis que exigem o uso de aço, alumínio, cobre e resinas de plástico produzidos nos EUA.
Três fontes que foram informadas sobre o assunto disseram que a proposta de regras de origem dos EUA colocaria estas matérias-primas em uma lista específica de peças automotivas do Acordo de Livre Comércio da América do Norte (Nafta) pela primeira vez.
A lista é usada para verificar o nível de conteúdo regional dos veículos e autopeças para que possam ser qualificados como embarques isentos de tarifas nos três países do Nafta, EUA, Canadá e México.
Por David Lawder
_________________
DoL. BLS. October 13, 2017. CONSUMER PRICE INDEX – SEPTEMBER 2017
The Consumer Price Index for All Urban Consumers (CPI-U) rose 0.5 percent in
September on a seasonally adjusted basis, the U.S. Bureau of Labor Statistics
reported today. Over the last 12 months, the all items index rose 2.2 percent.
The gasoline index increased 13.1 percent in September and accounted for about
three-fourths of the seasonally adjusted all items increase. Other major
energy component indexes were mixed, and the food index rose slightly.
The index for all items less food and energy increased 0.1 percent in
September. The shelter index continued to increase, and the indexes for motor
vehicle insurance, recreation, education, and wireless telephone services also
rose. These increases more than offset declines in the indexes for new
vehicles, household furnishings and operations, medical care, and used cars
and trucks.
The all items index rose 2.2 percent for the 12 months ending September; the
12-month change has been accelerating since it was 1.6 percent in June. The
12-month change in the index for all items less food and energy remained at
1.7 percent for the fifth month in a row. The energy index rose 10.1 percent
over the past 12 months, its largest 12-month increase since the period ending
March 2017. The food index increased 1.2 percent over the last year.
_________________________________________________________________________________
                              HURRICANE IRMA

Hurricane Irma had a small impact on data collection in September. Data collection
was affected in some areas in Florida.
_________________________________________________________________________________

Table A. Percent changes in CPI for All Urban Consumers (CPI-U): U.S. city average


                                  Seasonally adjusted changes from
                                          preceding month
                                                                          Un-
                                                                       adjusted
                                                                        12-mos.
                              Mar.  Apr.  May   June  July  Aug.  Sep.   ended
                              2017  2017  2017  2017  2017  2017  2017   Sep.
                                                                         2017


 All items..................   -.3    .2   -.1    .0    .1    .4    .5      2.2
  Food......................    .3    .2    .2    .0    .2    .1    .1      1.2
   Food at home.............    .5    .2    .1   -.1    .2   -.2    .0       .4
   Food away from home (1)..    .2    .2    .2    .0    .2    .3    .3      2.4
  Energy....................  -3.2   1.1  -2.7  -1.6   -.1   2.8   6.1     10.1
   Energy commodities.......  -6.0   1.3  -6.2  -2.7    .0   6.1  12.6     18.9
    Gasoline (all types)....  -6.2   1.2  -6.4  -2.8    .0   6.3  13.1     19.3
    Fuel oil (1)............   -.8   -.3  -2.8  -3.7  -2.0   2.9   8.2     15.6
   Energy services..........   -.3    .9    .7   -.5   -.2   -.1   -.2      2.2
    Electricity.............   -.1    .6    .3   -.6    .4    .0    .0      1.7
    Utility (piped) gas
       service..............   -.8   2.2   1.9   -.2  -2.3   -.5   -.8      3.8
  All items less food and
     energy.................   -.1    .1    .1    .1    .1    .2    .1      1.7
   Commodities less food and
      energy commodities....   -.3   -.2   -.3   -.1   -.1   -.1   -.2     -1.0
    New vehicles............   -.3   -.2   -.2   -.3   -.5    .0   -.4     -1.0
    Used cars and trucks....   -.9   -.5   -.2   -.7   -.5   -.2   -.2     -3.7
    Apparel.................   -.7   -.3   -.8   -.1    .3    .1   -.1      -.2
    Medical care commodities    .2   -.8    .4    .7   1.0   -.1   -.8      1.0
   Services less energy
      services..............   -.1    .1    .2    .2    .2    .4    .2      2.6
    Shelter.................    .1    .3    .2    .2    .1    .5    .3      3.2
    Transportation services     .4   -.2    .3    .2    .2    .4    .3      3.9
    Medical care services...    .1    .0   -.1    .3    .3    .2    .1      1.7

   1 Not seasonally adjusted.
FoodThe food index rose 0.1 percent in September, the same increase as in August. The
index for food away from home rose 0.3 percent, while the index for food at home
was unchanged in September after declining in August. Among the six major grocery
store food group indexes, there were three increases and three declines. The index
for nonalcoholic beverages increased 0.4 percent after falling 0.4 percent in
August. The indexes for cereals and bakery products and for other food at home
also increased in September.
The index for dairy and related products fell 0.6 percent in September following a
0.4-percent decline in August. The index for meats, poultry, fish and eggs also
continued to fall, declining 0.4 percent. The index for fruits and vegetables fell
0.2 percent, with the fresh vegetables index declining 0.8 percent, but the index
for fresh fruits rising 0.5 percent.
Over the last 12 months, the index for food at home rose 0.4 percent. The index
for fruits and vegetables rose 1.2 percent over the span, the largest increase
among the major grocery store food groups. The indexes for cereals and bakery
products and for dairy and related products both declined slightly over the last
12 months. The index for food away from home rose 2.4 percent over the last year.
Energy
The energy index increased 6.1 percent in September following a 2.8-percent
increase in August. The major factor in the increase was a 13.1-percent rise in
the gasoline index, the largest monthly increase since June 2009. (Before seasonal
adjustment, gasoline prices increased 10.6 percent in September.) The fuel oil
index also rose sharply, increasing 8.2 percent. However, the electricity index
was unchanged and the index for natural gas declined 0.8 percent.
The gasoline index increased 19.3 percent over the last 12 months. The other
energy component indexes also rose over the past year, with the index for natural
gas rising 3.8 percent and the index for electricity increasing 1.7 percent.
All items less food and energy
The index for all items less food and energy increased 0.1 percent in September
following a 0.2-percent rise in August. The shelter index rose 0.3 percent in
September following a 0.5-percent increase in August. The indexes for rent and
owners' equivalent rent both rose 0.2 percent, while the index for lodging away
from home increased 1.5 percent.
The motor vehicle insurance index rose 0.5 percent in September; it has declined
only once in the last 23 months. The education index increased 0.3 percent, and
the index for recreation rose 0.2 percent. The index for wireless telephone
services rose 0.4 percent in September, ending a streak of 14 consecutive
declines. The indexes for alcoholic beverages, personal care, and tobacco also
increased in September.
The index for new vehicles, which was unchanged in August, fell 0.4 percent in
September. The index for household furnishings and operations declined 0.3
percent, and the index for used cars and trucks continued to fall, declining 0.2
percent. The medical care index fell slightly in September, declining 0.1 percent
as declines in the indexes for prescription and nonprescription drugs outweighed
increases in medical care service indexes. The apparel index declined 0.1 percent
in September.
The index for all items less food and energy rose 1.7 percent over the past 12
months. The shelter index rose 3.2 percent over that span, and the index for
medical care increased 1.6 percent. The index for new vehicles fell 1.0 percent
over the last 12 months, its largest 12-month decline since the period ending
February 2009.
Not seasonally adjusted CPI measures
The Consumer Price Index for All Urban Consumers (CPI-U) increased 2.2 percent
over the last 12 months to an index level of 246.819 (1982-84=100). For the month,
the index increased 0.5 percent prior to seasonal adjustment.
The Consumer Price Index for Urban Wage Earners and Clerical Workers (CPI-W)
increased 2.3 percent over the last 12 months to an index level of 240.939
(1982-84=100). For the month, the index increased 0.6 percent prior to seasonal
adjustment.
The Chained Consumer Price Index for All Urban Consumers (C-CPI-U) increased 2.2
percent over the last 12 months. For the month, the index increased 0.6 percent
on a not seasonally adjusted basis. Please note that the indexes for the past 10
to 12 months are subject to revision.
FULL DOCUMENT: https://www.bls.gov/news.release/pdf/cpi.pdf
FED. October 12, 2017. Speech. Rethinking Monetary Policy in a New Normal. Governor Lael Brainard. At the Panel on Monetary Policy "Rethinking Macroeconomic Policy," a conference sponsored by the Peterson Institute for International Economics, Washington D.C.
I enjoyed Ben Bernanke's paper titled "Monetary Policy in a New Era."1 He presents a compelling diagnosis of the issues facing policymakers and discusses a variety of policy options. Bernanke proposes an approach to policy that is elegant and straightforward to communicate. I will focus on those elements that I find particularly relevant for the challenges faced by policymakers and suggest some implications and complications. My comments are not intended to address current policy.2
The New Normal
Policymakers in advanced economies are confronting a different constellation of challenges today than those that dominated the canon of U.S. monetary policymaking over the previous half-century, which I refer to as the "new normal."3 A key feature of the new normal is that the neutral interest rate--the level of the federal funds rate that is consistent with the economy growing close to its potential rate, full employment, and stable inflation--appears to be much lower than it was in the decades prior to the crisis. In the Federal Open Market Committee's (FOMC) most recent Summary of Economic Projections (SEP), the median FOMC participant expected a longer-run real federal funds rate, after subtracting inflation, of 3/4 percent, down sharply from the value the first time the policy projection was published in the January 2012 SEP of 2-1/4 percent--and the average value in the decades prior to the financial crisis of 2-1/2 percent.4
The low level of the neutral rate limits the amount of space available for cutting the federal funds rate to offset adverse developments and thereby can be expected to increase the frequency and duration of periods when the policy rate is constrained by the effective lower bound, unemployment is elevated, and inflation is below target. In this environment, frequent or extended periods of low inflation run the risk of pulling down private-sector inflation expectations, which could amplify the degree and persistence of shortfalls of inflation, thereby making future lower bound episodes even more challenging in terms of output and employment losses. To the extent it is weighing on longer-run inflation expectations, the persistently low level of the neutral federal funds rate may be a factor contributing to the persistent shortfall of U.S. inflation from the FOMC's target.5
Further complicating the ability of central banks to achieve their inflation objectives in today's new normal is the very flat Phillips curve observed in the United States and many other advanced economies, which makes the relationship between labor market conditions and price inflation more tenuous. For instance, inflation has remained stubbornly below the FOMC's 2 percent target for the past five years even as unemployment has fallen from 8.2 percent to 4.2 percent, a level that most experts believe is in the vicinity of full employment.6
Bernanke's paper provides an excellent review of the Federal Reserve's efforts to operate in this new environment and makes some interesting new proposals. Reflecting on the Fed's available "policy toolbox," Bernanke concludes that the available tools are not likely to be sufficient and proposes a framework that relies on forward guidance with commitment to help central banks achieve their inflation and employment objectives.
The Makeup Principle
The academic literature on monetary policy suggests a variety of prescriptions for preventing a lower neutral rate of interest from eroding longer-run inflation expectations. The paper argues convincingly that many of these proposals present practical difficulties that would create a very high bar for their adoption. For instance, raising the inflation target sufficiently to provide meaningfully greater policy space could engender public discomfort or, at the other extreme, risk unmooring inflation expectations. The transition to a notably higher target is likely to be challenging and could heighten uncertainty.
As I have noted previously, the persistence of the shortfall in inflation from our objective is an important consideration for monetary policy.7 The makeup principle, in which policy would make up for past misses of the inflation target, is not reflected in most standard monetary policy frameworks, although it is an important precept in theory.8 Some of the proposals that have been advanced to implement this principle present some difficulties. For example, while price-level targeting would be helpful in the aftermath of a recession that puts the economy at the effective lower bound, it could require tightening into a negative supply shock, which is a very unattractive feature, as Bernanke points out.9
Bernanke proposes a framework that avoids this undesirable possibility by implementing a temporary price-level targeting framework only in periods where conventional policy is constrained by the lower bound. Bernanke's proposal thus has the advantage of maintaining standard practice in normal times while proposing a makeup policy in periods when the policy rate is limited by the lower bound and inflation is below target. His proposed temporary price-level target would delay the liftoff of the policy rate from the lower bound until the average inflation over the entire lower bound episode has reached 2 percent and full employment is achieved. This type of policy, which would result in temporary overshooting of the inflation target in order to make up for the previous period of undershooting, is designed to, in Bernanke's words, "calibrate the vigor of the policy response...to the severity of the episode."
The Normalization Bias
The proposed temporary price-level targeting policy is designed to address what I see as one of the key challenges facing policymakers. Following deep recessions of the type we experienced in 2008-09, there appears to be an important premium on "normalization." This was apparent in 2010, for instance, when there was substantial pressure among Group of Twenty officials to commit to timelines and targets for reducing fiscal support and to articulate exit principles for monetary policy.10 This inclination proved premature, as was evident from the subsequent intensification of the euro-area crisis.
Moreover, the benchmark for "normal" tends to be defined in terms of pre-crisis standards that involved policy settings well away from the lower bound, at least initially, because it may take some time to learn about important changes in underlying financial and economic relationships. For example, the factors underlying what we now understand to be the new normal of persistently low interest rates were in many cases initially viewed as temporary headwinds. In these circumstances, a standard policy framework calibrated around the pre-crisis or "old" normal may be biased to underachieving the inflation target in a low neutral rate environment. The kind of policy framework that Bernanke proposes, which pre-commits to implementing the makeup principle based on the actual observed performance of inflation during a lower bound episode, could guard against premature liftoff and help prevent the erosion of longer-term inflation expectations.
Monetary policymakers operate in an environment of considerable uncertainty and therefore have to weigh the risks of tightening too little or too late against those of tightening too much or too soon. While past experience has conditioned U.S. policymakers to be highly attentive to the risks associated with a breakout of inflation to the upside, as in the 1970s, they balance these risks against those associated with undershooting the inflation target persistently, as in Japan in the late 1990s and the 2000s.
In weighing these risks, the standard approach is typically designed to achieve "convergence from below," in which inflation gradually rises to its target. Given the lags in the effects of monetary policy, convergence from below would necessitate raising interest rates preemptively, well in advance of inflation reaching its target. Moreover, particularly in the early stage of a recovery, this kind of preemptive approach tends of necessity to rely on economic relationships derived from pre-crisis observations, when policy rates were comfortably above the lower bound.
During a period when the policy rate is limited by the lower bound, Bernanke's proposal would represent a substantial departure from the standard approach. While a standard policy framework would tend to prescribe that tightening should start preemptively, well before inflation reaches target, Bernanke's temporary price-level target proposal would imply maintaining the policy rate at the lower bound well past the point at which inflation has risen above target. In principle, policymakers would have to be willing to accept elevated rates of above-target inflation for a period following a lengthy period of undershooting.
Just as policymakers could run a risk of low inflation becoming entrenched in the standard preemptive framework, so, too, there are risks in the temporary price-level target framework. One risk is that the public, seeing elevated rates of inflation, may start to doubt that the central bank is still serious about its inflation target. It is worth noting that the policy is motivated by the opposite concern--that convergence from below, following an extended lower bound episode, may lead to an unanchoring of inflation expectations to the downside. Still, a conscious policy of overshooting may be difficult to calibrate, especially since the large confidence intervals around inflation forecasts suggest that the risks of an undesired overshooting are nontrivial. A related risk is that the central bank would lose its nerve: Maintaining the interest rate at zero in the face of a strong economy and inflation notably above its target would place a central bank in uncomfortable territory.
One additional challenge of the proposed framework is specifying a path for the policy rate immediately following liftoff that smoothly and gradually eases inflation back down to target and facilitates a gradual adjustment of the labor market. In the proposed framework, once the cumulative average rate of inflation during the lower-bound period has reached the target of 2 percent, policy would revert to a standard policy rule.11 This implies that a standard policy rule would kick in at a point when inflation is above target and the economy is at or beyond full employment. Even with a smoothing (inertial) property, a standard policy rule could result in a relatively sharp path of tightening, and the anticipation of the steep post-liftoff rate path itself could undo some of the benefits associated with the framework. Thus, there would likely need to be a transitional framework to guide policy initially post-liftoff that might make both communications and policy somewhat more complicated.
Integrating the Policy Rate and the Balance Sheet
The temporary price-level targeting framework proposed by Bernanke is appealing on a conceptual level because it proposes a simple and clear mechanism to help policymakers deal with the challenges posed by the lower bound on the policy rate in an environment of uncertainty. The reality is more complicated, however, especially if, as the paper suggests, many central banks in advanced economies are likely to operate with an additional tool when the policy rate is constrained. In the paper, Bernanke cites Chair Yellen's 2016 Jackson Hole speech, which suggests that in a recession, the FOMC could be expected to turn to large-scale asset purchases as well as forward guidance after the federal funds rate is lowered to zero.12
Today, when many central banks in advanced economies are operating with two distinct tools, policymakers consider the effects of the balance sheet as well as the policy rate in their assessment of the extent of accommodation provided by monetary policy. In the United States, from the time tapering was first discussed to the September 2017 meeting, when the path for balance sheet runoff was adopted, FOMC minutes and statements suggest that participants considered the degree of accommodation provided by both policy tools in their discussions of the sequencing and timing of changes to policy settings. Discussions about the sequencing of "normalization" and the delay of balance sheet runoff "until normalization of the level of the federal funds rate is well under way" effectively consider the extent to which maintaining the balance sheet may continue to provide makeup support for the economy while enabling the policy rate to escape the lower bound earlier than otherwise in a low neutral rate environment.
As Bernanke acknowledges, now that many central banks have developed playbooks specifying the operational modalities associated with asset purchases, and there is some familiarity with their effects on asset prices and financial conditions, there is a greater likelihood that asset purchases would become a part of the policy reaction function, along with forward guidance, during lower-bound episodes. Yet, as I have noted previously in the international context, asset purchases can complicate policy frameworks and communications, because their deployment and withdrawal has tended to be discontinuous and discrete and thus may be associated with greater uncertainty about the policy reaction function.13 It appears the public closely follows statements about both the policy rate and asset purchases to glean possible information about the future overall stance of monetary policy. This suggests there may be benefits in communications and predictability of a unified policy framework across the tools that is more predictable and continuous. Relatedly, one helpful elaboration of the framework Bernanke proposes might be to incorporate a unified measure, or shadow rate, that would capture the degree of policy accommodation provided through the combined settings of both asset purchases and the policy rate.14
Greater Cross-Border Spillovers
Moving away from the policy proposal in the paper, there are two other aspects of a low neutral rate world that I want to touch on briefly: cross-border spillovers and financial imbalances. The new normal appears to be characterized by low neutral rates and a weak relationship between overall inflation and unemployment not only in the United States, but also in many other advanced economies with lower-bound episodes likely to be more prevalent. The current environment appears also to evidence intensified cross-border feedback into financial conditions.15 In this kind of environment, it is conceivable the kind of committed forward guidance associated with the temporary price-level targeting framework proposed by Bernanke, by helping rule out anticipation of a standard preemptive tightening, could help avoid unwarranted premature tightening through the exchange rate.
Given available data, it is difficult to disentangle whether the heightened cross-border feedback effects are attributable to the low level of neutral rates, particular features of today's lower-bound episodes, or the interaction of the policies adopted by many central banks. In any case, recent Federal Reserve staff analysis suggests that cross-border spillovers have increased notably since the crisis and are quite large. For instance, European Central Bank policy news that leads to a 10 basis point decrease in the German 10-year term premium is associated with a roughly 5 basis point decrease in the U.S. 10-year term premium; by contrast, these spillovers were smaller in the years leading up to the crisis.16
Moreover, news about policy rates and term premiums appears to have quite different effects on exchange rates, such that the ordering of policy normalization can have important implications for exchange rates and associated financial conditions, as I discussed earlier this year.17 Recent staff estimates suggest that news about expected changes in the policy rate tends to have a large spillover through the exchange rate, whereas news about changes in term premiums tends to lead to corresponding cross-border changes in term premiums, as discussed previously, with much smaller effects on the exchange rate. Moreover, the exchange rate effect of changes in short-term rates is much greater than it was pre-crisis. For instance, policy news that leads to a 25 basis point increase in the expected interest rate portion of the 10‑year Treasury yield is associated with a roughly 3 percentage point appreciation in the dollar, which is three times greater than the response pre-crisis. By contrast, policy news surrounding a change in U.S. term premiums has a muted effect on the exchange rate both now and pre-crisis.
Financial Imbalances
Finally, a low neutral rate environment may also be associated with a heightened risk of asset price bubbles, which could exacerbate the tradeoff for monetary policy between achieving the traditional dual-mandate goals and preventing the kinds of imbalances that could contribute to financial instability. Standard asset-valuation models suggest that a persistently low neutral rate, depending on the factors driving it, could lead to higher ratios of asset prices to underlying income flows--for example, higher ratios of prices to earnings for stocks or higher prices of buildings relative to rents. If asset markets were highly efficient and participants had excellent foresight, this would not necessarily lead to imbalances. However, to the extent that financial markets extrapolate price movements, markets may not transition smoothly to asset valuations that reflect underlying fundamentals but may instead evidence periods of overshooting.18 Such forces may have played a role in both the stock market boom that ended in the bust of 2001 and the house price bubble that burst in 2007-09.
The risks of such financial imbalances may be greater in the context of the kind of explicit inflation target overshooting policies proposed in the paper. Again, if market participants were perfectly rational, overshooting policies would not likely pose financial stability risks. But the combination of low interest rates and low unemployment that would prevail during the inflation overshooting period could well spark capital markets to overextend, leading to financial imbalances.
Macroprudential tools are the preferred first line of defense to address such financial imbalances, which should in principle enable monetary policy to focus on price stability and macroeconomic stabilization. But the development and deployment of macroprudential tools is still relatively untested in the U.S. context, and the toolkit is limited. Although important research suggests that the situations under which monetary policy should take financial imbalances into account are likely to be very rare, some recent research has pointed out that the case in favor of taking financial imbalances into account is strengthened when the consequences of financial crises are long lasting.19 In this case, another complication of a persistently low neutral rate may be a sharper tradeoff between achieving the traditional dual-mandate objectives and avoiding financial stability risks, which may make it even more difficult to achieve our price-stability objective.
References
- Bernanke, Ben S. (2017). "Monetary Policy for a New Era," paper prepared for "Rethinking Macroeconomic Policy," a conference held at the Peterson Institute for International Economics, Washington, October 12.
- Brainard, Lael (2015). "Normalizing Monetary Policy When the Neutral Interest Rate Is Low," speech delivered at the Stanford Institute for Economic Policy Research, Stanford, Calif., December 1.
- -------- (2016a). "What Happened to the Great Divergence?" speech delivered at the 2016 U.S. Monetary Policy Forum, New York, February 26.
- -------- (2016b). "The 'New Normal' and What It Means for Monetary Policy," speech delivered at the Chicago Council on Foreign Affairs, Chicago, September 12.
- -------- (2017a). "Cross-Border Spillovers of Balance Sheet Normalization," speech delivered at the National Bureau of Economic Research's Monetary Economics Summer Institute, Cambridge, Mass., July 13.
- -------- (2017b). "Understanding the Disconnect between Employment and Inflation with a Low Neutral Rate," speech delivered at the Economic Club of New York, New York, September 5.
- Case, Karl E., Robert J. Shiller, and Anne K. Thompson (2012). "What Have They Been Thinking? Homebuyer Behavior in Hot and Cold Markets (PDF)," Brookings Papers on Economic Activity, Fall, pp. 265-98.
- Eggertsson, Gauti B., and Michael Woodford (2003). "The Zero Bound on Interest Rates and Optimal Monetary Policy," Brookings Papers on Economic Activity, Spring, pp. 139-233.
- Gerdrup, Karsten R., Frank Hansen, Tord Krogh, and Junior Maib (2017). "Leaning against the Wind When Credit Bites Back," International Journal of Central Banking, September.
- Gourio, Francois, Anil K. Kashyap, and Jae Sim (2016). "The Tradeoffs in Leaning against the Wind (PDF)," paper presented at the 17th Jacques Polak Annual Research Conference, sponsored by the International Monetary Fund, Washington, November 3.
- Greenwood, Robin, and Andrei Shleifer (2014). "Expectations of Returns and Expected Returns," Review of Financial Studies, vol. 27 (March), pp. 714-46.
- Kamin, Steven B., Canlin Li, and Marius D. Rodriguez (forthcoming). "International Spillovers from Conventional and Unconventional Monetary Policy," IFDP Notes. Washington: Board of Governors of the Federal Reserve System.
- Kiley, Michael T., and John M. Roberts (2017). "Monetary Policy in a Low Interest Rate World (PDF)," Finance and Economics Discussion Series 2017-080. Washington: Board of Governors of the Federal Reserve System, August.
- Krippner, Leo (2016). "Documentation for Measures of Monetary Policy (PDF)," Reserve Bank of New Zealand Working Paper. Wellington, New Zealand: Reserve Bank of New Zealand, July.
- Nakata, Taisuke, and Sebastian Schmidt (2016). "The Risk-Adjusted Monetary Policy Rule (PDF)," Finance and Economics Discussion Series 2016-061. Washington: Board of Governors of the Federal Reserve System, July.
- Reifschneider, David, and John C. Williams (2000). "Three Lessons for Monetary Policy in a Low-Inflation Era," Journal of Money, Credit and Banking, vol. 32 (November), pp. 936-66.
- Svensson, Lars E. (2016). "Cost-Benefit Analysis of Leaning against the Wind," NBER Working Papers Series 21902. Cambridge, Mass.: National Bureau of Economic Research, January.
- Wu, Jing Cynthia, and Fan Dora Xia (2016). "Measuring the Macroeconomic Impact of Monetary Policy at the Zero Lower Bound," Journal of Money, Credit and Banking, vol. 48 (March-April), pp. 253-91.
- Yellen, Janet L. (2016). "The Federal Reserve's Monetary Policy Toolkit: Past, Present, and Future," speech at "Designing Resilient Monetary Policy Frameworks for the Future," a symposium sponsored by the Federal Reserve Bank of Kansas City, held in Jackson Hole, Wyoming, August 26.
Notes
- Bernanke (2017).
- I am grateful to John Roberts for his assistance in preparing this text. The remarks represent my own views, which do not necessarily represent those of the Federal Reserve Board or the Federal Open Market Committee.
- See Brainard (2015, 2016b).
- The well-known Laubach-Williams model currently suggests an estimate of the longer-run neutral federal funds rate that is close to zero. The latest estimates are available on the Federal Reserve Bank of San Francisco's website at http://www.frbsf.org/economic-research/files/Laubach_Williams_updated_estimates.xlsx. Over the 1960-2007 period, the real federal funds rate--measured as the nominal federal funds rate less trailing four-quarter core PCE (personal consumption expenditures) inflation--averaged 2-1/2 percent.
- See, for example, Brainard (2017b), Kiley and Roberts (2017), and Nakata and Schmidt (2016).
- The inflation information refers to core PCE inflation measured on a 12-month average basis.
- See Brainard (2017b).
- See, for example, Eggertsson and Woodford (2003) or Reifschneider and Williams (2000).
- As Bernanke notes, one way to avoid this feature is to adopt "flexible price-level targeting," in which policy takes into account resource utilization as well as the deviation of the price level from its target. Kiley and Roberts (2017) examine a form of flexible price-level targeting—which they refer to as a "shadow rate rule"—and find that it performs well.
- The 2010 G-20 Toronto communiqué indicated that advanced economies "committed to fiscal plans that will at least halve deficits by 2013 and stabilize or reduce government debt-to-GDP ratios by 2016." The document is available on the U.S. Department of the Treasury's website at https://www.treasury.gov/resource-center/international/Documents/The%20G-20%20Toronto%20Summit%20Declaration.pdf (PDF).
- In the paper, this rule is specified as an inertial Taylor rule.
- See Yellen (2016).
- See Brainard (2015).
- See, for instance, Krippner (2016) and Wu and Xia (2016).
- See Brainard (2016a, 2016b).
- See Kamin, Li, and Rodriguez (forthcoming).
- See Brainard (2017a).
- See, for example, Case, Shiller, and Thompson (2012) and Greenwood and Schleifer (2014).
- See, for example, Svensson (2016). See Gourio, Kashyap, and Sim (2016) and Gerdrup and others (2016).
FULL DOCUMENT: https://www.federalreserve.gov/newsevents/speech/files/brainard20171012a.pdf
FED. October 12, 2017. Speech. Prospects for Emerging Market Economies in a Normalizing Global Economy.Governor Jerome H. Powell. At the 2017 Annual Membership Meeting of the Institute of International Finance, Washington, D.C.
Thank you for inviting me to speak here at the Institute of International Finance Annual Membership meeting. I am pleased to note that there have been signs lately that a sustainable global recovery may finally be materializing. This is certainly good news, although significant risks and uncertainties remain. One important question is how the emerging market economies (EMEs) will fare as global monetary conditions normalize. In our intertwined world, prospects for these economies are a significant driver of prospects for the United States and other advanced economies. In my remarks today I will argue that, despite the risks and uncertainties, EMEs are likely to manage that normalization reasonably well.
As many observers have noted, EME economic prospects are strongly linked to the evolution of capital flows.1 Accordingly, I will first review the recent rebound in EME capital inflows and analyze the drivers of this rebound. Against this backdrop, I will then discuss how the prospects for EMEs depend on three factors: Vulnerabilities in the EMEs themselves; the evolution of advanced-economy monetary conditions, including those in the United States; and market responses to that evolution. As always, my comments here represent my own views.
The Rebound in Economic Growth and Capital Flows in Emerging Markets
After real GDP growth plummeted in many EMEs during the Global Financial Crisis (GFC), economic activity rebounded sharply (slide 1). But that recovery proved to be short lived and was followed by a notable, widespread fall in EME growth as advanced economies remained sluggish, economic imbalances in China mounted, and commodity prices plunged. Lately, however, the streak of weak growth in the EMEs appears to have been broken: The downward trend in Chinese growth has flattened, growth in other EMEs has picked up some, and Brazil seems to be moving into recovery mode. The factors that underlie the pickup in EMEs to a large extent represent a reversal of developments that led to the slowing. The improvement in the performance of the advanced economies has become more widespread. Chinese authorities have bolstered their economy by providing more credit stimulus. And commodity prices have bounced back from their lows in early 2016, bolstering activity and allaying financial stability concerns in commodity-exporting economies. These developments have also contributed to a modest reversal of the slowdown in global trade seen in recent years.2
A rebound in capital flows has come along with the pickup in economic performance in the EMEs. Slide 2 shows net private capital flows to EMEs--the difference between gross private inflows and gross private outflows. These private net inflows are quite volatile, as the experience of the past 10 years shows. Strong pre-GFC net inflows to major emerging markets (the black line)--hovering in the neighborhood of 3 to 4 percent of EME gross domestic product (GDP)--were interrupted by a collapse during the crisis, but inflows quickly recovered and stayed strong through 2010. After that, net inflows trended down for several years and turned negative by 2015. Part of this retrenchment reflected Chinese net inflows turning into net outflows due to what might be considered special circumstances--notably, changes in expectations of Chinese exchange rate policy. But even taking China out of the picture, as shown by the dashed blue line, there was a clear downward trend in net inflows.
Over the past couple of years, however, net inflows have recovered and have averaged, if China is excluded, 0.7 percent of GDP in 2016 and about 1-1/2 percent of GDP in early 2017. As shown in slide 3, other measures of capital flows, such as flows into EME investment funds, show an even sharper rebound.
The recent recovery of investor appetite for EME exposure has shown up in asset prices as well. Emerging-market credit spreads have declined, and equity prices have risen (slide 4). These developments are not occurring in isolation, but in the context of a general improvement in the global outlook and in investor risk sentiment. The improvement in economic fundamentals raises the following question: To what extent can the recent recovery in EME capital flows be explained by these better economic fundamentals?
One way to shed light on this question is to compare the recent behavior of EME capital flows with what we might expect from a model of these flows based on historical data. In a recent study, Federal Reserve staff regressed net private capital inflows into several key EMEs on measures of investment opportunities in these economies, monetary policy variables, and risk sentiment variables.3 As can be seen in slide 5, by comparing the solid and dashed lines, the model does a fairly good job overall of fitting the data.
It is instructive to look at what the model tells us about the slowing of flows between 2010 and 2015. Note that the falloff in commodity prices (the red portion of the bars) was the largest contributor to the slowdown in flows. The decline in economic growth differentials between the EMEs and advanced economies (the yellow portions) was also a major contributor. In fact, growth differentials became a slightly negative contributor in 2015 after being substantially positive in 2010.4 Monetary policies (the blue portions) also became less of a factor in 2015 in driving flows to EMEs.
As for the recent rebound in flows, over the past year the model's predicted net inflows (the dashed line) have actually been significantly above actual net inflows (the solid line), suggesting that there is some room for flows to increase further without raising concerns. The model attributes the recovery of flows primarily to the turnaround in commodity prices and, to a substantially lesser extent, to improvements in risk sentiment (as seen by some waning of the negative contribution from the slashed green bars). The growth differential is not playing a major role because the rise in EME growth has been accompanied by a rise in advanced-economy growth.5
All in all, this evidence suggests that the recent pickup of capital flows to EMEs has not outrun its fundamental determinants, which provides some encouragement that these flows will not reverse themselves and endanger EME prospects, a situation that is also encouraging for U.S. prospects.
Risks to Emerging Market Economy Prospects from the Future Course of Monetary Policy
Some observers have noted that the risk of a reversal of EME capital flows may become more pronounced as U.S. and global interest rates return to more normal levels. These developments could encourage capital to return to the advanced economies and, by raising domestic interest rates and putting downward pressures on emerging market currencies, could also enlarge EME debt burdens. In assessing this risk, as I mentioned earlier, three elements are important: first, the vulnerabilities in the EMEs themselves; second, the evolution of advanced-economy monetary policies; and, third, how markets might respond to that evolution. Let me discuss each of these elements in turn.
There is clear empirical evidence that the response of EME financial markets to different shocks, including changes in U.S. interest rates, depends importantly on the state of economic fundamentals in the EMEs themselves. For example, Bowman and coauthors document in their study that a deterioration in a country's economic conditions significantly increases its vulnerability to adverse effects from changes in U.S. interest rates.6 A case in point is the so-called taper tantrum in 2013, when rises in sovereign bond spreads were significantly greater in those EMEs with greater relative vulnerabilities.
There is little doubt that over the past couple of decades, EME macroeconomic fundamentals and policy frameworks have improved substantially. One way you can see this improvement is through an index of aggregate EME vulnerability (the black line in slide 6), which is based economic data on a variety of variables from 13 major economies.7 According to this index, EME vulnerabilities today stand well below those in the 1990s--a period during which financial crises in EMEs were much more prevalent.
That said, the vulnerability index has been trending up since 2008. Part of this increase in the vulnerability index can be attributed to a run-up in bank credit to the private sector, which brings me to a key risk for EME prospects: the position of EME corporates. Observers have been expressing concerns about the mounting levels of corporate debt and the risk that a normalization of global conditions could exacerbate debt service burdens of EME corporations--particularly those with elevated levels of dollar-denominated debt--by raising global interest rates, boosting the value of the dollar, and perhaps damping economic activity. Given the prominence of this risk, I will discuss EME corporates in a bit more detail.
Since 2008, the debt of EME nonfinancial corporations has tripled in dollar value, reaching roughly $27 trillion in the first quarter of 2017. As a share of GDP, as shown by the black line in slide 7, it has nearly doubled, to over 100 percent of GDP. China's situation is distinct from many other EMEs. On the one hand, as can be seen by the red line, its corporate debt, at 170 percent of GDP now, is much higher than most other EMEs and substantially above the level we saw in East Asia before the Asian crisis. On the other hand, Chinese corporates are much less exposed to changes in exchange rates and global interest rates.
But the rising amount of debt by itself does not tell us whether this debt is excessive and how vulnerable EME corporates are to global monetary and market shocks. For that assessment we need to drill down deeper into the health of the corporate sector. In a recent study, Beltran and coauthors undertake such an analysis using a common metric of debt service capacity--the interest coverage ratio, or ICR, which is the ratio of earnings to interest expense.8 All else being equal, this ratio is lower for firms that are less profitable, more leveraged, and have a higher cost of borrowing. Using firm-level data, the authors classify the debt of those firms with an ICR of less than 2 as "debt-at-risk."9 They find, as shown by the black line in slide 8, that this measure of risky EME corporate debt has almost tripled since 2011 to about 30 percent of GDP. But this share is still considerably lower than the 46 percent of GDP debt-at-risk in East Asia on the eve of the Asian crisis (the horizontal dashed black line in the chart). For China, though, the debt-at-risk now exceeds what we saw in East Asia before the Asian crisis. Outside of China (the dashed blue line), EME debt-at-risk, at about 10 percent of GDP, seems much more manageable. However, as can be seen by the blue portions of the bars in slide 9, debt-at-risk in a number of EMEs, including South Korea, India, Turkey, and Brazil exceeds that average level.
How will EME corporate debt fare going forward as global normalization proceeds? The results of the study I just discussed imply that a 1 percentage point increase in EME corporate borrowing costs by itself would not be so problematic, at least outside of China.10 What this shock would do to debt-at-risk is shown by the red cross‑hatched portions of the bars in the chart. But it would be a bigger deal if the rise in borrowing costs was accompanied by a more generalized adverse turn of events in EMEs, modeled here as a 20 percent earnings reduction and a 20 percent hit to the value of EME currencies against the dollar. The estimated effects of these additional shocks on debt-at-risk are shown by the slashed red portions of the bars.11 In this case, aggregate EME debt-at-risk rises from about 30 percent of GDP to around the level seen prior to the Asian financial crisis.12 Notably, the increase comes mainly from China, where debt‑at‑risk jumps to about 85 percent of GDP. Outside of China, risky debt also rises substantially but seemingly not to levels that would be considered unmanageable.
Overall, based on this analysis, I would conclude that corporate debt represents a moderate degree of vulnerability for EME prospects. The situation is not alarming, but risks are significant and bear close watching, especially in China.
The Evolution of Federal Reserve Policy
What of the evolution of monetary conditions in the advanced economies? I will confine myself here to Fed policy. One factor that favors easier adjustment in EMEs is that U.S. monetary policy normalization has been and should continue to be gradual, as long as the U.S. economy evolves roughly as expected.
Since the start of normalization in December 2015, the federal funds rate has risen to about 1‑1/4 percent from its effective lower bound (slide 10). The median projections of Federal Open Market Committee (FOMC) participants (the blue dots) have it rising to 2.9 percent by the end of 2020, fairly close to what is regarded by the median participant as its long-run value and significantly below its average value in the years prior to the GFC. As reflected in the FOMC's recent communications, the shrinkage of the Fed's balance sheet is also expected to proceed quite gradually, with slowly phased-in increases in caps on the monthly reductions in the Federal Reserve's security holdings.
The expectation of gradual policy normalization should reduce the likelihood of outsized movements in interest rates. Indeed, even if we add, say, a 50 basis point term premium to the expected long-run federal funds rate, this value would still leave long-term U.S. interest rates (shown in slide 11) well below their pre-GFC averages. As long as global financial conditions normalize in an orderly fashion, EMEs should have sufficient time to adjust. And, as we saw earlier, interest rate changes of this magnitude should not lead to generalized corporate distress in EMEs, although undoubtedly some corporates are more exposed and could experience difficulties.
Market Response
All that said, market movements can be noisy, which brings me to what I believe is the most uncertain element--the potentially volatile behavior of markets even in an environment of relatively contained EME vulnerabilities and of gradual and clearly communicated advanced-economy monetary policies.
So far, markets have behaved in a manner consistent with a relatively benign scenario for EMEs: Risk sentiment is holding up, credit spreads in emerging markets have been declining, equities are up, long-term yields have hardly budged, and the dollar has been declining. Markets, however, can turn on a dime, and reactions can be outsized. This concern may be especially relevant at present, given the low level of volatility and elevated asset prices in global markets, which may increase the likelihood and severity of an adjustment.
Most of the time bouts of market turbulence lead to relatively quick corrections that leave markets more resilient without substantially depressing global growth. The taper tantrum of 2013 that I mentioned earlier is a good example. Ultimately, the policy adjustments made by some of the most affected economies, along with the more realistic appraisal of risks by global investors, likely left the global economy in a somewhat better position than before the episode. That said, however, market tantrums pose complex economic and financial challenges, and such episodes carry a significant risk of snowballing into something bigger that more substantially threatens the economic expansion.
Conclusion
To conclude, I have suggested that the most likely outcome is that the challenges posed to EMEs by the normalization of global financial conditions will be manageable.13 So far, capital flows have been moving in line with market fundamentals. Although, EME vulnerabilities have been rising, they are still well below the levels of the crisis-prone years of the 1980s and 1990s. Global monetary conditions are expected to normalize only gradually, as the Federal Reserve and other advanced-economy central banks continue to stress clear communication and transparency. And the reaction of EME financial markets so far has been benign. But significant risks of more adverse scenarios remain. The corporate debt situation in EMEs has been worsening, particularly in China, and market reactions to even small surprises can be unpredictable and outsized.
Even with these risks, however, the best thing the Federal Reserve can do--not just for the United States, but for the global economy at large--is to keep our house in order through the continued pursuit of our dual mandate. Finally, it bears remembering that Fed policy normalization is occurring not in isolation, but in the context of a solid U.S. economic recovery, which should benefit all economies around the world.
References
- Ahmed, Shaghil, and Andrei Zlate (2014). "Capital Flows to Emerging Market Economies: A Brave New World?" Journal of International Money and Finance, vol. 48 (November), pp. 221-48.
- Alfaro, Laura, Gonzalo Asis, Anusha Chari, and Ugo Panizza (2017). "Lessons Unlearned? Corporate Debt in Emerging Markets," NBER Working Paper 23407. Washington: National Bureau of Economic Research, May.
- Ayala, Diana, Milan Nedelijkovic, and Christian Saborowski (2015). "What Slice of the Pie? The Corporate Bond Market Boom in Emerging Economies (PDF)," IMF Working Paper WP/15/148. Washington: International Monetary Fund, July.
- Beltran, Daniel, Keshav Garud, and Aaron Rosenblum (2017). "Emerging Market Nonfinancial Corporate Debt: How Concerned Should We Be?" IFDP Notes. Washington: Board of Governors of the Federal Reserve System, June 1.
- Bowman, David, Juan M. Londono, and Horacio Sapriza (2015). "U.S. Unconventional Monetary Policy and Transmission to Emerging Market Economies," Journal of International Money and Finance, vol. 55 (July), pp. 27-59.
- Bruno, Valentina, and Hyun Song Shin (2015). "Capital Flows and the Risk-Taking Channel of Monetary Policy," Journal of Monetary Economics, vol. 71 (April), pp. 119‑32.
- Cavallo, Eduardo, Andrew Powell, Mathieu Pedemonte, and Pilar Tavella (2015). "A New Taxonomy of Sudden Stops: Which Sudden Stops Should Countries Be Most Concerned About?" Journal of International Money and Finance, vol. 51 (March), pp. 47-70.
- Chen, Jiaqian, Tommaso Mancini-Griffoli, and Ratna Sahay (2014). "Spillovers from United States Monetary Policy on Emerging Markets: Different This Time? (PDF)" IMF Working Paper WP/14/240. Washington: International Monetary Fund, December.
- Chow, Julian T.S. (2015). "Stress Testing Corporate Balance Sheets in Emerging Economies," IMF Working Paper WP/15/216. Washington: International Monetary Fund, September, available at http://citeseerx.ist.psu.edu/viewdoc/download;jsessionid=8A054997E3FBA6EC30B9601BA692B9F4?doi=10.1.1.698.5498&rep=rep1&type=pdf (PDF).
- Clark, John, Nathan Converse, Brahima Coulibaly, and Steve Kamin (2016). "Emerging Market Capital Flows and U.S. Monetary Policy," IFDP Notes. Washington: Board of Governors of the Federal Reserve System, October 18.
- Fratzscher, Marcel (2012). "Capital Flows: Push Versus Pull Factors, and the Global Financial Crisis," Journal of International Economics, vol. 88 (November), pp. 341-56.
- Fratzscher, Marcel, Marco Lo Duca, and Roland Straub (2013). "On the International Spillovers of U.S. Quantitative Easing," ECB Working Paper 1557. Frankfurt: European Central Bank, June.
- Ghosh, Atish R., Jun Kim, Mahvash S. Qureshi, and Juan Zalduendo (2012). "Surges (PDF)," IMF Working Paper WP/12/22. Washington: International Monetary Fund, January.
- Hausman, Joshua, and Jon Wongswan (2011). "Global Asset Prices and FOMC Announcements," Journal of International Money and Finance, vol. 30 (April), pp. 547-71.
- International Monetary Fund (2014). "Moving from Liquidity to Growth-Driven Models," chapter 1 of Global Financial Stability Report. Washington: IMF, April, pp. 1-65.
- --------- (2016a). "Financial Stability Challenges in a Low-Growth, Low-Rate Era," chapter 1 of Global Financial Stability Report. Washington: IMF, October, pp. 1-48.
- --------- (2016b). "Understanding the Slowdown in Capital Flows to Emerging Markets," chapter 2 in World Economic Outlook: Too Slow for Too Long. Washington: IMF, April, pp. 63-99.
- --------- (2017). "Is Growth at Risk?" chapter 1 of Global Financial Stability Report. Washington: IMF, October, pp.1-52.
- Koepke, Robin (2015). "What Drives Capital Flows to Emerging Markets? A Survey of the Empirical Literature," IIF Working Paper. Washington: Institute of International Finance, April, available at https://www.iif.com/publication/capital-flows/what-drives-capital-flows-emerging-markets-2.
- Pomerleano, Michael (1998). "Corporate Finance Lessons from the East Asian Crisis (PDF)," Note 155. Washington: World Bank Group, October.
- Powell, Jerome H. (2013). "Advanced Economy Monetary Policy and Emerging Market Economies," speech delivered at "Prospects for Asia and the Global Economy," the 2013 Asia Economic Policy Conference sponsored by the Federal Reserve Bank of San Francisco, San Francisco, Calif., November 4.
- --------- (2016). "The Global Trade Slowdown and Its Implications for Emerging Asia," speech delivered at "CPBS 2016 Pacific Basin Research Conference," sponsored by the Center for Pacific Basin Studies at the Federal Reserve Bank of San Francisco, San Francisco, Calif., November 18.
- Tepper, Alexander, Jeffrey Moore, Myeongguk Suh, and Sunwoo Nam (2013). "Estimating the Impacts of U.S. LSAPs on Emerging Market Economies' Local Currency Bond Markets," Staff Report 595. New York: Federal Reserve Bank of New York, January.
Notes
- For more on this linkage, see Powell (2013).
- For more on the global trade slowdown, see Powell (2016).
- The specific variables in the regression include the GDP growth differential between EMEs and advanced economies, commodity prices, EME interest rate differentials with advanced economies, measures of the Federal Reserve's quantitative easing, the VIX (which is the one-month-ahead option-implied volatility of the S&P 500 index), and country-specific emerging market credit spreads (see Clark and others, 2016). Note that, because of special factors driving its flows over the past few years, China is not included in this analysis. Other studies that have also examined determinants of EME capital flows include International Monetary Fund (2016b), Koepke (2015), Ahmed and Zlate (2014), Fratzscher (2012), and Ghosh and others (2012). Generally, these papers find that many factors, including both "pull" and "push," affect EME capital flows.
- This negative contribution reflects that the average growth differential between the selected group of EMEs, which does not include China, and the advanced economies itself became negative.
- Variants of the model applied to gross capital inflows, rather than net capital inflows, give qualitatively similar results. In particular, the model of gross flows also finds that the pickup in these flows has been less strong than predicted by the model. However, the relative contribution of the risk variables to the pickup in EME flows relative to the turnaround in commodity prices is somewhat larger with the gross flows model than the net inflows model. The consequences of net versus gross flows for the recipient economies can potentially differ as, for example, Cavallo and others (2015) have argued.
- See Bowman, Londono, and Sapriza (2015). Other papers that have looked at the effects of U.S. monetary policies on EME asset prices and the channels through which these effects are transmitted include Bruno and Shin (2015); Chen, Mancini-Griffoli, and Sahay (2014); Fratzscher, Lo Duca, and Straub (2013); Tepper and others (2013); and Hausman and Wongswan (2011).
- Variables used in creating the index include external debt, the current account position, foreign reserves, public debt, control of inflation, and bank credit to the private sector.
- See Beltran, Garud, and Rosenblum (2017). Other studies that have recently investigated EME corporate vulnerabilities include Alfaro, Chari and Panizza (2017); International Monetary Fund (2014, 2016a); and Chow (2015).
- An ICR of 2 or less is often associated with increased likelihood of distress. For example, just before the Asian financial crisis, firms in Indonesia, South Korea, and Thailand had an average ICR of 2 (see Pomerleano, 1998).
- A 1 percentage point positive shock to the borrowing costs of EME corporates undoes about half of the decline in average borrowing costs from 2009 to 2016. Although on the face of it, this shock does not seem too large, as discussed in Beltran and others (2017), it is applied to the average interest rate on the entire existing debt, not just on new debt. Given that the average interest rate for EME firms is about 4‑3/4 percent, a 1 percentage point rise increases the interest expense by about a fifth.
- The calibration of the shocks is the same as in Beltran and others (2017). A 20 percent earnings shock corresponds to about half of the decline in EME corporate earnings experienced after the global financial crisis. It is difficult to say how much emerging market currencies might depreciate under stress, but 20 percent currency depreciation seems well within the plausible range. While the calibration of the shocks is the same as the above-mentioned study, the effects have been updated to reflect a larger sample of firms that is now available. Qualitatively, the results and conclusions do not change from this update.
- In computing the new debt-at-risk after exchange rate shocks, we need the share of debt that is foreign currency-denominated, which is taken from Ayala, Nedelijkovic, and Saborowski (2015).
- The IMF's most recent Global Financial Stability Report, released October 11, (IMF, 2017), also concludes that EMEs should be able to handle any reduction in flows from global monetary policy normalization "in a relatively smooth manner, given their enhanced resilience and stronger growth outlook."
FULL DOCUMENT: https://www.federalreserve.gov/newsevents/speech/files/powell20171012a.pdf
_________________
ORGANISMOS
CEPAL. 12 DE OCTUBRE DE 2017. DESARROLLO ECONÓMICO. Actividad económica de América Latina y el Caribe se expandirá 1,2% en 2017 y 2,2% en 2018. CEPAL actualizó sus proyecciones de crecimiento para los países de la región.
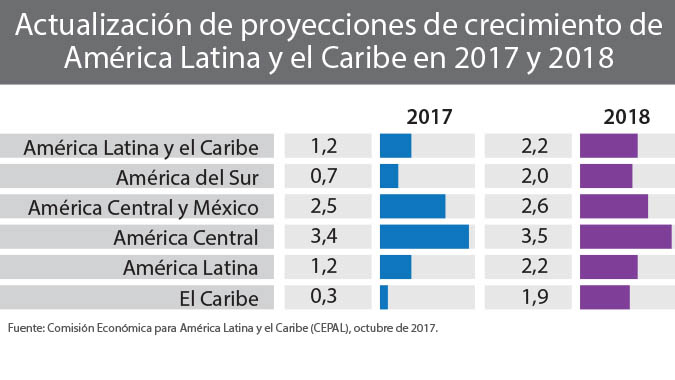
La Comisión Económica para América Latina y el Caribe (CEPAL) revisó las proyecciones de crecimiento de la actividad económica de la región para 2017 y espera una expansión promedio de 1,2% en América Latina y el Caribe durante este año, levemente superior a la pronosticada en julio pasado. Para 2018 se espera un repunte en la dinámica económica de la región con un crecimiento promedio de 2,2%, la mayor tasa observada desde el año 2013, según informó hoy el organismo de las Naciones Unidas mediante un comunicado de prensa.
Como ha sido característico en los últimos años, la dinámica del crecimiento mostraría diferencias entre países y subregiones, indica la CEPAL. Las economías de América del Sur, especializadas en la producción de bienes primarios, en especial petróleo, minerales y alimentos, crecerían a una tasa positiva (0,7%) este año, luego de dos años de contracción económica. Para el año 2018 se espera un mayor dinamismo en esta subregión, que crecería al 2% en promedio.
Para las economías de Centroamérica por su parte, se espera una tasa de crecimiento de 3,4% para este año y del 3,5% para el 2018. Para el Caribe de habla inglesa u holandesa se estima un crecimiento promedio de 0,3% para 2017, cifra revisada a la baja respecto de la proyección de julio, principalmente como consecuencia del daño causado por los huracanes Irma y María en algunos de los países de la subregión. Para 2018 sin embargo, se prevé un aumento del dinamismo con una tasa de crecimiento del 1,9%, influida en algunos casos por esfuerzos de gasto para la reconstrucción además de un contexto global algo más dinámico en términos de crecimiento y comercio internacional.
De acuerdo con la CEPAL, la capacidad de los países de la región para generar un proceso de crecimiento económico más dinámico y sostenido en el tiempo depende de los espacios para adoptar políticas que apoyen la inversión, lo que será fundamental para aminorar los efectos de choques externos y evitar consecuencias significativas en el desempeño de las economías en el mediano y largo plazo.
En este contexto potenciar la inversión tanto pública como privada resulta esencial así como también la diversificación de la estructura productiva hacia una con mayor valor agregado e incorporación de tecnología y conocimiento.
Brasil: 2017 (0,7%) y 2018 (2,0%)
TABLA COMPLETA: https://www.cepal.org/sites/default/files/pr/files/tabla_proyecciones_octubre2017.pdf
IMF. October 13, 2017. IMF COUNTRY FOCUS. Latin America's Recovery on Track but Long-Term Growth Weak. Economic activity in Latin America remains on track to recover gradually in 2017–18, but long-term growth remains stuck in low gear, slowing progress in catching up to income levels in advanced countries, according to the IMF’s latest regional update.
The Regional Economic Outlook Update for the Western Hemisphere has marked up its growth forecasts for Latin America and the Caribbean to 1.2 percent in 2017 and 1.9 percent in 2018. A favorable external environment is helping the recovery. Global demand is getting stronger and easy global financial conditions—low global market volatility and resilient capital inflows—are boosting domestic financial conditions.
At the same time, inflation is moderating in many countries as the effects of earlier exchange rate depreciations on domestic prices subside, some currencies appreciate, and economic slack (the quantity of labor and capital that remains idle) continues. Inflation at the regional level is expected to decline to 4.2 percent in 2017 (from its peak of 6.2 percent in 2015) and to remain at about 3½ percent thereafter.
Despite this ongoing recovery, prospects for strong long-term growth in Latin America and the Caribbean look dimmer. In the next 3-5 years, Latin America is projected to grow 1.7 percent in per capita terms. This growth rate is almost identical to the region’s performance over the past quarter century and only marginally better than those in advanced economies, raising concerns that the region is not catching up to income levels in advanced countries.
Regional mix
After bottoming out in 2016, growth in South America is gradually picking up, the report said. Argentina is recovering from last year’s recession and is expected to grow by about 2½ percent in 2017 as investment firms up. After entering positive territory in the first half of 2017, growth in Brazil is expected to reach 0.7 percent for the whole year and 1.5 percent in 2018. In Chile, growth in the first half of 2017 remained weak, despite resilient household spending. In Colombia, the economic slowdown continues, given the permanent shock to commodity income and the tax reform. The Venezuelan economy continues contracting for the fourth consecutive year and inflation is on the path to hyperinflation.
In Mexico, economic activity remained solid in the first half of the year despite uncertainty about future trade relations with the United States. In Central America, economic activity, in aggregate, remains close to potential.
Economic prospects for the Caribbean are generally improving, but the baseline projections reflect data available before the impact of Hurricanes Harvey, Irma, and Maria, and do not include the devastating impact of these hurricanes on a number of countries in the region and the risk they pose to their growth outlook.
Risks
Domestic and external risks include:
- political, related to the uncertainty of policy stance following the elections that will take place in several countries;
- humanitarian , if the ongoing crisis in Venezuela deteriorates;
- financial , if global financial conditions tighten; and
- economic, if there is an abrupt adjustment in demand from China.
Retreat from cross-border economic integration and natural disasters and climate change also pose risks to the region’s long-term outlook.
Policy priorities
Limited room in the budget. The region’s public debt increased above the average level for emerging markets. This suggests that many countries would need to continue to lower their deficits to put their public finances on a sustainable path.
More supportive monetary policy. As inflation and inflation expectations decline and are at or below target ranges in many countries—central banks have been reducing their policy rates. Monetary policy can continue to play a more supportive role, particularly given the limited fiscal space and continued economic slack.
Lifting incomes. Countries need to push forward much-needed structural reforms to ensure sustainable and inclusive growth. Priorities include: closing infrastructure gaps, enhancing female labor force participation where it is still low, reducing labor market informality, investing in human capital to ensure broad-based access to high-quality education, improving governance and curbing corruption, and furthering regional trade and financial integration.

Regional Economic Outlook Update - Latin America and the Caribbean: http://www.imf.org/en/Publications/REO/WH/Issues/2017/10/11/wreo1017
CEPAL. 12 DE OCTUBRE DE 2017. PLANIFICACIÓN PARA EL DESARROLLO. América Latina y el Caribe reafirma importancia de la planificación como medio de implementación de la Agenda 2030. En el marco de la XVI Reunión del Consejo Regional de Planificación, que se realizó en Perú, la CEPAL lanzó el Observatorio Regional de Planificación y el Plan Barómetro, dos herramientas para el mejoramiento de la planificación en la región.
Los países de América Latina y el Caribe reafirmaron hoy la importancia de la planificación para el desarrollo como medio de implementación de la Agenda 2030 en la región, durante la XVI Reunión del Consejo Regional de Planificación que se celebró en Lima, Perú.
El encuentro bienal fue inaugurado por Javier Abugattás, Presidente del Consejo Directivo del Centro Nacional de Planeamiento Estratégico (CEPLAN) del Perú, Miguel Ángel Moir, Secretario de Planificación y Programación de la Presidencia de Guatemala; Andrés Mideros, Secretario Nacional de Planificación y Desarrollo del Ecuador, y Raúl García-Buchaca, Secretario Ejecutivo Adjunto para Administración y Análisis de Programas de la Comisión Económica para América Latina y el Caribe (CEPAL).
En sus resoluciones, el Consejo, órgano subsidiario intergubernamental que orienta las actividades del Instituto Latinoamericano y del Caribe de Planificación Económica y Social (ILPES) de la CEPAL, solicitó al organismo mantener la investigación aplicada, cooperación técnica, asesorías y capacitación vinculadas a la planificación para el desarrollo, la gestión pública y la incorporación de la Agenda 2030 y los ODS en los planes nacionales de desarrollo.
Durante la reunión, que se celebró en Lima con la asistencia de representantes de 16 países de la región, se aprobó el informe de actividades realizadas por el ILPES durante el bienio 2015-2017, rendido por su Directora, Cielo Morales, y se eligió a Perú como Presidente del Consejo por el próximo período. Los países también nominaron a República Dominicana como sede de la próxima reunión de la Mesa Directiva del Consejo, que se realizará durante el segundo semestre de 2018.
En el marco del encuentro, la CEPAL presentó el documento Planificación para el Desarrollo en América Latina y el Caribe, enfoques, experiencias y perspectivas, que investiga e interpreta prácticas de planificación en nueve países de la región: Argentina, Brasil, Chile, Colombia, Cuba, Ecuador, Guatemala, México y República Dominicana.
La Comisión regional de las Naciones Unidas lanzó además el Observatorio Regional de Planificación, un espacio de análisis, información y construcción colectiva de conocimiento para los gobiernos, la academia, el sector privado y la sociedad civil, acerca de la planificación para el desarrollo en América Latina y el Caribe.
También se dio a conocer el Plan Barómetro, una herramienta que permite caracterizar los instrumentos, procesos y sistemas de planificación para el desarrollo.
En un mensaje proyectado al inicio de la reunión, Alicia Bárcena, Secretaria Ejecutiva de la CEPAL, destacó que ampliar la cooperación es esencial para lograr los Objetivos de Desarrollo Sostenible.
Recordó que el Consejo de Planificación nació como órgano de consulta para conducir los programas del ILPES y añadió que hoy, cuando el mundo ha cambiado y se ha complejizado, “la misión de fortalecer las capacidades para enfrentar estos nuevos desafíos de desarrollo a través de ejercicios de planificación y de gestión pública, es más relevante que nunca”.
En el marco del XVI Consejo Regional de Planificación sesionó la XV Conferencia de Ministros y Jefes de Planificación de América Latina y el Caribe, que se celebró el 11 de octubre en Lima.
________________
ECONOMIA BRASILEIRA
MRE. MDIC. REUTERS. 13 DE OUTUBRO DE 2017. Mercosul e Canadá anunciam em dezembro abertura de negociações sobre acordo de livre comércio, dizem fontes
Por Lisandra Paraguassu
BRASÍLIA (Reuters) - Mercosul e Canadá irão anunciar em dezembro a abertura de negociações sobre um acordo de livre comércio, durante a reunião ministerial da Organização Mundial do Comércio (OMC) em Buenos Aires, disseram à Reuters duas fontes envolvidas nas negociações.
Do lado sul-americano, os mandatos para negociar já foram aprovados pelos quatro governos dos países membros do bloco (Brasil, Argentina, Uruguai e Paraguai). Pela parte canadense, de acordo com uma das fontes, falta apenas o passo final, que seria a consulta formal ao gabinete do primeiro-ministro Justin Trudeau.
A avaliação das fontes brasileiras é que o acordo com o Canadá tem potencial para andar rapidamente. Há interesses dos dois lados, ao mesmo tempo em que não há grandes sensibilidades, como no caso da agricultura para a União Europeia.
“Nas conversas preliminares nunca identificamos obstáculos intransponíveis”, disse a fonte.
As primeiras conversas começaram em 2010, por iniciativa do Canadá. Em 2012, o governo brasileiro aprovou na Câmara de Comércio Exterior (Camex) o mandato para iniciar as negociações, mas o processo não foi adiante.
“Naquele momento outros sócios não estavam tão interessados”, explicou a fonte. “Agora os países têm mais afinidade e mais interesse em buscar outros acordos.”
Uma reunião será marcada para novembro, em Brasília, para fechar os últimos detalhes do mandato de negociação -- uma plataforma de onde se parte para começar a negociar.
O governo canadense pediu que se atualizasse questões relativas a cláusulas ambientais e outros temas relacionados ao que chamam de “progressive trade”, o que foi aceito sem problemas pelo Mercosul.
Apesar do comércio pouco significativo do bloco com o Canadá, a possibilidade de acordo entusiasma os negociadores do Mercosul pela possibilidade de crescimento. Dados levantados do Ministério da Indústria, Comércio e Serviços (Mdic) mostram que em 2016 a corrente de comércio foi de apenas 5,88 bilhões de dólares entre o Mercosul e o Canadá. Com os Estados Unidos, por exemplo, foi de 59,8 bilhões no mesmo ano.
“É pequeno porque o Canadá é um país com população pequena. São apenas 36 milhões de pessoas. Mas é um mercado com alto poder aquisitivo, e um mercado não explorado”, disse uma das fontes.
O bloco tem superávit com os canadenses. Em 2016, foram exportados 3,6 bilhões de dólares e importados 2,3 bilhões. O grosso do comércio regional é com o Brasil, que em 2016 concentrou 4,2 bilhões de dólares da corrente de comércio e 2,37 bilhões em exportações. No caso do Brasil, a exportação de produtos manufaturados domina a pauta de comércio, representando 53 por cento das exportações.
Nas conversas com os setores produtivos, o governo brasileiro identificou oportunidades não apenas na área industrial, mas também na agricultura. “Eles têm muita produção agrícola mas, até por conta do clima, diferente da nossa”, disse a fonte.
De acordo com os negociadores, as tarifas canadenses são de um modo geral baixas, com exceção da agricultura, onde há um grande potencial para melhorar. Nas demais, há questões não tarifárias, de normas técnicas e sanitárias, que costumam ser menos complicadas de resolver.
Esta semana, durante a reunião ministerial da OMC em Marrakech, o ministro das Relações Exteriores, Aloysio Nunes, teve um encontro com ministro do Comércio Internacional do Canadá, François-Philippe Champagne, para tratar do acordo. Em nota, o Itamaraty afirmou que os ministros “reconheceram que existe um forte potencial para o desenvolvimento de uma relação comercial mais ambiciosa através do aumento dos fluxos de comércio e investimento”.
Consultado pela Reuters, o governo do Canadá afirmou, através de um porta-voz de Champagne, que o país “reafirma que existe uma oportunidade no acordo com o Mercosul e que irá continuar com as conversas exploratórias”.
MRE. MDIC. AGÊNCIA ESTADO. 13/10/2017. Mercosul negocia com Canadá e países da África
Lu Aiko Otta
Enquanto as negociações do acordo de livre comércio entre o Mercosul e a União Europeia patinam, o bloco sul-americano tenta avançar com outros entendimentos de menor porte que poderão, no conjunto, atuar favoravelmente para expandir seu comércio. São mercados que interessam aos setores privados regionais.
Na próxima semana, uma delegação do Canadá estará no Brasil para tentar fechar os parâmetros de um acordo. Se tudo correr bem, o pontapé inicial das negociações será anunciado na reunião da Organização Mundial do Comércio (OMC) em dezembro, em Buenos Aires.
No ano passado, o Brasil exportou US$ 2,4 bilhões para aquele país, com boa participação de produtos industriais. O Ministério da Agricultura vê potencial de expansão de mercado lá.
O interesse no acordo foi reforçado na última segunda-feira, em declaração conjunta emitida por Mercosul e Canadá, após reunião do ministro das Relações Exteriores, Aloysio Nunes, com o ministro do Comércio Internacional daquele país, François-Phillipe Champagne. Ambos estavam em Marrakesh, no Marrocos, numa reunião preparatória da OMC.
Brasil e Canadá travam uma dura batalha no tribunal da concorrência internacional por causa de subsídios à produção de aviões. No entanto, fontes próximas às conversas garantem que esse tema não contamina as negociações do acordo, da mesma forma que os questionamentos europeus sobre o Inovar Auto, por exemplo, não interferiram nas rodadas de entendimento.
Mais adiantado do que o acordo com o Canadá, o Mercosul negocia também um com o Efta, bloco formado por Suíça, Noruega, Islândia e Liechtenstein. Já houve duas rodadas de entendimentos. Tal como com a União Europeia, é possível que esse acordo enfrente dificuldades por causa de produtos agropecuários. É o caso da carne e do leite, produzidos pela Suíça.
Estão em andamento entendimentos com Marrocos e Tunísia. Embora sejam economias menores, os acordos poderão ser fechados rapidamente, pois tratarão apenas de comércio de bens. Não terão capítulos sobre investimentos e compras governamentais, como os demais.
Europa
O foco dos negociadores, porém, continua sendo o acordo com a União Europeia, dado o tamanho do mercado. Seria o primeiro acordo comercial de grande porte do Mercosul.
As negociações sofreram um novo abalo na última quarta-feira, quando o presidente da França, Emmanuel Macron, afirmou num encontro com produtores agrícolas que não tem pressa em fechar em dezembro um acordo que está sobre a mesa desde 1999. E que discutirá a questão com outros líderes europeus.
Macron não tem poder de veto sobre o acordo. Mas o posicionamento da França tem peso nas decisões do bloco, de 28 países. É um complicador, avaliam negociadores brasileiros. Uma nova rodada de negociações está marcada para os dias 6 a 10 de novembro.
________________
LGCJ.: