CANADA ECONOMICS
CANADA TRADE BALANCE
StatCan. 2017-05-04. Canadian international merchandise trade, March 2017
Imports
$47.1 billion, March 2017
1.7% increase (monthly change)
Exports
$47.0 billion, March 2017
3.8% increase (monthly change)
Trade balance
-$135 million, March 2017
Source(s): CANSIM table 228-0069.
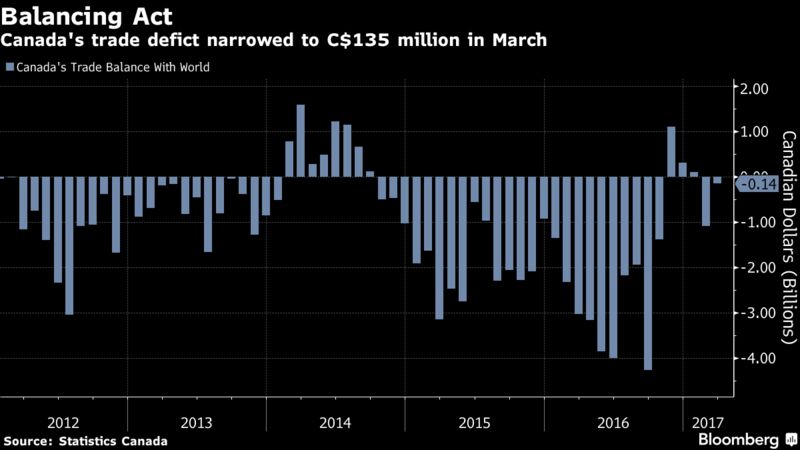
Canada's merchandise trade balance with the world posted a $135 million deficit in March, narrowing from a $1.1 billion deficit in February. Exports rose 3.8% in March to a record high $47.0 billion, due to stronger exports of energy products and consumer goods. Imports were up 1.7% to $47.1 billion, mainly on higher imports of unwrought gold.
Chart 1 Chart 1: Merchandise exports and imports
Merchandise exports and imports

Record exports led by higher energy products
Exports rose 3.8% to a record high $47.0 billion in March, with increases in 8 of 11 sections, following a 2.5% decline in February. Volumes were up 2.5% in March and prices increased 1.3%. Energy products, consumer goods, and metal and non-metallic mineral products were responsible for the increase in exports in March. Exports excluding energy products rose 3.1%. Year over year, total exports increased 12.9%.
Exports of energy products were up 7.0% to $8.7 billion in March on higher volumes. Natural gas exports (+31.6%) led the increase, which is attributable to unusually low temperatures in the northeastern United States in March. Additionally, other energy products rose 64.2%, mainly on higher exports of coal to Japan, China and South Korea. This increase coincided with a slowdown in coal production in Australia caused by Cyclone Debbie, which struck the Australian coast in February.
Exports of consumer goods also contributed to the overall increase in March, rising 6.8% to $6.1 billion. Exports of other food products led the increase, up 11.9% to a record high $1.4 billion, on increased exports of yellow peas and red lentils to India. Exports of miscellaneous goods and supplies also contributed to the increase (+21.2%), mainly on higher exports of gold coins.
Metal and non-metallic mineral products were up 7.1% to $5.6 billion in March, following a 7.4% increase in February. Unwrought precious metals and precious metal alloys led the increase (+14.1%) in March, mainly on higher exports of unwrought gold to China. For the section as a whole, prices were up 4.2% and volumes increased 2.8%.
Increase in imports of unwrought gold
Total imports were up for the fourth consecutive month, increasing 1.7% to $47.1 billion in March, with gains in 7 of 11 sections. Prices rose 1.9% while volumes edged down 0.2%. Higher imports of metal and non-metallic mineral products, industrial machinery, equipment and parts, and motor vehicles and parts were the main contributors to the increase. Year over year, imports were up 5.6%.
In March, imports of metal and non-metallic mineral products increased 10.4% to $4.0 billion, returning to December levels. Unwrought precious metals and precious metal alloys contributed most to the gain, rising 61.1% to $856 million. Higher imports of unwrought gold from Japan led the increase. For the section as a whole, volumes were up 5.1% and prices rose 5.0%.
Imports of industrial machinery, equipment and parts increased 4.1% to $4.4 billion in March, the highest level since September 2016. Most commodity groupings in the section posted gains.
Imports of motor vehicles and parts reached a record high $9.3 billion in March, up 1.5%. Motor vehicle engines and motor vehicle parts, as well as passenger cars and light trucks led the increase. Strong truck sales in March, which are expected to continue in April, drove the increase in imports of passenger cars and light trucks.
A record high in exports to non-U.S. countries
In March, exports to countries other than the United States rose 15.3% to a record high $12.6 billion. Higher exports to China (gold and coal), India (legumes) and South Korea (coal and copper) were responsible for the gain in March.
Imports from countries other than the United States were up 1.2% to $16.7 billion in March, on higher imports from Saudi Arabia (crude oil) and the United Kingdom. As a result, the trade deficit with countries other than the United States narrowed from $5.6 billion in February to $4.1 billion in March.
Imports from the United States increased 2.0% to $30.4 billion in March, while exports to the United States edged up 0.1% to $34.4 billion. As a result, Canada's trade surplus with the United States narrowed from $4.5 billion in February to $4.0 billion in March. The Canadian dollar fell 1.6 cents US relative to the American dollar in March.
Trade reaches a record high in the first quarter
On a quarterly basis, imports rose 2.6% in the first quarter compared with the previous quarter, reaching a record high $139.7 billion. Increases were observed in imports of motor vehicles and parts, energy products, and aircraft and other transportation equipment and parts.
In the first quarter, exports increased 1.7%, also reaching a record high of $138.6 billion primarily on higher exports of energy products.
As a result, Canada's merchandise trade balance with the world changed from virtually nil in the previous quarter to a deficit of $1.1 billion in the first quarter of 2017.
Real trade balance in surplus in March
In real (or volume) terms, exports were up 2.5% and imports edged down 0.2% in March. Canada's real trade balance therefore went from a deficit of $324 million in February to a surplus of $765 million in March.
After falling 4.1% in the last quarter of 2016, real imports increased 3.6% in the first quarter of 2017. Given that exports were relatively stable, Canada's real trade surplus narrowed from $5.6 billion in the previous quarter to $1.2 billion in the first quarter of 2017.
Minor revisions for February
Export and import data for February remained virtually unchanged in the March release.
Chart 2 Chart 2: International merchandise trade balance
International merchandise trade balance

FULL DOCUMENT: http://www.statcan.gc.ca/daily-quotidien/170504/dq170504a-eng.pdf
EDC. May 4, 2017. EXPORT PERFORMANCE MONITOR
After retreating in February, Canadian merchandise exports resumed growing in March, posting a 3.8% gain for the month. The growth was broad-based with 8 of 11 subsectors posting stronger exports and was a strong end to the first quarter of the year.
Growth in overall volumes contributed 2.5% to the increase in March while prices added an additional 1.3%. The biggest contributor to this growth was the energy sector (+7.0%) with exports of natural gas to the United States boosted by a colder than normal month and Canadian exports of coal increasing to fill a gap in global supplies caused by the effects of a cyclone closing Australian ports.
Other subsectors experiencing strong growth were the consumer goods (+6.8%) propelled by lentil exports to India, Metal and non-metallic mineral products (+7.1%) due to higher gold exports and aircraft and other transportation equipment (+8.6%). The value of industrial machinery and equipment exports (+1.3%) grew for the second consecutive month.
While exports of motor vehicles and parts (-1.8%) declined in March, Canadian imports of motor vehicles and parts, a leading indicators of eventual exports grew by 1.5%. Canadian imports of machinery and equipment (+4.1%) also increased, indicating growth in Canadian business investment spending.
With the March data, Canadian exports were 1.7% higher for the first quarter of 2017 than in the previous quarter.
FULL REPORT: http://www.edc.ca/EN/Knowledge-Centre/Economic-Analysis-and-Research/Documents/export-performance-monitor.pdf
EDC. KNOWLEDGE CENTER. Country Risk Quarterly
The Country Risk Quarterly is an electronic publication aimed at Canadian companies looking to explore high potential markets. It provides valuable information on over 100 countries, helping to inform trade and investment decisions. A mix of text and visual graphics present the reader with the risks and opportunities of doing business in Europe, Asia, Africa, the Middle East and the Americas, including key insights on payment experience and risk rating drivers.
Country Risk Quarterly - Executive Summary: http://www.edc.ca/EN/Knowledge-Centre/Economic-Analysis-and-Research/Documents/country-risk-quarterly-exec-summary.pdf
BLOOMBERG. 2017 M05 4. Natural Gas and Lentils Drive Canadian Exports to Record
by Greg Quinn
- Merchandise trade deficit narrows more than forecast in March
- Surplus with U.S. narrows, shipments to other countries rise
Canadian exports rebounded to a record high in March on energy and consumer goods such as red lentils, narrowing the trade deficit more than predicted.
The merchandise trade gap shrank to C$135 million ($98 million) from a revised C$1.08 billion in February, Statistics Canada said Thursday in Ottawa. Forecasts for the deficit ranged from C$550 million to C$1.8 billion, with a median of C$1 billion, according to a Bloomberg survey of economists.
Key Points
- Exports rose 3.8 percent to a record C$47 billion, rebounding from a 2.5 percent drop in February. Energy shipments climbed 7 percent to C$8.75 billion and consumer goods by 6.8 percent to C$6.12 billion, providing the largest upside contribution.
- Imports rose for a fourth straight month in March, by 1.7 percent to C$47.1 billion.
- The motor vehicle category was the biggest downside component, reducing exports by 0.3 percentage points.
- Canada’s trade surplus with the U.S. narrowed to C$4 billion from C$4.5 billion.
Big Picture
The world’s 10th largest economy needs a sustained jolt to escape the funk caused by the downturn in the energy industry. Bank of Canada Governor Stephen Poloz said last month the recovery is being held back by inconsistent exports and a dearth of business investment.
Erik Hertzberg/Bloomberg
Economist Reaction
- “This is a solid report overall,” Benjamin Reitzes, a Canadian rates and macro strategist at BMO Capital Markets in Toronto, wrote in a research note. “While trade continues to have trouble gaining consistent traction, the firm end to Q1 provides a nice handoff for Q2.”
- “The recent momentum in exports should continue, as the Canadian dollar remains under pressure” said Dina Ignjatovic, an economist at Toronto-Dominion Bank. “The key risk to the outlook remains any potential changes to trade policy with the United States.” Canada’s dollar has depreciated by 6.3 percent over the last 12 months against the greenback, while U.S. President Donald Trump has accused Canada of unfair trade in softwood lumber and dairy products in recent weeks.
Other Details
- Cold weather in the northeastern U.S. boosted Canada’s natural gas exports by 32 percent in March. The “other energy” category rose 64 percent, led by coal, as Cyclone Debbie disrupted production in Australia. Energy exports have climbed by 78 percent over the last 12 months.
- The “other food products” grouping rose 12 percent to a record C$1.4 billion on sales of yellow peas and red lentils to India.
- Record exports to non-U.S. nations narrowed the trade deficit for that group to C$4.1 billion from C$5.6 billion.
- The volume of exports advanced 2.5 percent and import volumes fell 0.2 percent, Statistics Canada said. Volume figures adjust for price changes and can be a better indicator of how trade contributes to economic growth.
- On a quarterly basis, the trade account worsened to a C$1.1 billion deficit between January and March after being roughly balanced in the prior three months.
REUTERS. May 4, 2017. Canada trade deficit narrows sharply in possible boost to first-quarter GDP
By David Ljunggren
OTTAWA (Reuters) - Canada's trade deficit narrowed sharply to just C$135 million ($99 million) in March as exports surged to a new high on shipments of energy products, an early sign the first quarter ended strongly.
Statistics Canada said on Thursday that the value of exports jumped by 3.8 percent to C$46.98 billion as volumes increased by 2.5 percent and prices grew by 1.3 percent.
Analysts in a Reuters poll had forecast a shortfall of C$800 million. Statscan revised February's deficit to C$1.08 billion from an initial C$972 million.
The Canadian economy stalled in February after a healthy start to the year, data showed last week.
"A strong first indicator on March GDP suggests there could be some decent momentum heading into the second quarter," CIBC economist Nick Exarhos said by phone.
The Canadian dollar strengthened slightly to C$1.3716 to the U.S. dollar, or 72.91 U.S. cents, up from C$1.3736, or 72.80 U.S. cents.
Energy products rose 7.0 percent, pushed up by higher natural gas flows to the United States and a spike in exports of coal to Asia that coincided with a slowdown in Australian production caused by a cyclone.
Imports grew 1.7 percent to C$47.11 billion on higher inward flows of metal and non-metallic mineral products, particularly unwrought gold from Japan. Volumes slipped by 0.2 percent while prices advanced by 1.9 percent.
"The increase in imports points to improvements in business investment spending and inventory rebuilding, both contributors to GDP," National Bank economist Krishen Rangasamy said in a note to clients.
Despite the cheery trade news, challenges may be ahead.
In April, the Bank of Canada lowered its export growth forecast to 2.5 percent over the next three months from around 3.0 percent in January due to the additional drag on global investment from uncertainty over U.S. trade policy.
Shortly afterwards, the U.S. administration slapped tariffs on Canadian exports of softwood lumber and complained about Canada's dairy sector, helping to sink the Canadian dollar to 14-month lows.
Exports to the United States, which accounted for 73.1 percent of all Canadian exports in March, edged up by 0.1 percent while imports increased by 2.0 percent. As a result, Canada's trade surplus with the United States slipped to C$3.97 billion from C$4.51 billion in February.
(Editing by Bernadette Baum)
CIBC. ECONOMICS RESEARCH. May 04, 2017. Canadian Exports Pop In March
FULL DOCUMENT: https://economics.cibccm.com/economicsweb/cds?ID=3018&TYPE=EC_PDF
BMO. ECONOMIC RESEARCH. ECONOFACT. An analysis of the latest economic data. May 4, 2017. Cdn. Merchandise Trade Balance — March
FULL DOCUMENT: https://economics.bmocapitalmarkets.com/economics/econofacts/20170504a/econofacts.pdf
TD BANK. TD Economics. Analysis of economic performance and the implications for investors. The analysis covers the globe, with emphasis on Canada, the United States, Europe and Asia. May 4, 2017. Canadian International Trade
FULL DOCUMENT: https://www.td.com/document/PDF/economics/comment/CanadianTrade_Mar2017.pdf
RBC. ECONOMICS. Daily Economic Update. May 4, 2017. Canadian March merchandise trade deficit unexpectedly shrinks to $0.1B
FULL DOCUMENT: http://www.rbc.com/economics/daily-economic-update/CA%20Trade_Mar2017.pdf
________________
GLOBAL AFFAIRS CANADA. TRADE. 2017-04-28. Consulting Canadians on a possible Canada-MERCOSUR Free Trade Agreement
http://www.international.gc.ca/trade-commerce/consultations/mercosur/index.aspx?lang=eng
Promoting trade and investment with emerging markets is a priority for the Government of Canada. The government's approach is one that puts the interests of Canadians and opportunities for the middle class, women, youth and Indigenous people, front and centre.
MERCOSUR, also known as the Southern Cone Common Market, is a customs union established by Argentina, Brazil, Paraguay and Uruguay in 1991. This regional bloc represents a significant economic presence in Latin America, and a considerable market for Canada.
In 2016, the four members of MERCOSUR had a combined GDP of US$2.4 trillion (CAD$3.2 trillion) and a population of 260 million. Bilateral merchandise trade between Canada and MERCOSUR totalled nearly $8.1 billion in 2016.
We are soliciting the views of the Canadian public and interested Canadian stakeholders to help define our priorities in a possible free trade agreement (FTA) with MERCOSUR (Argentina, Brazil, Paraguay and Uruguay).
- Information on the consultations: http://www.international.gc.ca/trade-commerce/consultations/mercosur/info.aspx?lang=eng
- Background and additional links: http://www.international.gc.ca/trade-commerce/consultations/mercosur/resources-ressources.aspx?lang=eng
- How do I participate? http://www.international.gc.ca/trade-commerce/consultations/mercosur/info.aspx?lang=eng#participate
The Global Export Forecast identifies the major forces acting on the world economy and their implications for Canadian exporters. It describes which sectors will offer the best opportunities for Canadian exporters for the two coming years, and analyzes the outlook by sector and destination. It also discusses the major risks and opportunities faced by exporters.
The Global Export Forecast is produced twice per year in May and November.
FULL DOCUMENT: http://www.edc.ca/EN/Knowledge-Centre/Economic-Analysis-and-Research/Documents/EDC-GEF_GEO%20Spring%202017_E.pdf
EXECUTIVE SUMMARY: http://www.edc.ca/EN/Knowledge-Centre/Economic-Analysis-and-Research/Documents/GEF-Spring%202017-Exec%20Summary_E.pdf
BANK OF CANADA. 4 May 2017. Canada and Mexico both set to capitalize on current opportunities, Bank of Canada Governor Poloz says
CanCham México and Club de Industriales
Canada and Mexico: Common Issues in Uncommon Times - Stephen S. Poloz, the Governor of the Bank of Canada, speaks before the CanCham México and Club de Industriales.
Mexico City, Mexico - Canada and Mexico share economic traits that leave both well placed to face global challenges and capitalize on opportunities, Bank of Canada Governor Stephen S. Poloz said today.
In a speech to CanCham México and the Club de Industriales, Governor Poloz showed how the similarities between Canada and Mexico—including their shared approach to monetary policy and the importance of industries such as oil and automobiles—have meant that global disruptions have hit the two economies in a similar way.
The plunge in oil prices that began in the second half of 2014 led to a major loss of income for both countries, the Governor noted. However, sound economic policies helped both adapt. “There is no doubt that the predictability and certainty that come from inflation targeting helped Canada’s economy respond as quickly as it has,” Governor Poloz said. “Mexico’s inflation-targeting framework helped make its economy relatively resilient to the shock as well.”
Canada and Mexico now face the common challenge of dealing with uncertainty in future US trade policy, particularly given the importance of that market to both economies. “This uncertainty has real consequences for companies,” Governor Poloz said. “When you consider that the painful memories of the global financial crisis are still fresh, it is not surprising that companies would continue to hesitate to expand.”
The Governor called on business and labour leaders to help policy-makers combat uncertainty by showing how open trade and economic integration have supported job creation across North America. “We know that with protectionism, everybody loses eventually, including the country that puts the policies in place,” Governor Poloz said. “And the uncertainty around this threat of increased protectionism is holding back growth.”
Governor Poloz also pointed to a number of ways that both countries can support growth and employment. These include pursuing free trade agreements outside North America—an area where Mexico has a significant head start over Canada—and domestic structural improvements. “Beyond pushing for open markets, governments can pursue structural policies that allow our economies to be as flexible as possible,” he said.
“We have faced obstacles before, and have overcome them,” Governor Poloz concluded. “Canada and Mexico’s shared commitment to open trade means both of our countries are well placed to thrive, whatever the international environment.”
REUTERS. May 4, 2017. Mexico, Canada seek U.S. soft spots to bolster NAFTA defense
By Dave Graham and David Ljunggren
MEXICO CITY/OTTAWA (Reuters) - From launching a data-mining drive aiming to find supply-chain pressure points to sending officials to mobilize allies in key U.S. states, Mexico and Canada are bolstering their defenses of a regional trade pact President Donald Trump vows to rewrite.
Trump has blamed the North American Free Trade Agreement (NAFTA) for the loss of millions of manufacturing jobs and has threatened to tear it up if he fails to get a better deal.
Fearing the massive disruptions a U.S. pullout could cause, the United States' neighbors and two biggest export markets have focused on sectors most exposed to a breakdown in free trade and with the political clout to influence Washington.
That encompasses many of the states that swept Trump to power in November and senior politicians such as Vice President Mike Pence, a former Indiana governor or Wisconsin representative and House Speaker Paul Ryan.
Prominent CEOs on Trump's business councils are also key targets, according to people familiar with the lobbying push.
Mexico, for example, has picked out the governors of Texas, Arizona and Indiana as potential allies.
Decision makers in Michigan, North Carolina, Minnesota, Illinois, Tennessee, Wisconsin, Ohio, Florida, Pennsylvania, Nebraska, California and New Mexico are also on Mexico's priority list, according to people involved in talks.
Mexican and U.S. officials and executives have had "hundreds" of meetings since Trump took office, said Moises Kalach, foreign trade chief of the Mexican private sector team leading the defense of NAFTA. (Graphic:tmsnrt.rs/2oYClp2)
Canada has drawn up a list of 11 U.S. states, largely overlapping with Mexico's targets, that stand to lose the most if the trade pact enacted in 1994 unravels.
To identify potential allies among U.S. companies and industries, Mexican business lobby Consejo Coordinador Empresarial (CCE) recruited IQOM, a consultancy led by former NAFTA negotiators Herminio Blanco and Jaime Zabludovsky.
In one case, the analysis found that in Indiana, one type of engine made up about a fifth of the state's $5 billion exports to Mexico. Kalach's team identified one local supplier of the product and put it touch with its main Mexican client.
"We said: talk to the governor, talk to the members of congress, talk to your ex-governor, Vice President Pence, and explain that if this goes wrong, the company is done," Kalach said. He declined to reveal the name of the company and Reuters could not immediately verify its identity.
Trump rattled the two nations last week when his administration said he was considering an executive order to withdraw from the trade pact, which has been in force since 1994. He later said he would try to renegotiate the deal first and Kalach said the lobbying effort deserved much credit for Trump's u-turn.
"There was huge mobilization," he said. "I can tell you the phone did not stop ringing in (Commerce Secretary Wilbur) Ross's office. It did not stop ringing in (National Economic Council Director) Gary Cohn's office, in the office of (White House Chief of Staff Reince) Priebus. The visits to the White House from pro-NAFTA allies did not stop all afternoon."
Among those calling the White House and other senior administration officials were U.S. Chamber of Commerce chief Tom Donohue, officials from the Business Roundtable and CEOs from both lobbies, according to people familiar with the discussions.
PRIME TARGET
Mexico has been the prime target of NAFTA critics, who blame it for lost manufacturing jobs and widening U.S. trade deficits. Canada had managed to keep a lower profile, concentrating on seeking U.S. allies in case of an open conflict.
That changed in late April when the Trump administration attacked Ottawa over support for dairy farmers and slapped preliminary duties on softwood lumber imports.
Despite an apparently weaker position - Canada and Mexico jointly absorb about a third of U.S. exports, but rely on U.S. demand for three quarters of their own - the two have managed to even up the odds in the past by exploiting certain weak spots.
When Washington clashed with Ottawa in 2013 over meat-labeling rules, Canada retaliated by targeting exports from the states of key U.S. legislators. A similar policy is again under consideration.
Mexico is taking a leaf out of a 2011 trucking dispute to identify U.S. interests that are most exposed, such as $2.3 billion of yellow corn exports.
Mexico is also targeting members of Trump advisory bodies, the Strategic and Policy Forum and the Manufacturing Council, led by Blackstone Group LP's Stephen Schwarzman and Dow Chemical Co boss Andrew Liveris respectively.
Senior Trump administration officials and Republican lawmakers in charge of trade, agriculture and finance committees also feature among top lobbying targets.
Canada has spread the task of lobbying the United States among ministries, official say, and is particularly keen to avoid disruption to the highly-integrated auto industry.
A core component of Mexico's strategy is to argue the three nations have a common interest in fending off Asian competition and exploring scope to source more content regionally.
The defenders of NAFTA also say that it supports millions of jobs in the United States, and point out that U.S. trade shortfalls with Canada and Mexico have declined over the past decade even as the deficit with China continued to climb.
Part of IQOM's mission is to identify sectors where NAFTA rules of origin could be modified to increase regional content.
For example, U.S., Canadian and Mexican officials are debating how the NAFTA region can reduce auto parts imports from China, Japan, South Korea or Germany, Mexican officials say.
"The key thing is to see how we can get a win-win on the products most used in our countries, and to develop common manufacturing platforms that allow us just to buy between ourselves the biggest amount of inputs we need," said Luis Aguirre, vice-president of Mexican industry group Concamin.
(Additional reporting by Michael O'Boyle Alexandra Alper, Ana Isabel Martinez, Ginger Gibson and Adriana Barrera; Editing by Tomasz Janowski)
GRAFICO: http://fingfx.thomsonreuters.com/gfx/rngs/USA-TRADE-MEXICO-CANADA/010040Z221S/index.html
________________
ANALYSIS
EDC. EDC WEEKLY COMMENTARY. MAY 4, 2017. Globalization at the Brink?
By Peter G Hall,
Vice President and
Chief Economist
This one is really big. It touches every region, every country, every firm. In fact, it is so big, it likely touches every individual on the planet. It has steadily grown into the fabric of everything we do, and to many, almost unnoticed. And now we are talking about undoing it all. It is hard to fully estimate the entire reach and impact of this thing we call globalization. And yet in our frustration with a sluggish post-recession economy that has left many behind, a slim majority seems to believe that globalization is the culprit. This development has rapidly zoomed up the global risk list, and currently occupies top spot. Is globalization over?
Undoing globalization would be very costly. That’s what makes it such a key risk. For decades now, consumers the planet over have benefited greatly from purchasing goods made in lower-cost locales. The cumulative savings globalization has brought to consumers everywhere are inestimable. Undoing that? The cost increases are at least as inestimable. A second cost is related. Globalization has lifted millions out of poverty, all the while helping wealthy nations achieve some of the lowest unemployment rates on recent record. Revert to an insular, localized economic system, and the net employment effect would be far lower. The case goes on; the gains from freer trade that accrue to countries efficiently exploiting their true comparative advantage are well documented in international trade literature.
So much for immediate costs; what about the logical feasibility of reversing globalization? First off, it’s a whole lot easier to impose trade-inhibiting policies than it is to gear up the domestic investment that replaces the interrupted trade flows. Regular folk might just run out of patience with the policies. Second, global trade connections have been enabled by a technology that is not going to disappear in a more protectionist world. Third, trade restrictions ultimately benefit those they are aimed at. Bent on survival, protectionism’s victims are forced to be ever-leaner and more competitive – far more than those resting behind a tariff wall. As such, trade restrictions are the ultimate enemy of those they purport to protect. Fourth, the voice of the shareholder has been strangely silent. When it starts to speak up, it is likely to cast its increasingly powerful vote for globalization. A fifth and weighty consideration is that a revisit of the architecture isn’t really needed now; ultimately, the dissenting votes are about making the economy great again – and that’s now happening, all on its own.
America is the best example. After a particularly long seven-year wait, key groups sidelined by sluggish growth – both older workers and millennials – are now rushing back into the job market. Industrial capacity is tightening up again, and several industries are bursting at the seams. With confidence riding high, business investment is set for a strong increase. The only thing standing in the way of solid total performance is greenback-inhibited exports.
Across the pond, the EU is catching on. Area-wide unemployment has declined steadily since mid-2013, and is now just 1.2 percentage points above the pre-recession low – quite an achievement. As in the U.S., labour force participation is on the rise again after a long lull. EU-wide capacity utilization is at its highest level since the Great Recession, one among several signs of pent-up demand in the market.
This is probably the best news emerging markets have seen in years. Tightening U.S. and EU markets can only mean better times on the export front in the emerging world, which will be a help to markets struggling with lack of capacity, over-capacity, softer commodity prices and rising borrowing costs.
Putting all this together, EDC’s Global Export Forecast calls for world growth to rise from 3.5 per cent in 2017 to 3.8 per cent next year. Canada’s exports are projected to increase by six per cent this year thanks to a bump in commodity prices, and by five per cent in 2018 as global growth accelerates.
The bottom line? Scan current data, and the global economy is serving up what the people say they really want: growth, jobs and a green light for continued expansion. But this isn’t 1983. Freer trade is now firmly embedded into the picture; dismantling that architecture puts today’s growth story at great risk. But if that risk is ultimately unlikely, this could be one of the greatest moments of opportunity in the New Millennium.
CIBC. ECONOMICS RESEARCH. May 04, 2017 - MONTHLY FX (CURRENCY) OUTLOOK
FULL DOCUMENT: https://economics.cibccm.com/economicsweb/cds?ID=3016&TYPE=EC_PDF
SCOTIA BANK. ECONOMICS PUBLICATION. May 3, 2017. Scotia Flash: Is The FOMC’s Bias As Transitory On Inflation As It Is On Growth?
FULL DOCUMENT: http://www.gbm.scotiabank.com/scpt/gbm/scotiaeconomics63/scotiaflash20170503A.pdf
TD BANK. TD Economics. Analysis of economic performance and the implications for investors. The analysis covers the globe, with emphasis on Canada, the United States, Europe and Asia. May 3, 2017. U.S. FOMC Statement
FULL DOCUMENT: https://www.td.com/document/PDF/economics/comment/USFOMC_Apr2017.pdf
RBC. ECONOMICS. Daily Economic Update. May 4, 2017. Fed holds rates steady; views Q1 slowdown as transitory
FULL DOCUMENT: http://www.rbc.com/economics/daily-economic-update/FOMC%20statement_May2017.pdf
TD BANK. TD Economics. Analysis of economic performance and the implications for investors. The analysis covers the globe, with emphasis on Canada, the United States, Europe and Asia. May 4, 2017. U.S. International Trade
FULL DOCUMENT: https://www.td.com/document/PDF/economics/comment/USTrade_Mar2017.pdf
RBC. ECONOMICS. Daily Economic Update. May 4, 2017. US trade balance was little changed in March but deficit increased in Q1
FULL DOCUMENT: http://www.rbc.com/economics/daily-economic-update/US%20Trade_Mar2017.pdf
________________
LGCJ.: