US ECONOMICS
CHINA
U.S. Department of State. 07/01/2020. Secretary of State Michael R. Pompeo With Bret Baier of Fox News Special Report. Michael R. Pompeo, Secretary of State. Washington, D.C.
QUESTION: For more on China, Hong Kong, and America’s role in the world, joining me now, Secretary of State Mike Pompeo. Mr. Secretary, thanks for being here.
SECRETARY POMPEO: Bret, thanks for having me on this evening. Great to be with you again.
QUESTION: We just heard you talk about the companies, American companies, warning them to keep forced labor out of their supply chains, pointing directly at China and these concentration camps, as described by the Defense Department. Will we see investigations and prosecutions of American businesses who don’t heed this warning?
SECRETARY POMPEO: Bret, President Trump has been very clear the way the previous administrations have dealt with the Chinese Communist Party by turning the other cheek and letting them abuse America is not going to continue, so we have responded across a number of fronts. So you identify one, this forced labor. Nobody wants to buy products, cheap products, that were made with slave labor in western China. They want clarity about the tracing of the product that they have. And so we’ve asked every business to evaluate their supply chain and make sure that nothing like that ever gets in, and we’ve put them on notice for actions that we may take as we move forward.
QUESTION: Now, last month President Trump told Axios that he held off sanctions – sanctioning Chinese officials involved with the mass detention camps because it would have interfered with his trade deal with China. Should those have been separated?
SECRETARY POMPEO: Well, Bret, I’ve been Secretary of State for two and a half years. No, there’s always complex tradeoffs that one has to make. President Trump has been very clear when he signed this bill, the Uyghur bill last week, that we were going to take this seriously, we were going to deal with it, we were going to put harsh restrictions in place. We’re working on that. No country has responded in the same way that we have. We hope the whole world will join.
What’s going on there, Bret, is historic. There is forced sterilization. They’re forcing women to have abortions. This is a place with some of the most fundamental violations of human rights that the world has seen in an awfully long time.
President Trump has been serious about making sure the world sees this, and we hope that countries all across the world, including Muslim countries in the world, will see their way clear to putting their shoulder to the grindstone to help resolve this problem as well.
QUESTION: I guess the question is: Should the President have done more? He had a lot of opportunities talking with President Xi.
SECRETARY POMPEO: There is no country that has done more and I’m confident will do more, Bret.
QUESTION: All right. In Hong Kong, we did the story there about the new security law in place. You’ve certified that Hong Kong is no longer sufficiently autonomous. Again, should the administration have acted more forcefully to deter Chinese crackdown in Hong Kong?
SECRETARY POMPEO: I’ll tell you, Bret, I wish the previous administration had taken China seriously. It’s truly – this isn’t partisan. Forty years of failed American policy with respect to China. This administration is trying to clean it up, trying to get it right. The Chinese have taken advantage of us in multiple ways.
We’ve done really good work, important work trying to protect the freedoms of the people of Hong Kong. General Secretary Xi has chosen to go a different direction, and we’re responding in a way that will put pressure on Beijing and try to maintain whatever we can of the remaining freedoms in Hong Kong. I will tell you the notion that there remains one country and two systems is fundamentally at odds with the facts on the ground today. I regret that.
QUESTION: You know that your critics, including now John Bolton, say that this was all about election politics and to get China to buy soybeans in places that affect re-election.
SECRETARY POMPEO: Nonsense.
QUESTION: Okay, that’s what we’ll get from that. What does success look like with China? The U.S. and China, what does it look like? Can China be a responsible partner with President Xi at the helm in the Chinese Communist Party?
SECRETARY POMPEO: Look, that’s up to the Chinese Communist Party. That’s their decision to make. What the United States can control is what we do. When there is unfair and nonreciprocal trade, we’re going to demand by – demand that it be right. And when they don’t do it, we’re going to do things like placing tariffs on their goods. When they engage in behavior that’s militarily threatening to the United States, we’re going to put $700 billion into our Department of Defense to keep Americans safe and secure. And when the Chinese engage in cyber espionage, we’re going to impose penalties on them such that they will be deterred from doing that. Those are the things we can do.
We are hopeful. We want the Chinese people to be successful. The Chinese Communist Party today has made a decision; it wants to be an imperialist power and wants to be authoritarian in nature, and it wants to compete across the world in ways that are inconsistent with the good things happening for the American people and, frankly, people of democracies all across the world. President Trump’s policies are aimed squarely at reversing that.
QUESTION: I want to spend some time on the Russia bounty story in Afghanistan. First, does the Russian Government have American blood on its hands in Afghanistan?
SECRETARY POMPEO: Bret, I don’t want to get into the intelligence. The Intelligence Community has put out two statements. I used to have that job. I’m going to honor what they’ve said.
Here’s what I can say with absolute certainly: The United States has responded appropriately to the threats that have been presented to it in Afghanistan consistently through my entire three and a half years, first as CIA director and now as Secretary of State. There are many folks using the Taliban or who have used the Taliban over years and years and years as proxy forces. There’s been money funneled in there from all across the world, unfortunately.
President Trump has taken this seriously. We are hopeful we’ll make progress on our peace and reconciliation plan, and we will respond to any threat, whether that’s Iranians using the Taliban or the Russians. We’ll make sure they know. The Russians have been providing weapons to the Taliban for an awful lot of years, and so this is an ongoing challenge we have. And our forces on the ground under General Miller and the Resolute Support mission are deeply aware of the threat from the Taliban, whether that’s supported by any third party or none.
QUESTION: You know – you just referenced you were CIA director – there’s not often consensus across the Intelligence Community on intel. I mean, if it dealt with bounties, killing American troops, shouldn’t the President have been told about it? We know that it was discussed in the National Security Council at the principals and the deputies level. You said today that key members of Congress had that intel as well, even though there wasn’t a consensus. Why wasn’t the President briefed on it?
SECRETARY POMPEO: Well, Bret, that’s actually not quite right. Most intelligence that’s read, there is, in fact, a consensus. Almost all of the analytical product that I read every day has a consensus across the entire Intelligence Community. It is often the case that it is not. That happens. When that happens, we need to make sure we get it right.
Look, Bret, you know this. Every morning I wake up and I read the intelligence materials. And when I read them, there are people all across the world who are threatened, including my officers at embassies all across the world. We don’t always make sure that gets to the President. We do the right thing. We make sure the ambassador on the ground knows, that the commander on the ground knows, that our allies who may be threatened as well know. It is the tactical and operational response to keep our soldiers safe and secure that is most important.
When the Intelligence Community feels like something rises to the level that needs to get to the President, I am very confident they will consistently present it to them. I know that when I was the CIA director, I did that.
QUESTION: Did you know about this particular intel piece?
SECRETARY POMPEO: I don’t want to talk about the intel in particular on this, Bret.
QUESTION: All right. Let me just —
SECRETARY POMPEO: I mean, there’s just – I just – I’m not trying to be clever. There’s just so much that has been reported that is not accurate and that is incomplete, that by refuting any particular element of it I am putting at risk our capacity to actually resolve and figure out what’s going on here.
QUESTION: And I want to ask you about that and the leak itself. But here is what the Democratic nominee is saying about it: “He either reads and/or gets briefed on important issues and forgets it, or he doesn’t think it’s necessary that he need to know it. He should at a minimum have picked up the phone and said, ‘Vladimir, old buddy, if any of this is true, and it does – then it seems to me that you’ve got a big problem.’”
All right. So it’s not just the Democrats, obviously. You have Senator Chuck Grassley on the Senate floor saying it demands a serious response. You have two key Republicans in the House, Mike McCaul and Adam Kinzinger, saying, “There are already those who are politicizing this issue, however we cannot use – let politics overshadow the truth that Republicans and Democrats alike can agree on: the Putin regime cannot be trusted. If the intelligence review process verifies the reports, we strongly encourage the administration to take swift and serious action to hold the Putin regime accountable.”
SECRETARY POMPEO: Bret, there’s been no administration to hold the Russians accountable in the way this one has. I only wish former Vice President Biden had held the Russians accountable. We’d have been cleaning up a lot less of a mess. I wish he’d provided arms to the Ukrainians. I wish he had gotten out of the INF Treaty. I wish he hadn’t allowed and invited the Syrians – the Russians into Syria.
I could go on, but you’ve got a short show. The failures of the previous administration allowed the Russians a lot of space to move. We’ve pushed back. We’ve sanctioned more Russians than any other administration in history. I’ll take a back seat to no one with respect to what our administration and President Trump has done to hold Vladimir Putin accountable when he is engaged in malign activity. And should we find out that there is evidence that he’s putting our soldiers, sailors, airmen, and Marines at risk anywhere in the world, including in Afghanistan, I am very confident that President Trump will direct me and he himself will respond appropriately.
QUESTION: How damaging was this leak? You were CIA director. The White House press secretary the other day said that there were rogue officers in the Intelligence Community who want to undercut the President. Do you believe that?
SECRETARY POMPEO: Bret, I don’t know where this leak came from. But when periodicals report this information, it breaks my heart, because it puts our intelligence officers and our military men and women at risk. It is dangerous. It is unlawful. And I hope that we can figure out who did it, and they’ll be brought to justice.
QUESTION: Mr. Secretary, you did speak out when it was alleged that Iran was paying the Taliban a thousand dollars for each American killed in Afghanistan as a member of Congress, and you spoke out about the Obama administration’s response at the time, which obviously you criticized in the overall Iran deal.
SECRETARY POMPEO: Yes, that’s absolutely true. I’ve spoken about the Iranians providing assistance to the Taliban in my current role as Secretary of State as well. I’ve criticized other governments. We’ve worked to make sure Pakistan wasn’t providing safe haven for the Taliban in Afghanistan, too. No, we’re equal opportunity when it comes to making sure we protect Americans wherever they are serving.
QUESTION: All right, let’s talk about a couple of other substantive things. One is you mentioned the Taliban peace deal. You said that the Taliban would publicly renounce al-Qaida. You talked about that. I asked you about it back in March. Take a listen:
QUESTION: “It says it will not allow any of its members or other individuals or groups, including al-Qaida, to use the soil of Afghanistan to threaten the security of the United States and its allies. But that’s not really a break; that’s not renouncing —
SECRETARY POMPEO: Oh, yeah. Oh, yeah.
QUESTION: A renouncing of al-Qaida?
SECRETARY POMPEO: Absolutely. Absolutely. When you say you’re not going to let them operate there, you know it, Bret. They’ve done it for 20 years. They’re not going to let them operate anymore. That’s – that is a central provision.”
You went further, saying that they would eventually take up arms and fight al-Qaida working alongside us to destroy al-Qaida. Have you seen any indication that the Taliban is doing any of that?
SECRETARY POMPEO: Yes.
QUESTION: How?
SECRETARY POMPEO: Bret, I can’t talk about the things that I have seen. But know this: I spoke with the Taliban again just this week in an effort to further the peace negotiations to try and get them to the table with the Afghan Government. I think we’re closer than we were even just a couple weeks back.
The Taliban continue to have impressed upon them the importance of this break from al-Qaida, and I think we will be able to see when we get to that point. When we have these negotiations commence, I think the world will be able to see that the Taliban are no longer going to tolerate what they have permitted to happen and that the Pakistanis too will do the things that need to be done to reduce the footprint from al-Qaida.
Remember, Bret, we’re down to a couple of hundred active al-Qaida fighters inside of Afghanistan. The reason we went there in 2001 was to crush al-Qaida. That has largely been achieved.
QUESTION: Can you confidently state that America will have U.S. troops in Afghanistan on Election Day?
SECRETARY POMPEO: The President will ultimately make that decision, Bret.
QUESTION: Okay, one more thing, the EU blocking travelers from the U.S. due to the coronavirus pandemic. Your reaction to that, and is there any pushback from the U.S.?
SECRETARY POMPEO: Well, remember, we’re not allowing Europeans to come here today either, Bret. We’re in close conversation with countries all around the world, including European countries, to make sure that when we reopen our country to travel from their nations that we do so in a way that keeps American people safe and reduces risk from COVID here in the United States. They have a responsibility to do that for their nations as well.
And I have every confidence that we’ll get this right with countries all across the world. It’s not just the Europeans. We need to get this right. We need to get the economy back open and get people traveling all across the United States and international travel as well.
QUESTION: Mr. Secretary, we appreciate your time.
SECRETARY POMPEO: Thank you.
QUESTION: Happy Independence Day early.
SECRETARY POMPEO: Thank you. Happy Fourth of July to you too, Bret.
QUESTION: All right, all the best.
EMPLOYMENT
DoL. BLS. July 2, 2020. THE EMPLOYMENT SITUATION, JUNE 2020
Total nonfarm payroll employment rose by 4.8 million in June, and the unemployment rate
declined to 11.1 percent, the U.S. Bureau of Labor Statistics reported today. These
improvements in the labor market reflected the continued resumption of economic activity
that had been curtailed in March and April due to the coronavirus (COVID-19) pandemic
and efforts to contain it. In June, employment in leisure and hospitality rose sharply.
Notable job gains also occurred in retail trade, education and health services, other
services, manufacturing, and professional and business services.
This news release presents statistics from two monthly surveys. The household survey
measures labor force status, including unemployment, by demographic characteristics.
The establishment survey measures nonfarm employment, hours, and earnings by industry.
For more information about the concepts and statistical methodology used in these two
surveys, see the Technical Note.
Household Survey Data
The unemployment rate declined by 2.2 percentage points to 11.1 percent in June, and
the number of unemployed persons fell by 3.2 million to 17.8 million. Although
unemployment fell in May and June, the jobless rate and the number of unemployed are up
by 7.6 percentage points and 12.0 million, respectively, since February. (See table A-1.
For more information about how the household survey and its measures were affected by
the coronavirus pandemic, see the box note at the end of the news release.)
Among the major worker groups, the unemployment rates declined in June for adult men
(10.2 percent), adult women (11.2 percent), teenagers (23.2 percent), Whites (10.1
percent), Blacks (15.4 percent), and Hispanics (14.5 percent). The jobless rate for
Asians (13.8 percent) changed little over the month. (See tables A-1, A-2, and A-3.)
The number of unemployed persons who were on temporary layoff decreased by 4.8 million
in June to 10.6 million, following a decline of 2.7 million in May. The number of
permanent job losers continued to rise, increasing by 588,000 to 2.9 million in June.
The number of unemployed reentrants to the labor force rose by 711,000 to 2.4 million.
(Reentrants are persons who previously worked but were not in the labor force prior to
beginning their job search.) (See table A-11.)
The number of unemployed persons who were jobless less than 5 weeks declined by 1.0
million to 2.8 million in June. Unemployed persons who were jobless 5 to 14 weeks
numbered 11.5 million, down by 3.3 million over the month, and accounted for 65.2
percent of the unemployed. By contrast, the number of persons jobless 15 to 26 weeks
and the long-term unemployed (those jobless for 27 weeks or more) saw over-the-month
increases (+825,000 to 1.9 million and +227,000 to 1.4 million, respectively). (See
table A-12.)
The labor force participation rate increased by 0.7 percentage point in June to 61.5
percent, but is 1.9 percentage points below its February level. Total employment, as
measured by the household survey, rose by 4.9 million to 142.2 million in June. The
employment-population ratio, at 54.6 percent, rose by 1.8 percentage points over the
month but is 6.5 percentage points lower than in February. (See table A-1.)
In June, the number of persons who usually work full time increased by 2.4 million to
118.9 million, and the number who usually work part time also rose by 2.4 million to
23.2 million. (See table A-9.)
The number of persons employed part time for economic reasons declined by 1.6 million
to 9.1 million in June but is still more than double its February level. These
individuals, who would have preferred full-time employment, were working part time
because their hours had been reduced or they were unable to find full-time jobs. This
group includes persons who usually work full time and persons who usually work part
time. (See table A-8.)
The number of persons not in the labor force who currently want a job, at 8.2 million,
declined by 767,000 in June but remained 3.2 million higher than in February. These
individuals were not counted as unemployed because they were not actively looking for
work during the last 4 weeks or were unavailable to take a job. (See table A-1.)
Persons marginally attached to the labor force--a subset of persons not in the labor
force who currently want a job--numbered 2.5 million in June, little different from the
prior month. These individuals were not in the labor force, wanted and were available
for work, and had looked for a job sometime in the prior 12 months but had not looked
for work in the 4 weeks preceding the survey. Discouraged workers, a subset of the
marginally attached who believed that no jobs were available for them, numbered 681,000
in June, essentially unchanged from the previous month. (See Summary table A.)
Establishment Survey Data
Total nonfarm payroll employment increased by 4.8 million in June, following an increase
of 2.7 million in May. These gains reflect a partial resumption of economic activity
that had been curtailed due to the coronavirus pandemic in April and March, when
employment fell by a total of 22.2 million in the 2 months combined. In June, nonfarm
employment was 14.7 million, or 9.6 percent, lower than its February level. Employment
in leisure and hospitality rose sharply in June. Notable job gains also occurred in
retail trade, education and health services, other services, manufacturing, and
professional and business services. Employment continued to decline in mining. (See
table B-1. For more information about how the establishment survey and its measures
were affected by the coronavirus pandemic, see the box note at the end of the news
release.)
In June, employment in leisure and hospitality increased by 2.1 million, accounting
for about two-fifths of the gain in total nonfarm employment. Over the month,
employment in food services and drinking places rose by 1.5 million, following a gain
of the same magnitude in May. Despite these gains, employment in food services and
drinking places is down by 3.1 million since February. Employment also rose in June
in amusements, gambling, and recreation (+353,000) and in the accommodation industry
(+239,000).
In June, employment in retail trade rose by 740,000, after a gain of 372,000 in May
and losses totaling 2.4 million in March and April combined. On net, employment in the
industry is 1.3 million lower than in February. In June, notable job gains occurred in
clothing and clothing accessories stores (+202,000), general merchandise stores
(+108,000), furniture and home furnishings stores (+84,000), and motor vehicle and
parts dealers (+84,000).
Employment increased by 568,000 in education and health services in June but is 1.8
million below February's level. Health care employment increased by 358,000 over the
month, with gains in offices of dentists (+190,000), offices of physicians (+80,000),
and offices of other health practitioners (+48,000). Elsewhere in health care, job
losses continued in nursing care facilities (-18,000). Employment increased in the
social assistance industry (+117,000), reflecting gains in child day care services
(+80,000) and in individual and family services (+28,000). Employment in private
education rose by 93,000 over the month.
Employment increased in the other services industry in June (+357,000), with about
three-fourths of the increase occurring in personal and laundry services (+264,000).
Since February, employment in the other services industry is down by 752,000.
In June, manufacturing employment rose by 356,000 but is down by 757,000 since
February. June employment increases were concentrated in the durable goods component,
with motor vehicles and parts (+196,000) accounting for over half of the job gain in
manufacturing. Employment also increased over the month in miscellaneous durable
goods manufacturing (+26,000) and machinery (+18,000). Within the nondurable goods
component, the largest job gain occurred in plastics and rubber products (+22,000).
Professional and business services added 306,000 jobs in June, but employment is 1.8
million below its February level. In June, employment rose in temporary help services
(+149,000), services to buildings and dwellings (+53,000), and accounting and
bookkeeping services (+18,000). By contrast, employment declined in computer systems
design and related services (-20,000).
Construction employment increased by 158,000 in June, following a gain of 453,000 in
May. These gains accounted for more than half of the decline in March and April
(-1.1 million combined). Over-the-month gains occurred in specialty trade contractors
(+135,000), with growth about equally split between the residential and nonresidential
components. Job gains also occurred in construction of buildings (+32,000).
Transportation and warehousing added 99,000 jobs in June, following declines in the
prior 2 months (-588,000 in April and May combined). In June, employment rose in
warehousing and storage (+61,000), couriers and messengers (+21,000), truck
transportation (+8,000), and support activities for transportation (+7,000).
Wholesale trade employment rose by 68,000 in June but is down by 317,000 since
February. In June, job gains occurred in the durable goods (+39,000) and nondurable
goods (+27,000) components.
Financial activities added 32,000 jobs in June, with over half of the gain in real
estate (+18,000). Since February, employment in financial activities is down by
237,000.
Government employment changed little in June (+33,000), as job gains in local
government education (+70,000) were partially offset by job losses in state government
(-25,000). Government employment is 1.5 million below its February level.
Mining continued to lose jobs in June (-10,000), with most of the decline occurring in
support activities for mining (-7,000). Mining employment is down by 123,000 since a
recent peak in January 2019, although nearly three-fourths of the decline has occurred
since February 2020.
In June, average hourly earnings for all employees on private nonfarm payrolls fell by
35 cents to $29.37. Average hourly earnings of private-sector production and
nonsupervisory employees decreased by 23 cents to $24.74 in June. The decreases in
average hourly earnings largely reflect job gains among lower-paid workers; these
changes put downward pressure on the average hourly earnings estimates. (See tables
B-3 and B-8.)
The average workweek for all employees on private nonfarm payrolls decreased by 0.2
hour to 34.5 hours in June. In manufacturing, the workweek rose by 0.5 hour to 39.2
hours, and overtime was unchanged at 2.4 hours. The average workweek for production
and nonsupervisory employees on private nonfarm payrolls fell by 0.2 hour to 33.9
hours. The recent employment changes, especially in industries with shorter workweeks,
complicate monthly comparisons of the average weekly hours estimates. (See tables B-2
and B-7.)
The change in total nonfarm payroll employment for April was revised down by 100,000,
from -20.7 million to -20.8 million, and the change for May was revised up by 190,000,
from +2.5 million to +2.7 million. With these revisions, employment in April and May
combined was 90,000 higher than previously reported. (Monthly revisions result from
additional reports received from businesses and government agencies since the last
published estimates and from the recalculation of seasonal factors.)
FULL DOCUMENT: https://www.bls.gov/news.release/pdf/empsit.pdf
INTERNATIONAL TRADE
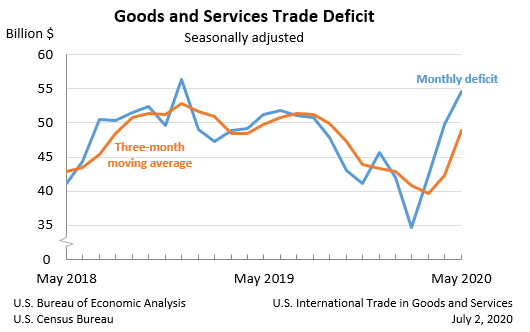
DoC. BEA. July 2, 2020. U.S. International Trade in Goods and Services, May 2020
The U.S. Census Bureau and the U.S. Bureau of Economic Analysis announced today that the goods and services deficit was $54.6 billion in May, up $4.8 billion from $49.8 billion in April, revised.
| Deficit: | $54.6 Billion | +9.7%° |
| Exports: | $144.5 Billion | -4.4%° |
| Imports: | $199.1 Billion | -0.9%° |
Next release: August 5, 2020
(°) Statistical significance is not applicable or not measurable. Data adjusted for seasonality but not price changes
Source: U.S. Census Bureau, U.S. Bureau of Economic Analysis; U.S. International Trade in Goods and Services, July 2, 2020
| ||
Coronavirus (COVID-19) Impact on May 2020 International Trade in Goods and Services
The declines in exports and imports that continued in May were, in part, due to the impact of COVID-19, as many businesses were operating at limited capacity or ceased operations completely, and the movement of travelers across borders was restricted. The full economic effects of the COVID-19 pandemic cannot be quantified in the trade statistics for May because the impacts are generally embedded in source data and cannot be separately identified. The Census Bureau and the Bureau of Economic Analysis have monitored data quality and determined estimates in this release meet publication standards. For more information on the impact of COVID-19 on the statistics, see the frequently asked questions on goods from the Census Bureau and on services from BEA.
Exports, Imports, and Balance (exhibit 1)
May exports were $144.5 billion, $6.6 billion less than April exports. May imports were $199.1 billion, $1.8 billion less than April imports.
The May increase in the goods and services deficit reflected an increase in the goods deficit of $4.2 billion to $76.1 billion and a decrease in the services surplus of $0.6 billion to $21.5 billion.
Year-to-date, the goods and services deficit decreased $22.3 billion, or 9.1 percent, from the same period in 2019. Exports decreased $148.3 billion or 14.0 percent. Imports decreased $170.6 billion or 13.1 percent.
Three-Month Moving Averages (exhibit 2)
The average goods and services deficit increased $6.6 billion to $48.9 billion for the three months ending in May.
Average exports decreased $22.4 billion to $161.9 billion in May.
Average imports decreased $15.8 billion to $210.8 billion in May.
Year-over-year, the average goods and services deficit decreased $0.9 billion from the three months ending in May 2019.
Average exports decreased $49.8 billion from May 2019.
Average imports decreased $50.7 billion from May 2019.
Exports (exhibits 3, 6, and 7)
Exports of goods decreased $5.5 billion to $90.0 billion in May.
Exports of goods on a Census basis decreased $5.6 billion.
Industrial supplies and materials decreased $3.9 billion.
Other petroleum products decreased $1.6 billion.
Crude oil decreased $0.7 billion.
Fuel oil decreased $0.6 billion.
Capital goods decreased $0.9 billion.
Semiconductors decreased $0.4 billion.
Computer accessories decreased $0.3 billion.
Net balance of payments adjustments increased $0.1 billion.
Exports of services decreased $1.1 billion to $54.5 billion in May.
Other business services decreased $0.6 billion.
Financial services decreased $0.2 billion.
Charges for the use of intellectual property decreased $0.2 billion.
Imports (exhibits 4, 6, and 8)
Imports of goods decreased $1.3 billion to $166.0 billion in May.
Imports of goods on a Census basis decreased $1.0 billion.
Automotive vehicles, parts, and engines decreased $4.4 billion.
Passenger cars decreased $3.0 billion.
Automotive parts and accessories decreased $0.6 billion.
Trucks, buses, and special purpose vehicles decreased $0.4 billion.
Capital goods decreased $0.6 billion.
Computers decreased $0.4 billion.
Industrial supplies and materials increased $2.3 billion.
Nonmonetary gold increased $1.2 billion.
Finished metal shapes increased $1.2 billion.
Consumer goods increased $1.9 billion.
Other textile apparel and household goods increased $1.8 billion.
Cell phones and other household goods increased $1.2 billion.
Net balance of payments adjustments decreased $0.3 billion.
Imports of services decreased $0.5 billion to $33.1 billion in May.
Charges for the use of intellectual property decreased $0.2 billion.
Other business services decreased $0.1 billion.
Travel decreased $0.1 billion.
Financial services decreased $0.1 billion.
Real Goods in 2012 Dollars – Census Basis (exhibit 11)
The real goods deficit increased $6.0 billion to $86.5 billion in May.
Real exports of goods decreased $6.7 billion to $106.8 billion.
Real imports of goods decreased $0.7 billion to $193.3 billion.
Revisions
Revisions to April exports
Exports of goods were revised down less than $0.1 billion.
Exports of services were revised down $0.1 billion.
Revisions to April imports
Imports of goods were revised down less than $0.1 billion.
Imports of services were revised up $0.2 billion.
Goods by Selected Countries and Areas: Monthly – Census Basis (exhibit 19)
The May figures show surpluses, in billions of dollars, with South and Central America ($1.9), Brazil ($0.4), OPEC ($0.4), United Kingdom ($0.2), and Hong Kong ($0.1). Deficits were recorded, in billions of dollars, with China ($27.9), European Union ($12.7), Mexico ($4.2), Germany ($3.9), Japan ($3.2), Taiwan ($2.6), South Korea ($1.9), Singapore ($1.6), Italy ($1.4), Canada ($1.2), France ($1.1), India ($0.7), and Saudi Arabia ($0.1).
The deficit with China increased $1.9 billion to $27.9 billion in May. Exports increased $0.7 billion to $10.0 billion and imports increased $2.7 billion to $37.9 billion.
The surplus with members of OPEC decreased $1.0 billion to $0.4 billion in May. Exports decreased $0.5 billion to $2.4 billion and imports increased $0.5 billion to $2.1 billion.
The deficit with the European Union decreased $1.6 billion to $12.7 billion in May. Exports decreased $1.0 billion to $14.9 billion and imports decreased $2.6 billion to $27.6 billion.
FULL DOCUMENT: https://www.bea.gov/sites/default/files/2020-07/trad0520_0.pdf
DoC. U.S. Census Bureau. 07/02/2020. U.S. International Trade in Goods and Services
The nation's international trade deficit in goods and services increased to $54.6 billion in May from $49.8 billion in April (revised), as exports decreased more than imports.
- May 2020: 54.6° $ billion
- April 2020 (r): 49.8° $ billion
(*) The 90% confidence interval includes zero. The Census Bureau does not have sufficient statistical evidence to conclude that the actual change is different from zero.
(°) Statistical significance is not applicable or not measurable for these surveys. The Manufacturers’ Shipments, Inventories and Orders estimates are not based on a probability sample, so we can neither measure the sampling error of these estimates nor compute confidence intervals.
(r) Revised.
All estimates are seasonally adjusted except for the Rental Vacancy Rate, Home Ownership Rate, Quarterly Financial Report for Retail Trade, and Quarterly Services Survey. None of the estimates are adjusted for price changes.
INDUSTRY
DoC. REUTERS. 2 DE JULHO DE 2020. Encomendas à indústria dos EUA se recuperam em maio
WASHINGTON (Reuters) - As novas encomendas de produtos fabricados nos Estados Unidos se recuperaram em maio, sugerindo uma virada na indústria, embora os gastos das empresas devam recuar de novo no segundo trimestre em meio ao petróleo mais barato conforme a pandemia de Covid-19 afeta o crescimento global.
O Departamento do Comércio informou nesta quinta-feira que as encomendas à indústria subiram 8,0% depois de recuarem 13,5% em abril. Economistas consultados pela Reuters previam aumento de 8,9% em maio.
Na base anual, as encomendas recuaram 10,3% em maio.
A indústria, que responde por 11% da atividade econômica dos EUA, parece estar se recuperando, mas um aumento nos casos de coronavírus em meio à reabertura das empresas ameaça a recuperação.
Reportagem de Lucia Mutikani
________________
ORGANISMS
GLOBAL ECONOMY

Dear reader,
In light of the coming long weekend in the United States, your IMF Weekend Read has arrived a day early. In today's edition we focus on the state of the global economy, regional economic outlooks for Latin America, Asia, Sub-Saharan Africa, and the Middle East, lessons from Vietnam on tackling COVID-19, new opportunities for digital financial inclusion and much more. On that note, let's dive right in.
But first, as a subscriber, you will soon be able to participate in exclusive live events hosted by the IMF with world-leading experts from inside and outside the institution—covering a wide range of pressing economic, finance, development and policy issues.
STATE OF THE GLOBAL ECONOMY
Last week we released our World Economic Outlook Update for June, which downgraded the April forecast—pegging global growth at -4.9 percent this year, down from -3 percent in April. Next year’s growth is forecast to be 5.4 percent.
Discussing these figures and more, Managing Director Kristalina Georgieva spoke to Financial Times Africa Editor David Pilling in a new 23-min video interview about the economic uncertainty caused by the coronavirus crisis, how Africa is in danger after a period of growth, and how the IMF is supporting countries through this crisis. For a look at the global outlook for the business community, take some time and watch MD Georgieva's recent 45-min conversation with the Harvard Business Review.
And for a more detailed discussion on how COVID-19 has upended the global economy across the board, watch a new 50-min interview with Chief Economist Gita Gopinath—hosted earlier this week—by the Center for Strategic & International Studies.
OUTLOOK FOR LATIN AMERICA AND THE CARIBBEAN
Latin America and the Caribbean have become the new COVID-19 global epicenter. The human cost has been tragic, with over 100,000 lives lost. The economic toll has also been steep. Our World Economic Outlook Update now estimates the region to shrink by 9.4 percent in 2020, four percentage points worse than the April projection and the worst recession on record. A mild recovery to +3.7 percent is projected in 2021.
The rates of COVID-19 infections and deaths per capita are approaching those in Europe and the United States, with the total number of cases accounting for about 25 percent of the worldwide total. Against this backdrop, countries should be very cautious when considering reopening their economies and allow science and data to guide the process. Indeed, many countries in the region have high levels of informality and low preparedness to handle new outbreaks, like a high occupancy of intensive care unit beds and low testing and tracing capacity.
The full blog by Director of the Western Hemisphere Department Alejandro Werner, which includes several charts visualizing the impact of COVID-19 on the region and three policy priorities for how best to proceed. There are also specific insights with respect to Argentina, Brazil, Chile, Colombia, Mexico, Peru, Central America, Panama & the Dominican Republic, as well as the Caribbean.
ASIA'S REOPENING AND RECOVERY
For the first time in living memory, Asia’s growth is expected to contract by 1.6 percent—a downgrade to the April projection of zero growth. While Asia’s economic growth in the first quarter of 2020 was better than projected in the April World Economic Outlook—partly owing to early stabilization of the virus in some—projections for 2020 have been revised down for most of the countries in the region due to weaker global conditions and more protracted containment measures in several emerging economies.
In the absence of a second wave of infections and with unprecedented policy stimulus to support the recovery, growth in Asia is projected to rebound strongly to 6.6 percent in 2021. But even with this fast pickup in economic activity, output losses due to COVID-19 are likely to persist. We project Asia’s economic output in 2022 to be about 5 percent lower compared with the level predicted before the crisis; and this gap will be much larger if we exclude China, where economic activity has already started to rebound.
Our projections for 2021 and beyond assume a strong rebound in private demand; however, this may be optimistic for several reasons: slower growth in trade, longer than expected lockdowns, rising inequality, and both weak balance sheets and geopolitical tensions.
LESSONS FROM VIETNAM ON CONTAINING COVID-19
At the outset, it was expected to be an uphill battle. Vietnam was regarded as highly vulnerable, given its long border and extensive trade with China, densely populated urban areas, and limited healthcare infrastructure. But Vietnam’s cost-effective containment strategy resulted in only 352 confirmed cases and no deaths in a population of almost 100 million people. The country was among the first to lift virtually all domestic containment measures.
Vietnam’s successful strategy was informed by its experience with previous outbreaks, like the Severe Acute Respiratory Syndrome, or SARS, in 2003. Early on, the Prime Minister prioritized health above economic concerns. The strategy was swiftly deployed with the help of the military, public security services, and grass-root organizations, which speaks to some features unique to Vietnam. Effective and transparent communications won the population’s buy-in, and contains broader lessons for developing countries.
Read more in IMF Country Focus. Have your headphones? Listen to a new 14-minute podcast with IMF economists Era Dabla-Norris and Anne-Marie Gulde of the Asia Pacific Department on why Vietnam's approach should allow for a quicker rebound.
SUB-SAHARAN AFRICA’S SHARPEST ECONOMIC DECLINE SINCE THE 1970'S
In our latest Regional Economic Outlook for sub-Saharan Africa, Real GDP is now forecast to contract by 3.2 percent, double the contraction predicted in April. On average, per capita incomes across the region will fall by 5.5 percent in 2020, back to levels last seen nearly a decade ago. This will likely lead to more poverty and widen income inequality as lockdowns disproportionally affect informal sector workers and small- and medium-sized companies in the services sectors. Regional policies should remain focused on safeguarding public health, supporting people and businesses hardest hit by the crisis, and facilitating the recovery.
For example, shortly after the region’s 100th case on March 15, many country authorities proactively implemented strict containment measures to control the COVID-19 outbreak. These measures led to more people staying home and reducing daily movements to areas with services and recreational facilities, including the informal economy. The growth of new cases has slowed somewhat since, and a number of countries have cautiously eased some of their containment measures. But region-wide, the pandemic is still in its exponential phase with more than a quarter of a million confirmed cases, and infection cases doubling every 2-3 weeks.
Click here to view six charts that tell a visual story of how COVID-19 has impacted sub-Saharan Africa. For more, you can download the report, read the press release and watch the 30-min Q&A press conference.
If you're wondering what impact COVID-19 has had specifically on Africa's energy sector, I would encourage you to read this speech from earlier this week by Director of the African Department Abebe Aemro Selassie to the IEA Africa Ministerial Roundtable.
OUTLOOK FOR THE MIDDLE EAST AND CENTRAL ASIA
The Gulf states' economies could contract by 7.6 percent this year in their deepest decline in decades, as COVID-19 and low oil prices take their toll. The new IMF projection for the six-nation Gulf Cooperation Council (GCC) is dramatically worse than the 2.7 percent contraction we forecast just two months ago. Oil revenues in the GCC, which supply nearly a fifth of the world's crude, are also expected to decline by $200 billion in 2020, said Director of the Middle East and Central Asia Department Jihad Azour in a virtual economic forum on the prospects for recovery in the region.
However, Azour predicted a faster rebound in 2021 as Gulf economies grow by 2.5 percent—a full 10 percent turnaround—but that the sharp drop in oil prices and the impact of the pandemic would lead to more debt in GCC economies. Last week, the IMF projected the Saudi economy, the largest in the region, would shrink by 6.8 percent—the lowest growth in more than three decades. A more detailed regional economic outlook will be released in the coming weeks.
If you're wondering about the outlook for Central Asia given the crisis, watch this just-released 15-min interview between Jihad Azour with Lyazzat Shatayeva of Kazakh TV.
A NEW INDEX OF DIGITAL FINANCIAL INCLUSION
The pandemic could be a game changer for digital financial services. Low-income households and small firms can benefit greatly from advances in mobile money, fintech services, and online banking. Financial inclusion as a result of digital financial services can also boost economic growth. While the pandemic is set to increase use of these services, it has also posed challenges for the growth of the industry’s smaller players and highlighted unequal access to digital infrastructure.
Many countries (for example, Liberia, Ghana, Kenya, Kuwait, Myanmar, Paraguay and Portugal) are supporting this shift with measures such as lowering fees and increasing limits on mobile money transactions.
Moreover, in a new study, we introduce a new index of digital financial inclusion that measures the progress in 52 emerging market and developing economies. We found that digitalization increased financial inclusion between 2014 and 2017, even where financial inclusion through traditional banking services was declining. This is likely to have progressed more since then. For more details, click here to read the full blog by the IMF's Ulric Eriksson von Allmen, Purva Khera, Sumiko Ogawa, and Ratna Sahay.
Still, Internet usage remains a luxury: half of the world’s population does not have access to the Internet, either through a mobile device or through fixed line broadband. Countries in sub-Saharan Africa, followed by many in emerging and developing economies in Asia, are among those with the lowest access to the Internet despite being world leaders in mobile money transactions. There is also a large variation in Internet connectivity by firms in sub-Saharan Africa—only about 60 percent of businesses use email for business compared to about 85 percent in Europe and Central Asia. For more, view our latest Chart of the Week on Internet inequality.
REMITTANCES TO FALL BY $100 BILLION IN 2020
COVID-19 is crippling the economies of rich and poor countries alike. Yet for many low-income and fragile states, the economic shock will be magnified by the loss of remittances, which represent a lifeline that supports households as well as provides much-needed tax revenue. In a new article for F&D, Deputy Managing Director Antoinette Sayeh and Assistant Director in the Institute for Capacity Development Ralph Chami dig deeper into how the pandemic threatens to dry up this vital source of income, and what measures can be taken to tackle this challenge.
As of 2018, remittance flows to low-income and fragile states reached $350 billion, surpassing foreign direct investment, portfolio investment, and foreign aid as the single most important source of income from abroad. A drop in remittance flows is likely to heighten economic, fiscal, and social pressures on governments of these countries already struggling to cope even in normal times. And according to the World Bank, remittance flows are expected to drop by about $100 billion in 2020, which represents roughly a 20 percent drop from their 2019 level.
IMF AND COVID-19
We just updated our global policy tracker to help our member countries be more aware of the experiences of others in combating COVID-19, and we are regularly updating our lending tracker, which visualizes the latest emergency financial assistance and debt relief to member countries approved by the IMF’s Executive Board.
To date, 72 countries will have been approved for emergency financing, totaling about US$25.3 billion. Looking for our latest Q&A about the IMF's response to COVID-19? Click here. We are also continually producing a special series of notes—around 50 to date—by IMF experts to help members address the economic effects of COVID-19 on a range of topics including fiscal, legal, statistical, tax and more. The most recent additions include a focus on food markets during COVID-19, budgeting in crisis, and digital financial services and the pandemic.
FINAL THOUGHT
Thank you again very much for your interest in the Weekend Read. We really appreciate your time. If you have any questions, comments or feedback of any kind.
FULL DOCUMENT: https://content.govdelivery.com/accounts/USIMF/bulletins/292bf80
________________
ECONOMIA BRASILEIRA / BRAZIL ECONOMICS
INFLAÇÃO
FGV. IBRE. 02/07/2020. Inflação pelo IPC-S encerra junho com avanço em todas as capitais pesquisadas
O IPC-S de 30 de junho de 2020 subiu 0,36%, ficando 0,27 ponto percentual (p.p.) acima da taxa divulgada na última apuração. Todas as sete capitais pesquisadas registraram acréscimo em suas taxas de variação.
A tabela a seguir, apresenta as variações percentuais dos municípios das sete capitais componentes do índice, nesta e nas apurações anteriores.

DOCUMENTO: https://portalibre.fgv.br/noticias/inflacao-pelo-ipc-s-encerra-junho-com-avanco-em-todas-capitais-pesquisadas
USP. FIPE. 2 DE JULHO DE 2020. Alimentação e habitação pressionam e IPC-Fipe passa a subir 0,39% em junho
SÃO PAULO (Reuters) - O Índice de Preços ao Consumidor (IPC) de São Paulo fechou junho com alta de 0,39 por cento, após queda de 0,24 por cento no mês anterior, pressionado pelos preços de alimentação e habitação.
Os dados divulgados nesta quinta-feira pela Fundação Instituto de Pesquisas Econômicas (Fipe) mostraram que os preços de Alimentação avançaram 0,69% no mês, exercendo o maior peso individual sobre o índice. Em maio, o grupo havia subido 0,66%.
Também contribuiu com força a alta de 0,45% dos preços de Habitação, após queda de 0,12% em maio.
O único grupo a apresentar recuo dos preços em junho foi Vestuário, de 0,86%, desacelerando a queda de 1,22% no mês anterior.
O IPC-Fipe mede as variações quadrissemanais dos preços às famílias paulistanas com renda mensal entre 1 e 10 salários mínimos.
Veja abaixo as variações dos grupos em junho na comparação com o mês anterior:
Por Camila Moreira
INDÚSTRIA
IBGE. 02/07/2020. Produção industrial avança 7,0% em maio
Em maio de 2020, a produção industrial cresceu 7,0% frente a abril de 2020 (série com ajuste sazonal), interrompendo dois meses de resultados negativos consecutivos: -9,2% em março e -18,8% em abril. Em relação a maio de 2019 (série sem ajuste sazonal), a indústria recuou 21,9%, sétimo resultado negativo seguido nesse tipo de comparação e a segunda queda mais elevada desde o início da série histórica, atrás apenas de abril de 2020 (-27,3%). No ano, a indústria acumulou queda de 11,2%. Em 12 meses, o recuo foi de 5,4%, o mais intenso desde dezembro de 2016 (-6,4%).
| Maio 2020 / Abril 2020 | 7,0% |
| Maio 2020 / Maio 2019 | - 21,9% |
| Acumulado no ano | -11,2% |
| Acumulado em 12 meses | - 5,4% |
| Média Móvel Trimestral | - 8,0% |
A expansão de 7,0% em maio de 2020 foi a mais elevada desde junho de 2018 (12,9%), mas eliminou apenas pequena parte da queda de 26,3% acumulada entre março-abril de 2020. O comportamento positivo foi disseminado, explicado especialmente pelo aumento do ritmo produtivo, após os meses de março e abril refletirem o aprofundamento das paralisações ocorridas em diversas plantas industriais, por conta do movimento de isolamento social em função da pandemia da COVID-19. Porém, mesmo com o desempenho positivo mais acentuado em maio, o total da indústria ainda se encontra 34,1% abaixo do nível recorde alcançado em maio de 2011. Ainda na série com ajuste sazonal, permanece o comportamento de queda do índice de média móvel trimestral, com o total da indústria registrando recuo de 8,0% em maio de 2020 frente ao nível do mês anterior, mantendo a trajetória predominantemente descendente iniciada em outubro de 2019.
| Indicadores da Produção Industrial por Grandes Categorias Econômicas Brasil - Maio de 2020 | ||||
|---|---|---|---|---|
| Grandes Categorias Econômicas | Variação (%) | |||
| Maio 2020/ Abril 2020* | Maio 2020/ Maio 2019 | Acumulado Janeiro-Maio | Acumulado nos Últimos 12 Meses | |
| Bens de Capital | 28,7 | -39,4 | -21,0 | -9,6 |
| Bens Intermediários | 5,2 | -14,6 | -6,7 | -4,2 |
| Bens de Consumo | 14,5 | -31,0 | -17,1 | -6,3 |
| Duráveis | 92,5 | -69,7 | -37,1 | -14,7 |
| Semiduráveis e não Duráveis | 8,4 | -19,3 | -11,2 | -4,0 |
| Indústria Geral | 7,0 | -21,9 | -11,2 | -5,4 |
| Fonte: IBGE, Diretoria de Pesquisas, Coordenação de Indústria * Série com ajuste sazonal | ||||
Produção avançou em todas as categorias econômicas e em 20 dos 26 ramos
O avanço de 7,0% da atividade industrial na passagem de abril para maio de 2020 teve perfil generalizado de crescimento, alcançando todas as grandes categorias econômicas e 20 dos 26 ramos pesquisados. Entre as atividades, as influências positivas mais relevantes foram em veículos automotores, reboques e carrocerias (244,4%); coque, produtos derivados do petróleo e biocombustíveis (16,2%); e bebidas (65,6%), impulsionados, em grande medida, pelo retorno à produção (mesmo que parcialmente) de unidades produtivas, após as paralisações/interrupções da produção ocorridas em várias unidades produtivas, devido aos efeitos causados pela pandemia da COVID-19.
Com esses resultados, veículos automotores, reboques e carrocerias interrompeu dois meses seguidos de queda na produção e marcou a expansão mais acentuada desde o início da série histórica, mas ainda assim se encontra 72,8% abaixo do patamar de fevereiro último. Já coque, produtos derivados do petróleo e biocombustíveis voltou a crescer após três meses consecutivos de taxas negativas, período em que acumulou perda de 20,0%. Enquanto que bebidas eliminou parte da redução de 49,6% acumulada nos meses de março e abril de 2020.
Outras contribuições positivas relevantes sobre o total da indústria vieram de produtos de minerais não-metálicos (16,9%), de metalurgia (9,5%), de produtos de borracha e de material plástico (13,5%), de couro, artigos para viagem e calçados (49,7%), de produtos de metal (13,4%), de máquinas e equipamentos (9,0%), de móveis (49,1%), de equipamentos de informática, produtos eletrônicos e ópticos (18,0%), de máquinas, aparelhos e materiais elétricos (13,2%), de outros equipamentos de transporte (57,9%), de confecção de artigos do vestuário e acessórios (12,3%) e de produtos farmoquímicos e farmacêuticos (4,7%).
Por outro lado, entre os seis ramos que assinalaram recuo na produção, os desempenhos de maior importância para a média global foram registrados por indústrias extrativas (-5,6%), celulose, papel e produtos de papel (-6,4%) e perfumaria, sabões, produtos de limpeza e de higiene pessoal (-6,0%). A primeira manteve o comportamento negativo presente desde setembro de 2019 e acumulando nesse período redução de 18,1%. A segunda marcou o terceiro mês seguido de queda na produção, com perda de 8,3% nesse período. E a terceira eliminou parte do crescimento de 7,9% observado entre fevereiro e abril de 2020.
Entre as grandes categorias econômicas, ainda em comparação com abril de 2020, bens de consumo duráveis, ao crescer 92,5%, e bens de capital (28,7%) mostraram as taxas positivas mais acentuadas em maio de 2020, com ambos interrompendo dois meses seguidos de queda na produção e marcando os avanços mais elevados desde o início de suas séries históricas. Apesar dos resultados positivos elevados, os segmentos ainda se encontram bem abaixo do patamar de fevereiro último: -69,5% e -36,1%, respectivamente.
Os setores produtores de bens de consumo semi e não-duráveis (8,4%) e de bens intermediários (5,2%) também assinalaram crescimento na produção, com o primeiro também avançando acima da média da indústria (7,0%) e interrompendo três meses consecutivos de queda na produção, período em que acumulou recuo de 22,9%; e o segundo voltando a crescer após acumular perda de 18,2% nos meses de março e abril de 2020.
Média móvel trimestral recua 8,0%
Ainda na série com ajuste sazonal, a evolução do índice de média móvel trimestral para o total da indústria caiu 8,0% no trimestre encerrado em maio de 2020 frente ao nível do mês anterior, após recuar 8,8% em abril, mantendo, a trajetória predominantemente descendente iniciada em outubro de 2019. Vale destacar que as reduções de abril e de maio foram as mais acentuadas desde o início da série histórica.
Entre as grandes categorias econômicas, ainda em relação ao movimento deste índice na margem, os segmentos de bens de consumo duráveis (-36,3%) e de bens de capital (-15,4%) assinalaram os recuos mais elevados nesse mês. O primeiro intensificou a queda verificada no mês anterior (-30,4%) e marcou o resultado negativo mais intenso desde o início da série histórica. Já bens de capital permaneceu com a trajetória predominantemente descendente iniciada em junho de 2019. Bens de consumo semi e não-duráveis caiu 6,1%, mantendo o comportamento negativo desde dezembro de 2019 e acumulando perda de 18,7%. Já bens intermediários recuou 5,0%, prosseguindo com a trajetória predominantemente descendente iniciada em outubro de 2019.
Indústria recuou 21,9% na comparação com maio de 2019
Na comparação com maio de 2019, o setor industrial recuou 21,9% em maio de 2020, com resultados negativos nas quatro grandes categorias econômicas, 22 dos 26 ramos, 72 dos 79 grupos e 81,9% dos 805 produtos pesquisados. Além do efeito-calendário negativo, já que maio de 2020 (20 dias) teve dois dias úteis a menos do que igual mês do ano anterior (22), observa-se a clara diminuição do ritmo da produção devido à influência dos efeitos do isolamento social, que afetou o processo de produção de várias unidades produtivas no país.
Entre as atividades, a de veículos automotores, reboques e carrocerias (-74,5%) exerceu a maior influência negativa na formação da média da indústria, pressionada, em grande medida, pelos itens automóveis, caminhões, caminhão-trator para reboques e semirreboques, veículos para o transporte de mercadorias e autopeças.
Houve ainda contribuições negativas dos ramos de máquinas e equipamentos (-35,5%), de metalurgia (-28,0%), de confecção de artigos do vestuário e acessórios (-60,8%), de produtos de borracha e de material plástico (-26,4%), de outros produtos químicos (-17,1%), de máquinas, aparelhos e materiais elétricos (-36,5%), de couro, artigos para viagem e calçados (-56,3%), de produtos de minerais não-metálicos (-25,0%), de produtos de metal (-25,0%), de outros equipamentos de transporte (-71,2%), de equipamentos de informática, produtos eletrônicos e ópticos (-31,1%), de produtos têxteis (-46,5%), de indústrias extrativas (-5,7%), de produtos diversos (-50,6%) e de bebidas (-16,5%).
Por outro lado, ainda na comparação com maio de 2019, entre as quatro atividades que apontaram expansão na produção, as principais influências no total da indústria foram registradas por produtos alimentícios (2,9%) e coque, produtos derivados do petróleo e biocombustíveis (1,6%).
Entre as grandes categorias econômicas, ainda no confronto com igual mês de 2019, bens de consumo duráveis (-69,7%) e bens de capital (-39,4%) assinalaram, em maio de 2020, os recuos mais acentuados entre as grandes categorias econômicas. Os setores produtores de bens de consumo semi e não-duráveis (-19,3%) e de bens intermediários (-14,6%) também mostraram taxas negativas nesse mês, mas ambos com queda menos intensa do que a média nacional (-21,9%). Esses resultados negativos elevados ainda evidenciam as paralisações/interrupções ocorridas em diversas plantas industriais, fruto, especialmente, do movimento de isolamento social por conta da pandemia da COVID-19.
O segmento de bens de consumo duráveis recuou 69,7% em maio de 2020 frente a igual período do ano anterior, quarto resultado negativo seguido nesse tipo de comparação e a segunda queda mais intensa desde o início da série histórica, abaixo apenas da perda verificada em abril último (-84,9%). O setor foi particularmente pressionado pela redução na fabricação de automóveis (-86,0%). Houve ainda recuos em eletrodomésticos da “linha branca” (-49,7%), eletrodomésticos da “linha marrom” (-30,8%), motocicletas (-85,7%) e pelos grupamentos de móveis (-37,7%) e de outros eletrodomésticos (-49,0%).
O setor de bens de capital, recuou 39,4% em maio de 2020 em relação a igual período de 2019, na quarta taxa negativa consecutiva nesse tipo de comparação e a segunda mais elevada desde o início da série histórica, abaixo apenas da redução verificada em abril (-51,8%). O segmento foi influenciado pela queda observada no grupamento de bens de capital para equipamentos de transporte (-59,8%). As demais taxas negativas foram registradas por bens de capital para fins industriais (-36,1%), de uso misto (-21,7%), para construção (-41,1%), agrícolas (-21,2%) e para energia elétrica (-14,5%).
Ainda no confronto com igual mês do ano anterior, o segmento de bens de consumo semi e não-duráveis recuou 19,3% em maio de 2020, quinta taxa negativa consecutiva nesse tipo de comparação e a segunda mais elevada desde o início da série histórica, abaixo apenas da perda observada em abril último (-25,2%). O desempenho nesse mês foi explicado, principalmente, pela queda registrada no grupamento de semiduráveis (-53,9%). Vale citar também os resultados negativos assinalados pelos grupamentos de alimentos e bebidas elaborados para consumo doméstico (-9,9%), de não-duráveis (-13,8%) e de carburantes (-15,4%).
A produção de bens intermediários recuou 14,6% no índice mensal de maio de 2020, após também recuar em março (-1,5%) e abril (-17,4%) últimos. O resultado desse mês foi explicado, principalmente, pelos recuos nos produtos associados às atividades de produtos de veículos automotores, reboques e carrocerias (-70,8%), de metalurgia (-28,0%), de outros produtos químicos (-17,0%), de produtos de minerais não-metálicos (-24,9%), de produtos de borracha e de material plástico (-24,9%), de produtos de metal (-27,3%), de máquinas e equipamentos (-41,1%), de indústrias extrativas (-5,7%), de produtos têxteis (-44,9%) e de celulose, papel e produtos de papel (-7,1%), enquanto as pressões positivas foram registradas por produtos alimentícios (16,2%) e coque, produtos derivados do petróleo e biocombustíveis (9,7%).
Vale citar também os resultados negativos assinalados pelos grupamentos de insumos típicos para construção civil (-21,5%), que apontou a sexta taxa negativa consecutiva; e de embalagens (-14,9%), que marcou a queda mais elevada desde o início da série histórica.
No índice acumulado para janeiro-maio de 2020, frente a igual período do ano anterior, o setor industrial recuou 11,2%, com resultados negativos em quatro das quatro grandes categorias econômicas, 22 dos 26 ramos, 63 dos 79 grupos e 75,8% dos 805 produtos pesquisados. Entre as atividades, veículos automotores, reboques e carrocerias (-42,0%) exerceu a maior influência negativa na formação da média da indústria.
Vale destacar também as contribuições negativas assinaladas pelos ramos de metalurgia (-13,9%), de máquinas e equipamentos (-16,3%), de confecção de artigos do vestuário e acessórios (-34,3%), de bebidas (-15,5%), de couro, artigos para viagem e calçados (-31,8%), de produtos de minerais não-metálicos (-15,3%), de produtos de borracha e de material plástico (-12,7%), de outros equipamentos de transporte (-39,3%), de produtos de metal (-13,3%), de máquinas, aparelhos e materiais elétricos (-16,0%), de equipamentos de informática, produtos eletrônicos e ópticos (-16,8%), de indústrias extrativas (-3,1%), de outros produtos químicos (-6,2%) e de produtos têxteis (-21,4%).
Entre as grandes categorias econômicas, o perfil dos resultados para os cinco meses de 2020 mostrou menor dinamismo para bens de consumo duráveis (-37,1%) e bens de capital (-21,0%), pressionadas, em grande parte, pela redução na fabricação de automóveis (-49,8%), na primeira; e de bens de capital para equipamentos de transporte (-35,3%), na segunda. Os setores produtores de bens de consumo semi e não-duráveis (-11,2%) e de bens intermediários (-6,7%) também assinalaram taxas negativas no índice acumulado no ano, com o primeiro repetindo a magnitude de queda observada na média nacional (-11,2%); e o segundo registrando o recuo menos intenso entre as categorias econômicas.
Produção industrial. Indústria cresce 7,0% em maio, após dois meses de queda com a pandemia. A indústria de veículos foi uma das principais responsáveis pela volta do crescimento do setor em maio
A produção industrial nacional avançou 7,0% em maio de 2020 frente a abril. O crescimento, no entanto, foi insuficiente para reverter a queda de 26,3% acumulada nos meses de março e abril. Com isso, o setor atinge o segundo patamar mais baixo desde o início da série histórica da Pesquisa Industrial Mensal, sendo que o menor nível foi registrado em abril deste ano. Os dados, divulgados hoje (2) pelo IBGE, refletem os efeitos das medidas de isolamento social para controle da pandemia de Covid-19.
“A partir do último terço de março, várias plantas industriais foram fechadas, sendo que, em abril, algumas ficaram o mês inteiro praticamente sem produção, culminando no pior resultado da indústria na série histórica da pesquisa. O mês de maio já demonstra algum tipo de volta à produção, mas a expansão de 7,0%, apesar de ter sido a mais elevada desde junho de 2018 (12,9%), se deve, principalmente, a uma base de comparação muito baixa. Mesmo com o desempenho positivo, o total da indústria ainda se encontra 34,1% abaixo do nível recorde, alcançado em maio de 2011”, explica André Macedo, gerente da pesquisa.
Em comparação com maio de 2019, a produção teve queda de 21,9%, sendo o sétimo resultado negativo subsequente e a segunda queda mais elevada desde o início da série histórica. Na soma dos últimos 12 meses, a queda foi de 5,4%, a mais elevada desde dezembro de 2016 (-6,4%). No ano de 2020, a indústria já acumula recuo de 11,2% até maio. “Cabe ressaltar que, até fevereiro, já havia retração, mas era de apenas 0,6%”, destaca Macedo.
Produção industrial (mês/mês anterior)
Clique e arraste para zoom
Entre os segmentos de atividades, o crescimento frente ao mês anterior foi generalizado, alcançando todas as grandes categorias econômicas e a maior parte (20) dos 26 ramos pesquisados. “As atividades foram impulsionadas, em grande medida, pelo retorno à produção (mesmo que parcialmente) de unidades produtivas, após as interrupções da produção ocorridas em várias unidades produtivas, por efeito da pandemia”, pontua André Macedo.
A influência positiva mais relevante foi assinalada por veículos automotores, reboques e carrocerias (244,4%), que interrompeu dois meses seguidos de queda na produção e marcou a expansão mais acentuada desde o início da série histórica, mas ainda assim se encontra 72,8% abaixo do patamar de fevereiro último. Na comparação entre maio de 2019 e maio de 2020, essa atividade exerceu a maior influência negativa (-74,5%) na formação da média da indústria.
Outros destaques positivos na comparação com o mês anterior foram os segmentos de coque, produtos derivados do petróleo e biocombustíveis (16,2%), que voltou a crescer após acumular perda de 20,0% em três meses consecutivos de taxas negativas, e bebidas (65,6%), que eliminou parte da redução de 49,6% acumulada nos meses de março e abril de 2020.
DOCUMENTO: https://agenciadenoticias.ibge.gov.br/agencia-sala-de-imprensa/2013-agencia-de-noticias/releases/28152-producao-industrial-avanca-7-0-em-maio
COMÉRCIO EXTERIOR BRASILEIRO
MEconomia. 02/07/2020. COMÉRCIO EXTERIOR. Balança comercial tem maior saldo para mês de junho, com US$ 7,4 bilhões. Resultado também foi o segundo maior da série histórica para todos os meses; corrente de comércio chegou a US$ 28,3 bilhões no mês e US$ 181,8 bilhões no acumulado do ano
As exportações brasileiras em junho chegaram a US$ 17,912 bilhões e as importações a US$ 10,449 bilhões, com saldo positivo de US$ 7,463 bilhões e corrente de comércio de US$ 28,361 bilhões. Esse foi o maior saldo comercial da série histórica para o mês de junho e o segundo maior considerando todos os meses. No ano, o saldo positivo é de US$ 23,035 bilhões, com corrente de comércio de US$ 181,825 bilhões – US$ 102,43 bilhões em exportações e US$ 79,395 bilhões em importações. Os dados foram divulgados nesta quarta-feira (1º/7) pela Secretaria de Comércio Exterior (Secex) do Ministério da Economia.
O saldo recorde para junho representou um crescimento de 25,4% em relação aos US$ 5,4 bilhões de junho do ano passado, pela média diária. Já a corrente de comércio recuou 18,4% na mesma comparação – foram US$ 31,4 bilhões em junho de 2019. O valor exportado em junho baixou 12%. Nas importações, a queda no valor foi maior (-27,4%). O volume exportado, porém, registrou aumento de 14%.
O aumento do volume exportado também é destaque no acumulado do semestre. Na Agropecuária, o crescimento de quantum foi de 22,8% no período, com alta de 41,5% no volume exportado de soja. Na Indústria Extrativa, com volumes crescentes nas exportações (+5,5%), o principal aumento foi de óleos de petróleo ou de minerais betuminosos crus, com alta de 30,6% até junho. A Indústria de Transformação, por sua vez, registrou aumentos que chegaram a 53,8% em açúcares e melaços, 12,9% em carne bovina e 1,2% em celulose.
Impactos da crise
Segundo o secretário de Comércio Exterior do Ministério da Economia, Lucas Ferraz, o desempenho do comércio exterior brasileiro em junho foi afetado principalmente pela crise global – a maior desde 1929 –, que deixa todos os países expostos a choques negativos de oferta e demanda, agravando um cenário que já vinha em desaquecimento em anos anteriores, sobretudo em relação ao comércio internacional.
Por gerar um choque negativo, a crise derruba os preços internacionais, não só de commodities, mas também de produtos de maior valor agregado. “É uma crise que atinge frontalmente os bens de maior valor agregado, e os nossos resultados refletem essas condições”, explicou.
Ferraz comentou que as exportações brasileiras vêm caindo de forma generalizada para destinos importantes, como os Estados Unidos (-26,6%), América do Sul (-28,1%) e Europa (-6,8%). “Tudo isso em função do desaquecimento global, da queda da demanda por produtos importados nas economias dessas regiões, que têm sofrido bastante com essa crise internacional”, afirmou.
Ásia e agropecuária em alta
Por outro lado, houve crescimento de 14,6% nas exportações para a Ásia (excluindo o Oriente Médio). Nesse cenário, destaca-se o melhor desempenho relativo das exportações de produtos agropecuários e do setor extrativo, na comparação com as exportações de produtos de maior valor agregado.
Isso se deve ao fato de o continente asiático, que é o principal destino dessas commodities, estar se recuperando mais rapidamente. “Portanto, há uma demanda significativa pelo consumo desses produtos, que têm menor elasticidade de preços mesmo em meio a uma crise, porque os consumidores continuam comprando produtos alimentares”, diz o secretário.
Além disso, ele salienta que o Brasil tem condições de oferta particulares, graças à safra recorde de grãos e às boas condições das cadeias de suprimentos do agronegócio, mesmo em meio à crise, aliadas à “grande competitividade intrínseca do agronegócio, já que o Brasil é um grande player do agronegócio do ponto de vista internacional”.
A agropecuária, de fato, liderou o desempenho da balança no mês passado, com crescimento de US$ 57,49 milhões (+29,7%) nas exportações em relação a junho de 2019, pela média diária. Já na indústria extrativa as vendas externas recuaram US$ 54,64 milhões (-26,1%), enquanto em produtos da Indústria de Transformação houve queda de US$ 118,08 milhões (-21,0%).
No acumulado do ano, comparando com igual período do ano anterior, o desempenho dos setores pela média diária também registrou crescimento das exportações em Agropecuária, de US$ 41 milhões (+23,8%). Na Indústria Extrativa, no entanto, houve queda de US$ 18,36 milhões (-9,6%) e na Indústria de Transformação, um recuo de US$ 78,63 milhões (-15,1%).
Nas importações, houve queda de US$ 2,49 milhões (-15,6%) em Agropecuária; de US$ 10,42 milhões (-22,3%) em Indústria Extrativa; e de US$ 174,28 milhões (-28,1%) em produtos da Indústria de Transformação, pela medida diária, na comparação entre junho de 2020 e o mesmo mês do ano passado.
Da mesma forma, no acumulado do primeiro semestre, houve queda das importações de Agropecuária, de US$ 1,08 milhão (-6,1%); da Indústria Extrativa, de US$ 14,36 milhões (-30,9%); e de produtos da Indústria de Transformação, de US$ 19,67 milhões (-3,2%).
Perspectivas para 2020
Os dados até junho levaram a Secex a refazer as previsões para 2020, chegando a uma estimativa de redução de 10,2% em valor nas exportações e de 17% nas importações. A queda da corrente de comércio deve ficar em 13,2%, enquanto o saldo comercial tende a subir 15,2%, chegando a US$ 55,4 bilhões.
Segundo Lucas Ferraz, isso “dá mais conforto às contas externas do país e é o reflexo direto de uma exportação que tem tido um desempenho, na média, melhor do que as importações, gerando excedentes comerciais e contribuindo para uma queda, talvez, menos acentuada do PIB e da economia brasileira neste ano”, afirmou.
RESULTADOS PRELIMINARES
Na 5ª semana de Junho de 2020, a balança comercial registrou superávit de US$ 0,878 bilhão e corrente de comércio de US$ 2,379 bilhões, resultado de exportações no valor de US$ 1,628 bilhões e importações de US$ 0,75 bilhão. No mês, as exportações somam US$ 17,912 bilhões e as importações, US$ 10,449 bilhões, com saldo positivo de US$ 7,463 bilhões e corrente de comércio de US$ 28,361 bilhões. No ano, as exportações totalizam US$ 102,43 bilhões e as importações, US$ 79,395 bilhões, com saldo positivo de US$ 23,035 bilhões e corrente de comércio de US$ 181,825 bilhões.
DOCUMENTO: http://www.mdic.gov.br/index.php/comercio-exterior/estatisticas-de-comercio-exterior/balanca-comercial-brasileira-semanal
MERCOSUL
MERCOSUL. REUTERS. 2 DE JULHO DE 2020. Líderes do Mercosul tentam fechar acordo com a UE, apesar de resistência de Macron
Por Daniela Desantis
ASSUNÇÃO (Reuters) - Ministros do Mercosul relataram avanços no texto final de um acordo comercial com a União Europeia na véspera de uma cúpula ofuscada pelos comentários mais recentes do presidente francês, Emmanuel Macron, contra o pacto.
Líderes do bloco comercial sul-americano realizarão uma cúpula virtual nesta quinta-feira, e se espera que debatam a pandemia de Covid-19 e acordos comerciais com Canadá, Cingapura e Coreia do Sul, além de começarem a estudar reajustes em suas tarifas externas comuns.
Mas o tópico mais premente será a conclusão do acordo de livre comércio com a UE, que exigiu duas décadas de negociação e foi acertado em princípio no ano passado.
O ministro das Relações Exteriores do Brasil, Ernesto Araújo, disse às suas contrapartes que a blindagem legal de um documento que delineia o acordo está quase concluída, graças à “cooperação e flexibilidade” para se superar as diferenças finais.
O chanceler disse esperar que os coordenadores do bloco sul-americano possam concluir os textos e anexos com os negociadores europeus após o verão no hemisfério norte, para que então o acordo esteja pronto para ser assinado.
Na segunda-feira, falando em Paris a um grupo de cidadãos franceses que propunham maneiras de diminuir as emissões de gases de efeito estufa, Macron disse que concorda que a França não deveria assinar nenhum acordo com países que não cumprem o Acordo de Paris contra a mudança climática.
“Compartilho sua proposta, e é por isso que, quanto ao Mercosul, interrompi totalmente as negociações”, disse.
No ano passado, Macron disse que não assinaria nenhum acordo comercial com o Brasil se o presidente Jair Bolsonaro retirar seu país do pacto de Paris, ameaçando uma reviravolta nas tratativas entre UE e Mercosul.
Bolsonaro recuou, mas ambientalistas da Europa pressionaram pela rejeição do acordo comercial mesmo assim, citando a incapacidade do governo brasileiro de deter o desmatamento da Amazônia.
A eleição do presidente peronista Alberto Fernández na Argentina no ano passado também criou dúvidas sobre o acordo da UE com o Mercosul, o quarto maior bloco comercial do mundo. Fernández disse que quer renegociar partes do acordo proposto.
Mas o chanceler argentino, Felipe Solá, disse na quarta-feira que seu país não obstruiria o avanço do acordo com a UE, embora este dê aos seus agricultores menos acesso aos mercados do que a Rodada Uruguaia de 1993.
AVIAÇÃO
AMERICAN AIRLINES. REUTERS. 2 DE JULHO DE 2020. American Airlines alerta para queda de 25% na capacidade internacional no verão de 2021
(Reuters) - A American Airlines (AAL.O) previu nesta quinta-feira uma queda de 25% em sua capacidade de voos internacionais para o verão do hemisfério norte de 2021, em relação ao mesmo período de 2019, conforme a companhia aérea reduz as operações para lidar com uma queda na demanda de viagens causada pela pandemia de Covid-19.
A empresa também descontinuará várias rotas internacionais que antes eram destinos populares, mas agora se espera uma redução na demanda.
“Em um esforço para atender à baixa demanda resultante do surto de coronavírus, a companhia aérea realinhará sua rede com o objetivo de melhorar a lucratividade a longo prazo”, afirmou a companhia em comunicado.
A empresa avisou na quarta-feira que tem cerca de 8.000 comissários de bordo e poderia reduzir sua força de trabalho por causa do impacto da pandemia.
Por Sanjana Shivdas em Bengaluru
AMERICAN AIRLINES. July 01, 2020. American Airlines Resets International Network for Remainder of 2020 Through Summer 2021. The airline also extends its offer of no change fees for flights booked in July
FORT WORTH, Texas — American Airlines Group Inc. (NASDAQ: AAL) will adjust its long-haul international schedule for winter 2020 through summer 2021. In an effort to match low demand resulting from the coronavirus (COVID-19) outbreak, the airline will realign its network with the goal of improving long-term profitability. American expects:
- Summer 2021 long-haul international capacity to be down 25% compared to 2019.
- To focus on markets that create unique connectivity for customers.
- To leverage partnerships as the foundation of future international growth.
“COVID-19 has forced us to reevaluate our network,” said American’s Chief Revenue Officer Vasu Raja. “American will have a significantly smaller international network in the year ahead, but we are using this opportunity to hit reset and create a network using the strength of our strategic hubs that we can build and grow upon and be profitable on in this new environment.”
International demand remains low
In response to the prolonged downturn in international travel, American expects summer 2021 long-haul international capacity to be down 25% versus 2019. As the airline begins planning for next summer, American will also discontinue several routes that were once popular leisure destinations but are expected to exhibit decreased demand.
“American has spent the past few years right-sizing its international network, discontinuing underperforming routes while adding leisure destinations like Dubrovnik and Prague,” said Brian Znotins, American’s Vice President of Network Planning. “Now, as demand has significantly diminished due to COVID-19, we have to be nimble, creating the network that our customers desire.”
American will exit several routes, including three trans-Atlantic routes from both Charlotte Douglas International Airport (CLT) and Philadelphia International Airport (PHL). The company will also exit five underperforming routes from Los Angeles International Airport (LAX) to destinations in Asia and South America, concentrating on the hub’s domestic strength.
As American resets its international network for future growth, Dallas Fort Worth International Airport (DFW) will be the airline’s major trans-Pacific hub while Miami International Airport (MIA) will continue to be the preeminent hub for flights to the Caribbean and Latin America. Once government restrictions on trans-Atlantic flying subside, PHL will continue to be American’s primary hub for service to Europe.
Strategic focus on partner hubs in Seattle and London for future growth
Earlier this year, American launched its West Coast International Alliance with Alaska Airlines, an innovative partnership to expand its international reach and connectivity for customers. The airline will plan future growth with the strength of this relationship, which includes a large presence and a strong feed in Seattle. As previously announced, American will launch service from Seattle (SEA) to Bangalore and London (LHR) next year, and Alaska also intends to join the oneworld® alliance in 2021. The airline will also seek government approval to move its LAX service to Shanghai to operate out of SEA, which will offer more customers direct access to Asia, utilizing the strength of Alaska’s local presence in the Pacific Northwest.
American will also continue to fly to joint business partners’ hubs. And while some international markets will not return, American anticipates a full schedule to LHR by 2021. The airline will continue to work closely with British Airways to provide an extensive network that allows customers to reach key destinations when they are ready.
“For American, every new partnership means future growth opportunities for our airline. We’re going to rely on our hubs’ greatest strengths with our existing international network, and further integrate into our partners’ hubs to provide connectivity that’s been untapped in the past,” Raja said. “American will be well poised to emerge from this crisis with a stronger network that provides improved connectivity for our customers.”
A full list of changes can be found below. International schedule updates will be reflected on aa.com Sunday, July 5.
No change fees for flights booked by July 31
American Airlines is providing customers additional flexibility by expanding waived change fees for customers booking tickets for any new travel purchased by July 31, 2020. Any first, business, Premium Economy, and Main Cabin tickets purchased on or before July 31, 2020, for future travel will not incur change fees prior to travel. Customers are allowed to change their origin and destination cities as part of this offer. Offer excludes Basic Economy and AAdvantage® award tickets. Customers must pay any fare difference, if applicable, and fare rules may apply depending on the ticket.
Customers have flexibility for AAdvantage® award tickets as changes made 60 days or more before travel have no reinstatement fee. More information on changing award tickets can be found at aa.com.
American currently has a change fee waiver in place for all tickets, including Basic Economy and AAdvantage® award tickets, for travel through Sept. 30, 2020. Additional updates on existing travel alerts can be found on aa.com/travelalerts.
Updated international schedule (not previously announced):
American will no longer operate the following routes:
*American will not launch ORD—BUD, ORD—PRG, ORD—KRK and PHL—CMN as previously announced.
**Subject to government approval of SEA—PVG.
FULL DOCUMENT: http://news.aa.com/news/news-details/2020/American-Airlines-Resets-International-Network-for-Remainder-of-2020-Through-Summer-2021-OPS-DIS-07/default.aspx
ENERGIA
ANP. 02 de Julho de 2020. Produção de petróleo cai em maio devido aos efeitos da pandemia do Covid-19
A ANP divulga o Boletim Mensal da Produção de Petróleo e Gás Natural com dados detalhados referentes a maio de 2020. Neste mês, a produção nacional foi de 3,485 MMboe/d (milhões de barris de óleo equivalente por dia), sendo 2,765 MMbbl/d (milhões de barris por dia) de petróleo e 114 MMm3/d (milhões de m3 por dia) de gás natural.
A produção de petróleo reduziu 6,5% se comparada com o mês anterior e aumentou 1,3% na comparação com maio de 2019. Em relação à produção de gás natural, houve redução de 7,8% na comparação com abril e de 3% na comparação com o mesmo mês do ano anterior. A queda na produção se deve principalmente à parada das FPSOs Mangaratiba e Cidade de Angra dos Reis e à restrição na produção das plataformas P-67, P-74 e P-76.
Durante o mês de maio, 34 campos tiveram a suas respectivas produções interrompidas temporariamente devido aos efeitos da pandemia da Covid-19, dos quais 16 marítimos e 18 terrestres, e um total de 60 instalações de produção marítimas permaneceram com produção interrompida. No mês de abril, foram 38 campos e 66 instalações com produção interrompida pelo mesmo motivo.
Pré-sal
A produção no Pré-sal em maio foi de 2,363 MMboe/d, o que corresponde a 67,8% do total nacional. Foram produzidos 1,875 MMbbl/d de petróleo e 77,57 MMm3/d de gás natural por meio de 115 poços. Houve redução de 9% em relação ao mês anterior e aumento de 12,2% em relação a maio de 2019.
Aproveitamento do gás natural
Em maio, o aproveitamento de gás natural foi de 97,6%. Foram disponibilizados ao mercado 48,7 MMm³/dia. A queima de gás no mês foi de 2,782 MMm³/d, um aumento de 2,1% se comparada ao mês anterior e uma redução de 43,3% se comparada ao mesmo mês em 2019.
Origem da produção
Neste mês de maio, os campos marítimos produziram 96,5% do petróleo e 86% do gás natural. Os campos operados pela Petrobras foram responsáveis por 94,9% do petróleo e do gás natural produzidos no Brasil. Porém, os campos com participação exclusiva da Petrobras produziram 41,8% do total.
Destaques
O campo de Lula, na Bacia de Santos, foi o maior produtor de petróleo e gás natural, registrando 889 Mbbl/d de petróleo e 39,3 MMm3/d de gás natural.
A plataforma Petrobras 77, produzindo no campo de Búzios por meio de quatro poços a ela interligados, produziu 155,371 Mbbl/d de petróleo e foi a instalação com maior produção de petróleo.
A instalação FPSO Cidade de Itaguaí, produzindo no campo de Lula, por meio de 7 poços a ela interligados, produziu 7,694 MMm³/d e foi a instalação com maior produção de gás natural.
Estreito, na Bacia Potiguar, teve o maior número de poços produtores terrestres: 1.085. Marlim Sul, na Bacia de Campos, foi o campo marítimo com maior número de poços produtores: 67.
Campos de acumulações marginais
Esses campos produziram 254,8 boe/d, sendo 57,8 bbl/d de petróleo e 31,3 Mm³/d de gás natural. O campo de Iraí, operado pela Petroborn, foi o maior produtor, com 193,9 boe/d.
Outras informações
No mês de maio de 2020, 270 áreas concedidas, duas áreas de cessão onerosa e cinco de partilha, operadas por 34 empresas, foram responsáveis pela produção nacional. Dessas, 58 são marítimas e 212 terrestres, sendo oito relativas a contratos de áreas contendo acumulações marginais. A produção ocorreu em 6.905 poços, sendo 492 marítimos e 6.413 terrestres.
O grau API médio foi de 27,7, sendo 3,2% da produção considerada óleo leve (>=31°API), 87,2% óleo médio (>=22 API e <31 9="" api="" e="" leo="" p="" pesado="">
As bacias maduras terrestres (campos/testes de longa duração das bacias do Espírito Santo, Potiguar, Recôncavo, Sergipe e Alagoas) produziram 100,4 Mboe/d, sendo 80,6 mil bbl/d de petróleo e 3,1 MMm³/d de gás natural. Desse total, 85,3 mil boe/d foram produzidos pela Petrobras e 15,1 mil boe/d foram produzidos por concessões não operadas pela Petrobras, dos quais: 327 boe/d em Alagoas, 3.791 boe/d na Bahia, 64 boe/d no Espírito Santo, 10.686 boe/d no Rio Grande do Norte e 203 boe/d em Sergipe.
Boletim Mensal da Produção de Petróleo e Gás Natural: http://www.anp.gov.br/publicacoes/boletins-anp/2395-boletim-mensal-da-producao-de-petroleo-e-gas-natural
________________
LGCJ.: