US ECONOMICS
MONETARY POLICY
FED. May 21, 2020. Speech. U.S. Economic Outlook and Monetary Policy. Vice Chair Richard H. Clarida. At the New York Association for Business Economics, New York, New York (via webcast)
It is my pleasure to meet virtually with you today at the New York Association for Business Economics.1 I have been looking forward to this session, and I am sorry that I cannot join you in person, as I always value my opportunities for dialogue with business and market economists. Since mid-March, along with my Federal Open Market Committee (FOMC) colleagues, I have been working from home. While I certainly miss the opportunities for face-to-face interactions along the corridors of the Board's Eccles Building, I am grateful to be able to work from home and want to convey my deep gratitude to all of those on the frontlines of the crisis, who are working outside the comfort of their homes in hospitals, emergency services, and care facilities.
Current Economic Situation and Outlook
While the coronavirus (COVID-19) pandemic has taken a tragic human toll measured in terms of lives lost and suffering inflicted, as a direct result of the necessary public health policies put in place to mitigate and control the spread of the virus, the pandemic has also inflicted a heavy toll on the levels of activity and employment in the U.S. economy. Real gross domestic product (GDP) declined at a 4.8 percent annual rate in the first quarter of the year and will almost surely continue to contract at an unprecedented pace in the second quarter. The unemployment rate, which was at a 50‑year low of 3.5 percent as recently as February, surged in April by more than 10 percentage points to 14.7 percent, an 80-year high, and it is likely to rise further in May. To put the numbers in some context, more jobs were lost in March and April of this year than had been created in the previous nine years.
But while the economic news has been unremittingly awful in recent weeks, financial conditions since the middle of March have eased—and considerably so in many markets. I believe—and most outside observers agree—that this easing of financial conditions is, at least in part, a direct consequence of the actions the Federal Reserve took at our March 15 meeting, the subsequent announcements over the following days of the creation of nine new credit facilities to support the flow of credit to households and companies, the robust expansion of our existing foreign exchange swap arrangements with major foreign central banks, and the establishment of a new FIMA (Foreign and International Monetary Authorities) Repo Facility with potential eligibility for a broad range of countries.2 While this easing of financial conditions is, of course, welcome, whether it proves to be durable will depend importantly on the course that the coronavirus contagion takes and the duration of the downturn that it causes. At a minimum, the easing of financial conditions is buying some time until the economy can begin to recover, growth resumes, and unemployment begins to fall.
As I speak to you today, there is extraordinary uncertainty about both the depth and the duration of the economic downturn. Because the course of the economy will depend on the course of the virus and the public health policies put in place to mitigate and contain it, there is an unusually wide range of scenarios for the evolution of the economy that could plausibly play out over the next several years. In my baseline view, while I do believe it will likely take some time for economic activity and the labor market to fully recover from the pandemic shock, I do project right now that the economy will begin to grow and that the unemployment rate will begin to decline starting in the second half of this year. In terms of inflation, my projection is for the COVID-19 contagion shock to be disinflationary, not inflationary, and the data we are seeing so far are consistent with this projection. For example, core CPI (consumer price inflation) prices fell 0.45 percent in April, the largest monthly decrease since the beginning of the series in 1957. While the COVID-19 shock is disrupting both aggregate demand and supply, the net effect, I believe, will be for aggregate demand to decline relative to aggregate supply, both in the near term and over the medium term. If so, this decrease will put downward pressure on core inflation, which was already running somewhat below our 2 percent objective when the downturn began in March. Moreover, as I have indicated previously, I judge that measures of longer-term inflation expectations were, when the downturn began, at the low end of a range that I consider consistent with our 2 percent inflation objective.
The Policy Response
At the Federal Reserve, we take our dual-mandate obligations of maximum employment and price stability very seriously, and, since March 3, we have deployed our entire toolkit to provide critical support to the economy during this challenging time. In two unscheduled meetings, we voted on March 3 and 15 to cut the target range for the federal funds rate by a total of 150 basis points to its current range of 0 to 25 basis points. In our FOMC statements, we have indicated we expect to maintain the target range at this level until we are confident that the economy has weathered recent events and is on track to achieve our maximum-employment and price-stability goals.
On March 16, we launched a program to purchase Treasury securities and agency mortgage-backed securities in whatever amounts needed to support smooth market functioning, thereby fostering effective transmission of monetary policy to broader financial conditions. To date, these purchases have totaled more than $2 trillion, and, as we indicated following our April FOMC meeting, they are continuing but at a reduced pace, reflecting the substantial improvement in market functioning that has occurred since the program was launched two months ago.
Since March 17, the Federal Reserve Board has announced the establishment of no fewer than nine new facilities to support the flow of credit to households and businesses. These programs are authorized under emergency lending powers granted to the Fed under section 13(3) of the Federal Reserve Act and are available only in "unusual and exigent" circumstances and with the consent of the Secretary of Treasury.3 I think you will agree that today we face circumstances that are both exigent and unusual. These facilities are supported with money invested by the Department of the Treasury, drawing on appropriations of more than $450 billion authorized by the Congress in the Cares Act (Coronavirus Aid, Relief, and Economic Security Act) for the specific purpose of investing in Fed programs to sustain the flow of credit to households, firms, and communities during the coronavirus pandemic.
With these facilities, we are providing a bridge by stepping in and supporting lending throughout the economy until the recovery takes hold. These programs are designed to offer backstop sources of funding to the private sector, and just the announcement that these backstop facilities would soon be launched appears to have bolstered confidence in capital markets, allowing many companies to finance themselves privately even before the facilities were up and running. But importantly, these are, after all, emergency facilities, and someday—hopefully soon—the emergency will pass. When that day comes and we are confident the economy is solidly on the road to recovery, we will wind down these lending facilities at such time as we determine the circumstances we confront are no longer unusual or exigent.
Not only is the Federal Reserve using its full range of tools to support the economy through this challenging time, but our policies will also help ensure that the rebound in activity when it commences will be as robust as possible. That said, it is important to note that the Fed's statutory authority grants us lending powers, not spending powers. The Fed is not authorized to grant money to particular beneficiaries, to meet the payroll expenses of small businesses, or to underwrite the unemployment benefits of displaced workers. Programs to support such worthy goals reside squarely in the domain of fiscal policy. The Fed can only make loans to solvent entities with the expectation the loans will be paid back. Direct fiscal support for the economy is thus also essential to sustain economic activity and complement what monetary policy cannot accomplish on its own. Direct fiscal support can make a critical difference, not just in helping families and businesses stay afloat in a time of need, but also in sustaining the productive capacity of the economy after we emerge from this downturn.
Fortunately, the fiscal policy response in the United States to the coronavirus shock has been both robust and timely. In four pieces of legislation passed in just over two months, the Congress has voted $2.9 trillion in coronavirus relief, about 14 percent of GDP. This total includes nearly $700 billion for the Paycheck Protection Program to support worker retention at small companies and more than $450 billion for the U.S. Treasury to provide first-loss equity funding for the Fed credit facilities that I discussed earlier. While the scale, scope, and timing of the monetary and fiscal policy responses to the coronavirus pandemic are unprecedented and will certainly cushion the blow the shock inflicts on the economy, the shock is severe. Depending on the course the virus takes and the depth and duration of the downturn it causes, additional support from both monetary and fiscal policies may be called for.
Concluding Remarks
The coronavirus pandemic poses the most serious threat to maximum employment and, potentially, to price stability that the United States has faced in our lifetimes. There is much that policymakers—and epidemiologists—simply do not know right now about the potential course that the virus, and thus the economy, will take. But there is one thing that I am certain about: The Federal Reserve will continue to act forcefully, proactively, and aggressively as we deploy our toolkit—including our balance sheet, forward guidance, and lending facilities—to provide critical support to the economy during this challenging time and to do all we can to make sure that the recovery from this downturn, once it commences, is as robust as possible.
Notes
- These remarks represent my own views, which do not necessarily represent those of the Federal Reserve Board or the Federal Open Market Committee. I am grateful to Chiara Scotti of the Federal Reserve Board staff for her assistance in preparing this text.
- For additional information on the Federal Reserve actions taken at the March 15 FOMC meeting, see the meeting statement, which is available (along with statements from other FOMC meetings) on the Board's website at https://www.federalreserve.gov/monetarypolicy/fomccalendars.htm. More details about the new credit facilities, the expansion of foreign exchange swap arrangements, and the FIMA Repo Facility, as well as other regulatory actions, can be found on the Board's website at https://www.federalreserve.gov/covid-19.htm.
- See Federal Reserve Act, 12 U.S.C. § 343 (1932), quoted text in paragraph 3.A.
UNEMPLOYMENT
DoL. BLS. May 22, 2020. STATE EMPLOYMENT AND UNEMPLOYMENT -- APRIL 2020
Unemployment rates were higher in April in all 50 states and the District of
Columbia, the U.S. Bureau of Labor Statistics reported today. Similarly, all
50 states and the District had jobless rate increases from a year earlier.
The national unemployment rate rose by 10.3 percentage points over the month
to 14.7 percent and was 11.1 points higher than in April 2019.
Nonfarm payroll employment decreased in all 50 states and the District of
Columbia in April 2020. Over the year, nonfarm payroll employment decreased
in all 50 states and the District.
This news release presents statistics from two monthly programs. The civilian
labor force and unemployment data are modeled based largely on a survey of
households. These data pertain to individuals by where they reside. The
employment data are from an establishment survey that measures nonfarm
employment, hours, and earnings by industry. These data pertain to jobs on
payrolls defined by where the establishments are located. For more information
about the concepts and statistical methodologies used by these two programs,
see the Technical Note.
Unemployment
Nevada had the highest unemployment rate in April, 28.2 percent, followed by
Michigan, 22.7 percent, and Hawaii, 22.3 percent. The rates in 43 states set
new series highs. (All state series begin in 1976.) The rates in Hawaii and
Nevada exceeded their previous series highs by more than 10.0 percentage points
each, while the rates in Michigan, New Hampshire, Rhode Island, and Vermont
exceeded their previous highs by more than 5.0 points each. Connecticut had
the lowest unemployment rate, 7.9 percent. The next lowest rates were in Minnesota
and Nebraska, 8.1 percent and 8.3 percent, respectively. In total, 27 states
and the District of Columbia had unemployment rates lower than the U.S. figure
of 14.7 percent, 10 states had higher rates, and 13 states had rates that were
not appreciably different from that of the nation. (See tables A, B, and 1.)
In April, the largest unemployment rate increases occurred in Nevada (+21.3
percentage points), Hawaii (+19.9 points), and Michigan (+18.4 points). Rates
rose over the month by at least 10.0 percentage points in an additional 17
states. The smallest over-the-month jobless rate increases occurred in Nebraska
(+4.3 percentage points) and Connecticut (+4.5 points). (See table C.)
The largest unemployment rate increases from April 2019 occurred in Nevada
(+24.2 percentage points), Hawaii (+19.6 points), and Michigan (+18.4 points),
with another 21 states experiencing increases of 10.0 points or more. The
smallest over-the-year rate increases occurred in Connecticut (+4.2 percentage
points) and Minnesota (+4.9 points). (See table D.)
Nonfarm Payroll Employment
Nonfarm payroll employment decreased in all 50 states and the District of
Columbia in April 2020. The largest job declines occurred in California
(-2,344,700), New York (-1,827,300), and Texas (-1,298,900). The largest
percentage declines occurred in Michigan (-22.8 percent), Vermont (-19.6
percent), and New York (-18.8 percent). (See tables E and 3.)
All 50 states and the District of Columbia had over-the-year decreases in nonfarm
payroll employment in April. The largest job declines occurred in California
(-2,324,000), New York (-1,904,900), and Texas (-1,110,600). The largest
percentage declines occurred in Michigan (-23.0 percent), Vermont (-21.5 percent),
and New York (-19.4 percent). (See table F.)
Coronavirus (COVID-19) Pandemic Impact on April 2020     |
 |        Establishment and Household Survey Data      |
 |             |
 | BLS has continued to review all estimation and methodological procedures for    |
 | the establishment survey, which included the review of data, estimation         |
 | processes, the application of the birth-death model, and seasonal adjustment.   |
 | Business births and deaths cannot be adequately captured by the establishment   |
 | survey as they occur. Therefore, the Current Employment Statistics (CES)        |
 | program uses a model to account for the relatively stable net employment change |
 | generated by business births and deaths. Due to the impact of COVID-19, the     |
 | relationship between business births and deaths is no longer stable. For the    |
 | March 2020 final estimates updated with this news release, CES modified the     |
 | birth-death model. Typically, reports with zero employment are not included in  |
 | estimation. For the March final estimates, CES included a portion of these      |
 | reports in the estimates. For the April 2020 preliminary estimates, in addition |
 | to the inclusion of reported zeros, the establishment survey made modifications |
 | to the birth-death model. For more information, see       |
 | www.bls.gov/web/empsit/cesbd.htm.         |
 |             |
 | In the establishment survey, workers who are paid by their employer for all or  |
 | any part of the pay period including the 12th of the month are counted as       |
 | employed, even if they were not actually at their jobs. Workers who are         |
 | temporarily or permanently absent from their jobs and are not being paid are    |
 | not counted as employed, even if they are continuing to receive benefits. The   |
 | length of the reference period does vary across the respondents in the          |
 | establishment survey; one-third of businesses have a weekly pay period,         |
 | slightly over 40 percent a bi-weekly, about 20 percent semi-monthly, and a      |
 | small amount monthly.          |
 |             |
 | For the April 2020 estimates of household employment and unemployment from the  |
 | Local Area Unemployment Statistics (LAUS) program, BLS determined that no       |
 | modifications to the model-based methodology were necessary. Rather, the LAUS   |
 | program implemented level-shift outliers in the employment and/or unemployment  |
 | inputs to the models, based on statistical evaluation of movements in each      |
 | area's inputs. Both the household survey inputs, which serve as the primary     |
 | inputs to the LAUS models, and the nonfarm payroll employment and unemployment  |
 | insurance claims covariates were examined for outliers. The resulting           |
 | implementation of level shifts preserved movements in published estimates that  |
 | the models otherwise would have discounted, without requiring changes to how    |
 | the models create estimates at other points in the time series. Outlier         |
 | detection and implementation of level shifts are usual aspects of the LAUS      |
 | modeling procedures. However, until March 2020 these activities generally had   |
 | been limited to annual processing, following the completion of estimation for   |
 | the full calendar year. Furthermore, prior to April 2020, outlier detection for |
 | model-based areas had been limited to the household survey inputs. The          |
 | implementation of level shifts for the model covariates in the April 2020       |
 | processing cycle resulted in some unusually large monthly revisions to          |
 | estimates for March 2020.          |
 |             |
 | The "Frequently asked questions" document at        |
 | www.bls.gov/cps/employment-situation-covid19-faq-april-2020.pdf extensively     |
 | discusses the impact of a misclassification in the household survey on the      |
 | national estimates for April 2020. This misclassification was widespread        |
 | geographically, with BLS analysis indicating that all states were affected to   |
 | at least some degree. However, according to usual practice, the data from the   |
 | household survey are accepted as recorded. To maintain data integrity, no ad    |
 | hoc actions are taken to reclassify survey responses. Hence, the household      |
 | survey estimates of employed and unemployed people that serve as the primary    |
 | inputs to the state models were affected to varying degrees by the     |
 | misclassification, which in turn affected the official LAUS estimates for       |
 | April 2020.            |
 |             |
 | Due to the effects of the pandemic and efforts to contain the virus, Puerto     |
 | Rico was not able to conduct normal data collection for its household survey in |
 | March or April 2020; therefore, its data were not published. Household data for |
 | Puerto Rico are not modeled, but rather are derived from a monthly household    |
 | survey similar to the Current Population Survey.
Table A. States with new series high unemployment rates,
April 2020, seasonally adjusted (1)
--------------------------------------------------------------
State | Rate(p)
--------------------------------------------------------------
Alaska ..............................| 12.9
Arizona .............................| 12.6
California ..........................| 15.5
Colorado ............................| 11.3
Delaware ............................| 14.3
Florida .............................| 12.9
Georgia .............................| 11.9
Hawaii ..............................| 22.3
Idaho ...............................| 11.5
Illinois ............................| 16.4
|
Indiana .............................| 16.9
Iowa ................................| 10.2
Kansas ..............................| 11.2
Kentucky ............................| 15.4
Louisiana ...........................| 14.5
Maine ...............................| 10.6
Maryland ............................| 9.9
Massachusetts .......................| 15.1
Michigan ............................| 22.7
Mississippi .........................| 15.4
|
Montana .............................| 11.3
Nebraska ............................| 8.3
Nevada ..............................| 28.2
New Hampshire .......................| 16.3
New Jersey ..........................| 15.3
New Mexico ..........................| 11.3
New York ............................| 14.5
North Carolina ......................| 12.2
North Dakota ........................| 8.5
Ohio ................................| 16.8
|
Oklahoma ............................| 13.7
Oregon ..............................| 14.2
Pennsylvania ........................| 15.1
Rhode Island ........................| 17.0
South Carolina ......................| 12.1
South Dakota ........................| 10.2
Tennessee ...........................| 14.7
Texas ...............................| 12.8
Utah ................................| 9.7
Vermont .............................| 15.6
|
Virginia ............................| 10.6
Washington ..........................| 15.4
Wisconsin ...........................| 14.1
--------------------------------------------------------------
(1) All state series begin in 1976.
(p) = preliminary.
Table B. States with unemployment rates significantly different
from that of the U.S., April 2020, seasonally adjusted
--------------------------------------------------------------
State | Rate(p)
--------------------------------------------------------------
United States (1) ...................| 14.7
|
Alabama .............................| 12.9
Alaska ..............................| 12.9
Arizona .............................| 12.6
Arkansas ............................| 10.2
California ..........................| 15.5
Colorado ............................| 11.3
Connecticut .........................| 7.9
District of Columbia ................| 11.1
Florida .............................| 12.9
Georgia .............................| 11.9
|
Hawaii ..............................| 22.3
Idaho ...............................| 11.5
Illinois ............................| 16.4
Indiana .............................| 16.9
Iowa ................................| 10.2
Kansas ..............................| 11.2
Maine ...............................| 10.6
Maryland ............................| 9.9
Michigan ............................| 22.7
Minnesota ...........................| 8.1
|
Missouri ............................| 9.7
Montana .............................| 11.3
Nebraska ............................| 8.3
Nevada ..............................| 28.2
New Hampshire .......................| 16.3
New Mexico ..........................| 11.3
North Carolina ......................| 12.2
North Dakota ........................| 8.5
Ohio ................................| 16.8
Oklahoma ............................| 13.7
|
Rhode Island ........................| 17.0
South Carolina ......................| 12.1
South Dakota ........................| 10.2
Texas ...............................| 12.8
Utah ................................| 9.7
Vermont .............................| 15.6
Virginia ............................| 10.6
Wyoming .............................| 9.2
--------------------------------------------------------------
(1) Data are not preliminary.
(p) = preliminary.
Table C. States with statistically significant unemployment rate changes
from March 2020 to April 2020, seasonally adjusted
-------------------------------------------------------------------------
| Rate |
|-----------|-----------| Over-the-month
State | March | April | change(p)
| 2020 | 2020(p) |
-------------------------------------------------------------------------
Alabama ........................| 3.0 | 12.9 | 9.9
Alaska .........................| 5.2 | 12.9 | 7.7
Arizona ........................| 6.1 | 12.6 | 6.5
Arkansas .......................| 5.0 | 10.2 | 5.2
California .....................| 5.5 | 15.5 | 10.0
Colorado .......................| 5.2 | 11.3 | 6.1
Connecticut ....................| 3.4 | 7.9 | 4.5
Delaware .......................| 5.0 | 14.3 | 9.3
District of Columbia ...........| 6.0 | 11.1 | 5.1
Florida ........................| 4.4 | 12.9 | 8.5
| | |
Georgia ........................| 4.6 | 11.9 | 7.3
Hawaii .........................| 2.4 | 22.3 | 19.9
Idaho ..........................| 2.5 | 11.5 | 9.0
Illinois .......................| 4.2 | 16.4 | 12.2
Indiana ........................| 3.0 | 16.9 | 13.9
Iowa ...........................| 3.3 | 10.2 | 6.9
Kansas .........................| 2.8 | 11.2 | 8.4
Kentucky .......................| 5.2 | 15.4 | 10.2
Louisiana ......................| 6.7 | 14.5 | 7.8
Maine ..........................| 3.0 | 10.6 | 7.6
| | |
Maryland .......................| 3.3 | 9.9 | 6.6
Massachusetts ..................| 2.8 | 15.1 | 12.3
Michigan .......................| 4.3 | 22.7 | 18.4
Minnesota ......................| 2.9 | 8.1 | 5.2
Mississippi ....................| 5.1 | 15.4 | 10.3
Missouri .......................| 3.9 | 9.7 | 5.8
Montana ........................| 3.6 | 11.3 | 7.7
Nebraska .......................| 4.0 | 8.3 | 4.3
Nevada .........................| 6.9 | 28.2 | 21.3
New Hampshire ..................| 2.4 | 16.3 | 13.9
| | |
New Jersey .....................| 3.7 | 15.3 | 11.6
New Mexico .....................| 6.3 | 11.3 | 5.0
New York .......................| 4.1 | 14.5 | 10.4
North Carolina .................| 4.3 | 12.2 | 7.9
North Dakota ...................| 2.0 | 8.5 | 6.5
Ohio ...........................| 5.8 | 16.8 | 11.0
Oklahoma .......................| 2.9 | 13.7 | 10.8
Oregon .........................| 3.5 | 14.2 | 10.7
Pennsylvania ...................| 5.8 | 15.1 | 9.3
Rhode Island ...................| 4.7 | 17.0 | 12.3
| | |
South Carolina .................| 3.2 | 12.1 | 8.9
South Dakota ...................| 3.1 | 10.2 | 7.1
Tennessee ......................| 3.3 | 14.7 | 11.4
Texas ..........................| 5.1 | 12.8 | 7.7
Utah ...........................| 3.8 | 9.7 | 5.9
Vermont ........................| 3.1 | 15.6 | 12.5
Virginia .......................| 3.3 | 10.6 | 7.3
Washington .....................| 5.1 | 15.4 | 10.3
West Virginia ..................| 6.0 | 15.2 | 9.2
Wisconsin ......................| 3.1 | 14.1 | 11.0
Wyoming ........................| 3.8 | 9.2 | 5.4
-------------------------------------------------------------------------
(p) = preliminary.
Table D. States with statistically significant unemployment rate changes
from April 2019 to April 2020, seasonally adjusted
-------------------------------------------------------------------------
| Rate |
|-----------|-----------| Over-the-year
State | April | April | change(p)
| 2019 | 2020(p) |
-------------------------------------------------------------------------
Alabama ........................| 3.2 | 12.9 | 9.7
Alaska .........................| 6.1 | 12.9 | 6.8
Arizona ........................| 4.8 | 12.6 | 7.8
Arkansas .......................| 3.5 | 10.2 | 6.7
California .....................| 4.2 | 15.5 | 11.3
Colorado .......................| 2.9 | 11.3 | 8.4
Connecticut ....................| 3.7 | 7.9 | 4.2
Delaware .......................| 3.6 | 14.3 | 10.7
District of Columbia ...........| 5.6 | 11.1 | 5.5
Florida ........................| 3.3 | 12.9 | 9.6
| | |
Georgia ........................| 3.6 | 11.9 | 8.3
Hawaii .........................| 2.7 | 22.3 | 19.6
Idaho ..........................| 2.9 | 11.5 | 8.6
Illinois .......................| 4.2 | 16.4 | 12.2
Indiana ........................| 3.4 | 16.9 | 13.5
Iowa ...........................| 2.7 | 10.2 | 7.5
Kansas .........................| 3.2 | 11.2 | 8.0
Kentucky .......................| 4.3 | 15.4 | 11.1
Louisiana ......................| 4.5 | 14.5 | 10.0
Maine ..........................| 3.1 | 10.6 | 7.5
| | |
Maryland .......................| 3.7 | 9.9 | 6.2
Massachusetts ..................| 3.0 | 15.1 | 12.1
Michigan .......................| 4.3 | 22.7 | 18.4
Minnesota ......................| 3.2 | 8.1 | 4.9
Mississippi ....................| 5.3 | 15.4 | 10.1
Missouri .......................| 3.2 | 9.7 | 6.5
Montana ........................| 3.5 | 11.3 | 7.8
Nebraska .......................| 3.1 | 8.3 | 5.2
Nevada .........................| 4.0 | 28.2 | 24.2
New Hampshire ..................| 2.5 | 16.3 | 13.8
| | |
New Jersey .....................| 3.4 | 15.3 | 11.9
New Mexico .....................| 5.0 | 11.3 | 6.3
New York .......................| 4.0 | 14.5 | 10.5
North Carolina .................| 4.1 | 12.2 | 8.1
North Dakota ...................| 2.3 | 8.5 | 6.2
Ohio ...........................| 4.1 | 16.8 | 12.7
Oklahoma .......................| 3.2 | 13.7 | 10.5
Oregon .........................| 4.0 | 14.2 | 10.2
Pennsylvania ...................| 4.1 | 15.1 | 11.0
Rhode Island ...................| 3.6 | 17.0 | 13.4
| | |
South Carolina .................| 3.3 | 12.1 | 8.8
South Dakota ...................| 3.2 | 10.2 | 7.0
Tennessee ......................| 3.5 | 14.7 | 11.2
Texas ..........................| 3.5 | 12.8 | 9.3
Utah ...........................| 2.7 | 9.7 | 7.0
Vermont ........................| 2.3 | 15.6 | 13.3
Virginia .......................| 2.9 | 10.6 | 7.7
Washington .....................| 4.4 | 15.4 | 11.0
West Virginia ..................| 4.7 | 15.2 | 10.5
Wisconsin ......................| 3.3 | 14.1 | 10.8
Wyoming ........................| 3.5 | 9.2 | 5.7
-------------------------------------------------------------------------
(p) = preliminary.
Table E. States with statistically significant employment changes from
March 2020 to April 2020, seasonally adjusted
--------------------------------------------------------------------------------------
| | | Over-the-month change(p)
State | March | April |---------------------------
| 2020 | 2020(p) | Level | Percent
--------------------------------------------------------------------------------------
Alabama ......................| 2,076,600 | 1,866,200 | -210,400 | -10.1
Alaska .......................| 325,700 | 281,900 | -43,800 | -13.4
Arizona ......................| 2,964,500 | 2,676,900 | -287,600 | -9.7
Arkansas .....................| 1,272,000 | 1,169,900 | -102,100 | -8.0
California ...................| 17,394,000 | 15,049,300 | -2,344,700 | -13.5
Colorado .....................| 2,796,900 | 2,473,400 | -323,500 | -11.6
Connecticut ..................| 1,677,400 | 1,411,100 | -266,300 | -15.9
Delaware .....................| 465,300 | 390,600 | -74,700 | -16.1
District of Columbia .........| 801,200 | 734,300 | -66,900 | -8.3
Florida ......................| 8,976,300 | 7,910,200 | -1,066,100 | -11.9
| | | |
Georgia ......................| 4,618,600 | 4,126,500 | -492,100 | -10.7
Hawaii .......................| 654,300 | 532,500 | -121,800 | -18.6
Idaho ........................| 767,200 | 687,700 | -79,500 | -10.4
Illinois .....................| 6,060,900 | 5,298,700 | -762,200 | -12.6
Indiana ......................| 3,147,200 | 2,744,800 | -402,400 | -12.8
Iowa .........................| 1,572,400 | 1,395,300 | -177,100 | -11.3
Kansas .......................| 1,422,900 | 1,292,500 | -130,400 | -9.2
Kentucky .....................| 1,926,900 | 1,637,300 | -289,600 | -15.0
Louisiana ....................| 1,960,700 | 1,721,100 | -239,600 | -12.2
Maine ........................| 630,100 | 531,700 | -98,400 | -15.6
| | | |
Maryland .....................| 2,766,300 | 2,417,000 | -349,300 | -12.6
Massachusetts ................| 3,668,800 | 3,045,800 | -623,000 | -17.0
Michigan .....................| 4,422,800 | 3,413,800 | -1,009,000 | -22.8
Minnesota ....................| 2,949,800 | 2,590,000 | -359,800 | -12.2
Mississippi ..................| 1,154,700 | 1,037,700 | -117,000 | -10.1
Missouri .....................| 2,878,100 | 2,573,300 | -304,800 | -10.6
Montana ......................| 488,600 | 426,400 | -62,200 | -12.7
Nebraska .....................| 1,030,000 | 943,700 | -86,300 | -8.4
Nevada .......................| 1,404,600 | 1,159,800 | -244,800 | -17.4
New Hampshire ................| 680,300 | 572,500 | -107,800 | -15.8
| | | |
New Jersey ...................| 4,166,800 | 3,409,100 | -757,700 | -18.2
New Mexico ...................| 862,100 | 764,500 | -97,600 | -11.3
New York .....................| 9,723,100 | 7,895,800 | -1,827,300 | -18.8
North Carolina ...............| 4,567,700 | 3,996,000 | -571,700 | -12.5
North Dakota .................| 439,300 | 396,800 | -42,500 | -9.7
Ohio .........................| 5,539,100 | 4,715,400 | -823,700 | -14.9
Oklahoma .....................| 1,686,900 | 1,556,100 | -130,800 | -7.8
Oregon .......................| 1,942,500 | 1,689,100 | -253,400 | -13.0
Pennsylvania .................| 6,038,300 | 5,014,200 | -1,024,100 | -17.0
Rhode Island .................| 498,500 | 409,700 | -88,800 | -17.8
| | | |
South Carolina ...............| 2,197,700 | 1,925,000 | -272,700 | -12.4
South Dakota .................| 441,000 | 405,000 | -36,000 | -8.2
Tennessee ....................| 3,147,800 | 2,770,900 | -376,900 | -12.0
Texas ........................| 12,926,900 | 11,628,000 | -1,298,900 | -10.0
Utah .........................| 1,582,700 | 1,446,100 | -136,600 | -8.6
Vermont ......................| 309,400 | 248,700 | -60,700 | -19.6
Virginia .....................| 4,067,400 | 3,684,000 | -383,400 | -9.4
Washington ...................| 3,495,400 | 2,968,400 | -527,000 | -15.1
West Virginia ................| 709,500 | 619,400 | -90,100 | -12.7
Wisconsin ....................| 2,967,800 | 2,528,400 | -439,400 | -14.8
Wyoming ......................| 286,600 | 263,800 | -22,800 | -8.0
--------------------------------------------------------------------------------------
(p) = preliminary.
Table F. States with statistically significant employment changes from
April 2019 to April 2020, seasonally adjusted
--------------------------------------------------------------------------------------
| | | Over-the-year change(p)
State | April | April |---------------------------
| 2019 | 2020(p) | Level | Percent
--------------------------------------------------------------------------------------
Alabama ......................| 2,067,400 | 1,866,200 | -201,200 | -9.7
Alaska .......................| 329,900 | 281,900 | -48,000 | -14.5
Arizona ......................| 2,915,300 | 2,676,900 | -238,400 | -8.2
Arkansas .....................| 1,277,800 | 1,169,900 | -107,900 | -8.4
California ...................| 17,373,300 | 15,049,300 | -2,324,000 | -13.4
Colorado .....................| 2,769,600 | 2,473,400 | -296,200 | -10.7
Connecticut ..................| 1,687,900 | 1,411,100 | -276,800 | -16.4
Delaware .....................| 465,500 | 390,600 | -74,900 | -16.1
District of Columbia .........| 796,400 | 734,300 | -62,100 | -7.8
Florida ......................| 8,920,700 | 7,910,200 | -1,010,500 | -11.3
| | | |
Georgia ......................| 4,599,600 | 4,126,500 | -473,100 | -10.3
Hawaii .......................| 653,700 | 532,500 | -121,200 | -18.5
Idaho ........................| 755,900 | 687,700 | -68,200 | -9.0
Illinois .....................| 6,121,500 | 5,298,700 | -822,800 | -13.4
Indiana ......................| 3,165,300 | 2,744,800 | -420,500 | -13.3
Iowa .........................| 1,586,500 | 1,395,300 | -191,200 | -12.1
Kansas .......................| 1,425,700 | 1,292,500 | -133,200 | -9.3
Kentucky .....................| 1,937,200 | 1,637,300 | -299,900 | -15.5
Louisiana ....................| 1,994,200 | 1,721,100 | -273,100 | -13.7
Maine ........................| 634,500 | 531,700 | -102,800 | -16.2
| | | |
Maryland .....................| 2,768,000 | 2,417,000 | -351,000 | -12.7
Massachusetts ................| 3,683,800 | 3,045,800 | -638,000 | -17.3
Michigan .....................| 4,430,900 | 3,413,800 | -1,017,100 | -23.0
Minnesota ....................| 2,972,900 | 2,590,000 | -382,900 | -12.9
Mississippi ..................| 1,156,300 | 1,037,700 | -118,600 | -10.3
Missouri .....................| 2,901,800 | 2,573,300 | -328,500 | -11.3
Montana ......................| 482,600 | 426,400 | -56,200 | -11.6
Nebraska .....................| 1,025,000 | 943,700 | -81,300 | -7.9
Nevada .......................| 1,414,600 | 1,159,800 | -254,800 | -18.0
New Hampshire ................| 684,300 | 572,500 | -111,800 | -16.3
| | | |
New Jersey ...................| 4,193,400 | 3,409,100 | -784,300 | -18.7
New Mexico ...................| 853,700 | 764,500 | -89,200 | -10.4
New York .....................| 9,800,700 | 7,895,800 | -1,904,900 | -19.4
North Carolina ...............| 4,564,200 | 3,996,000 | -568,200 | -12.4
North Dakota .................| 439,600 | 396,800 | -42,800 | -9.7
Ohio .........................| 5,592,100 | 4,715,400 | -876,700 | -15.7
Oklahoma .....................| 1,704,200 | 1,556,100 | -148,100 | -8.7
Oregon .......................| 1,935,700 | 1,689,100 | -246,600 | -12.7
Pennsylvania .................| 6,058,200 | 5,014,200 | -1,044,000 | -17.2
Rhode Island .................| 503,500 | 409,700 | -93,800 | -18.6
| | | |
South Carolina ...............| 2,179,600 | 1,925,000 | -254,600 | -11.7
South Dakota .................| 438,500 | 405,000 | -33,500 | -7.6
Tennessee ....................| 3,111,900 | 2,770,900 | -341,000 | -11.0
Texas ........................| 12,738,600 | 11,628,000 | -1,110,600 | -8.7
Utah .........................| 1,555,200 | 1,446,100 | -109,100 | -7.0
Vermont ......................| 316,800 | 248,700 | -68,100 | -21.5
Virginia .....................| 4,049,200 | 3,684,000 | -365,200 | -9.0
Washington ...................| 3,456,900 | 2,968,400 | -488,500 | -14.1
West Virginia ................| 722,800 | 619,400 | -103,400 | -14.3
Wisconsin ....................| 2,984,000 | 2,528,400 | -455,600 | -15.3
Wyoming ......................| 289,800 | 263,800 | -26,000 | -9.0
--------------------------------------------------------------------------------------
(p) = preliminary.
FULL DOCUMENT: https://www.bls.gov/news.release/pdf/laus.pdf
VENEZUELA
U.S. Department of State. 05/20/2020. United States Provides Additional Assistance for the Crisis in Venezuela and the Region
Michael R. Pompeo, Secretary of State
The United States continues to be a catalyst for the international response to help the Venezuelan people and region respond to the ongoing humanitarian crisis caused by the former Maduro regime. We are providing more than $200 million in additional assistance from the State Department, the U.S. Agency for International Development (USAID), and the Inter-American Foundation (IAF), including more than $138 million in humanitarian assistance, for Venezuelans in need. This includes critical humanitarian support to Venezuelans inside Venezuela, as well as humanitarian and development support for those who have fled to countries across the region and the communities hosting them. The United States remains the largest single donor responding to the crisis, with over $856 million in total assistance since FY 2017, including nearly $611 million in humanitarian assistance. Our commitment has been matched in action by the 16 countries across the region who have opened their doors to their Venezuelan neighbors in need.
This assistance underscores our ongoing leadership to the response and continuing commitment to the Venezuelan people, including the more than five million Venezuelans who have fled their country to date due to the tyranny of the former Maduro regime. Our humanitarian assistance will meet critical life-saving needs, including food and nutrition, water, sanitation, hygiene and health, temporary shelter, cash assistance, education services; protection for vulnerable children, indigenous communities, the elderly, women, and other vulnerable populations; legal aid; registration and protection monitoring support; and research to track the evolving needs of Venezuelans across the region.
Development assistance is helping countries throughout Latin America and the Caribbean meet longer-term needs caused by the regional crisis. Efforts include education and health systems strengthening, improving government capacity to manage migration and socioeconomic integration, human rights protection and access to justice, vocational training, and employment and entrepreneurship opportunities through the private sector.
The Inter-American Foundation (IAF) is investing $4.9 million in community-led efforts addressing longer-term needs of Venezuelan refugees and other migrants in refugee and migrant-receiving communities in Brazil, Colombia, Ecuador, Peru, Argentina, and Chile. IAF grantees encourage social and economic inclusion of displaced Venezuelans by increasing opportunities to earn income, promoting conflict resolution, and facilitating access to health and psychosocial services.
The United States remains the largest single donor of humanitarian and health assistance around the world, and for Venezuelans in need. We do this because our National Security Strategy prioritizes the reduction of human suffering and doing our part to respond to crisis situations makes Americans safer at home. We recognize all donors who have committed resources to these life-saving initiatives, including those who plan to contribute to the upcoming donors conference hosted by Spain and the European Union with the support of the International Organization for Migration (IOM) and the UN High Commissioner for Refugees (UNHCR), and encourage both traditional and new donors to increase their efforts to help meet growing needs of crisis responses.
CORONAVIRUS
U.S. Department of State. 05/20/2020. Secretary Pompeo’s Call with Spanish Foreign Minister González Laya
The below is attributable to Spokesperson Morgan Ortagus:
Secretary of State Michael R. Pompeo spoke today with Spanish Foreign Minister Arancha González Laya. Secretary Pompeo and Foreign Minister González Laya discussed efforts to end the COVID-19 outbreak and move progressively and safely toward resuming normal life. The Secretary expressed his deep appreciation for Spain’s cooperation during the crisis, Spanish support for repatriation flights to bring U.S. citizens home, and the enduring friendship between the United States and Spain. The Secretary and the Foreign Minister also continued their previous discussions on the crisis in Venezuela.
U.S. Department of State. 05/22/2020. U.S. Participates in the International Donors Conference in Solidarity with the Venezuelan Refugees and Migrants
Acting Assistant Secretary of State for the Bureau of Population, Refugees, and Migration (PRM) Carol Thompson O’Connell will lead the U.S. delegation to the May 26 International Donors Conference in Solidarity with the Venezuelan Refugees and Migrants, hosted virtually by the European Union (EU) and the Government of Spain in coordination with the United Nations High Commissioner for Refugees (UNHCR) and the International Organization for Migration (IOM). U.S. Agency for International Development (USAID) Deputy Assistant Administrator for the Bureau for Democracy, Conflict, and Humanitarian Assistance (DCHA) Amy Tohill-Stull will join.
On May 20, the United States announced more than $200 million in additional assistance provided through the State Department, USAID, and the Inter-American Foundation (IAF), including more than $138 million in humanitarian assistance, for Venezuelans in need inside the country and in the region. The United States will continue to be a catalyst for the international response to the Venezuela crisis and remains the largest single donor of assistance to Venezuelans, with a total of more than $856 million in assistance, of which nearly $611 million is humanitarian assistance, since FY 2017.
We commend all donors who have committed resources to this response and welcome this conference as an opportunity to call on donors to increase their efforts to help meet the critical needs of the Venezuelan people. We thank the EU, Spain, UNHCR, and IOM for hosting the conference and for their continued leadership to address the needs of the over five million refugees and migrants displaced by the crisis in Venezuela caused by the former Maduro regime.
U.S. Department of State. 05/21/2020. Secretary Pompeo’s Call with Italian Foreign Minister Di Maio
The below is attributable to Spokesperson Morgan Ortagus:
Secretary of State Michael R. Pompeo spoke today with Italian Foreign Minister Luigi Di Maio. Secretary Pompeo and Foreign Minister Di Maio discussed the importance of coordination and cooperation as we begin to re-open our societies and restart the global economy. Secretary Pompeo highlighted the strength of the U.S.-Italy friendship and his admiration for the resilience of the Italian people in the face of the COVID-19 crisis. The Secretary and Foreign Minister also discussed cooperation in bringing stability to Libya, as well as their continued commitment to the enduring defeat of ISIS.
U.S. Department of State. 05/21/2020. Briefing With Assistant Secretary for African Affairs Tibor Nagy on U.S. Support for Combating COVID-19 in Sub-Saharan Africa. Tibor P. Nagy, Jr., Assistant SecretaryBureau of African Affairs. Via Teleconference
MR BROWN: Thank you. Good morning, everyone. Welcome to this on-the-record briefing with our Assistant Secretary for the Bureau of African Affairs Tibor Nagy, who has one of the very best names in the State Department. Just yesterday, Secretary Pompeo announced another 162 million in foreign assistance to benefit the global response to COVID, bringing our total commitments to more than $1 billion since the outbreak began. Assistance to 39 countries on the African continent from Angola to Zimbabwe and three regional groupings – the Sahel, West Africa, and Sub-Saharan Africa – these are essential components of this effort.
But the U.S. engagement and commitment to Africa extends far beyond our response to COVID. We’re working on economic growth, security, education, sustainable development. Assistant Secretary Nagy will fill us in on the latest.
As a reminder, the contents of the briefing are embargoed until the end of the call.
Tibor, go ahead.
ASSISTANT SECRETARY NAGY: Thanks a lot, Cale. And what I’ll do is I’ll read a short statement and then we’ll open it up for discussion. So with that, good morning, everyone. Thanks so much for participating in the call. We appreciate the great work you guys do. It won’t be long before we’re all back to normal. My sincere prayers go out to each and every one of your families during these unprecedented times.
I spoke to a group of journalists from Africa a few weeks ago, and what I said then bears repeating. After a full career living and working on the continent, I am as optimistic as ever that we are not only going to get through this, but that our relationship with the African people will come out of it even stronger.
Nowadays, COVID-19 is taking up most of the news and our energy, and understandably so. But our longstanding partnership with Africa on other issues continues as well. Whether it be working together towards good governance, increasing trade and investment, enhancing development of Africa’s youth and women’s entrepreneurship, or increasing security, our commitment to the African people is as strong as it’s ever been.
I note that the people of Burundi went to the polls yesterday. Preliminary results will be posted this coming Tuesday. As the Secretary said yesterday, we urge all sides to refrain from provocations or violence, to respect the democratic rights of all citizens, and to use established legal processes to address potential grievances.
I am optimistic about the potential for progress in the U.S.-Burundi relationship following these elections. We applaud the Government of France, an international residual mechanism for criminal tribunals, for the arrest last weekend of Felicien Kabuga, who is charged with playing a key role in the 1994 genocide in Rwanda. This is a milestone for international justice and a message to all those who commit genocide and other atrocity crimes that they will be brought to justice. The United States remains committed to seeking justice for victims of the genocide and promoting accountability for all such crimes worldwide.
Secretary Pompeo has repeatedly stressed now is the time to reinforce America’s longstanding partnerships with our African friends, and that partnership has continued to grow ever stronger under President Trump’s leadership. With the current global focus on public health, it bears repeating that the United States is by far the largest donor nation to Africa, having committed more than $100 billion over the past 20 years towards public health on the African continent and trained over 285,000 health care workers. Millions of lives have been saved with our initiatives. With PEPFAR alone, over 18 million lives were saved in 18 years, and the President’s Malaria Initiative, or PMI, has helped save over 7 million lives while preventing over a billion cases of malaria in the last 20 years.
And now in the fight against COVID-19, again, no other nation is doing more than we are. Of the more than $900 million the U.S. Government has pledged worldwide to fight the virus, close to $270 million is geared towards Sub-Saharan Africa.
With that intro, I will stop and turn it over to you all.
MR BROWN: Okay. So going to our queue, let’s start off with Carol Morello.
QUESTION: (Inaudible) to help Sudan. In Tanzania, the U.S. Embassy put a note up on its website saying that the government to date is giving – providing – can you hear me?
MR BROWN: It got cut off, the first part of your question. So if you could start over, that’d be great.
QUESTION: Okay. I’d like – Tanzania – and South Sudan, the U.S. Embassy in Tanzania has a note on its website saying the government is providing no data on the number of COVID cases since late April and that they believe there is exponential growth. Do you know what is going on there? And in South Sudan, there are reports that government health workers have not been paid in four months, and at the same time Riek Machar, who is the head of the COVID task force, has tested positive and he is supposed to have $3 million his hands on somehow, but he has not paid them. Do you know what’s going on there? Is that true? Thank you.
ASSISTANT SECRETARY NAGY: Thanks very much for the question, Carol.
On Tanzania, yes, it’s very disappointing. Allegedly, according to their statistics, they stopped providing any more COVID statistics as of April 29th, and so obviously there are much greater numbers since then. Dar es Salaam, we don’t know exactly what the situation is there. I mean, our embassy is doing its best to take surveys and see what’s happening, but unfortunately the government there is just not being very transparent with the entire process. Also, I think the Tanzanian Government is taking steps to try to reopen everything. Obviously, they are very concerned with the economic impact that the loss of the tourism industry is going to have on them, but I can’t imagine any tourists flocking back there in such an uncertain environment.
South Sudan – interesting you mention that – just this morning, just like an hour before talking to you guys, I had a conversation with the South Sudanese foreign minister on a whole range of issues. One of them has to do with obviously the COVID-19. Our embassy there is also keeping very close track, engaging with them on a daily basis. My conversation obviously was more than COVID because we’re also very concerned with some events going on there, whether it’s resumed fighting in Equatoria, access of humanitarian organizations to potential refugees, internal migrants who – where COVID might be springing up. And yes, our information is that both Senior Vice President Riek Machar and his wife, who is the defense minister, are both suffering from COVID-19. I don’t have any details on any possible $3 million, but obviously our embassy is very engaged in discussing with them on how best to move forward, and not paying workers certainly is not helping in that effort. Over.
MR BROWN: Okay, for the second question let’s go to Michel Ghandour.
QUESTION: Two questions on Sudan. First, what is the next step after the Supreme Court ruled that Sudan has to pay more than $4 billion to U.S. East African embassy attack victims?
And second, news reports that the U.S. has reached an agreement with the Sudanese regarding this issue – is this accurate? And when do you expect Sudan to be removed from the list of state sponsor of terrorism?
ASSISTANT SECRETARY NAGY: Okay, thanks so much for that question. That’s going to involve also an involved answer, but let’s go with the last part first because I get asked that not only by every single media representative I’ve done, but also with our friends in various governments. And I wish I could tell you, because the termination of the designation of state sponsor of terrorism is not going to be flipping a switch. It is a process involving several branches of the U.S. Government. So I wish I could give you a definitive answer. Unfortunately, I cannot.
On the court decision, a couple of points. Again, I have to be very careful in what I say here because I am not a lawyer or a legal expert, but here are a couple of points on that. Okay, we obviously note the court decision, the Supreme Court decision, the May 18th decision. We also recognize that litigation related to those claims is going to continue. And I want to underline that we remain absolutely committed to our efforts to work with Sudan to achieve a resolution of the claims related to the 1998 East Africa bombings.
I can confirm that we have reached a common understanding with Sudan – and my words here are very careful – on the contours of a future bilateral claims agreement, on the contours of such an agreement. Also, this final agreement will reflect Sudan’s agreement to pay – it would include compensation in connection with claims relating also to non-U.S. nationals killed and injured in the embassy bombings. This has been a high priority for the U.S. Government given that these foreign nationals were our employees and contractors, so obviously two sets of litigants: U.S. citizens and non-U.S. nationals.
So yes, I can confirm we have reached, but again, my words are very careful on that: the contours of an agreement, contours of a future bilateral claims agreement. Over. And I wish I could go into more details, but like I said, I am neither an attorney nor a legal expert, and obviously we’re not going to get into the nuances or the details at this stage. Over.
MR BROWN: Okay. Next, Francesco Fontemaggi.
QUESTION: Hi, thank you. I wanted to ask you about Burundi. I heard what the Secretary said. I saw your tweets commending the Burundian people who are going massively to the polls. What kind of process do you have in this regime without observance to conclude democratic elections? And also, if you can give us your comment on the decision to expel the WHO team during this pandemic. Thank you.
ASSISTANT SECRETARY NAGY: Yeah. It’s no secret our relations with Burundi have not been what I would call cordial at all. We are encouraged – I mean, obviously, we’re receiving reports from our embassy about the events going on there related to the elections. One good point is that these elections are in no way as violent or as problematic as the elections were in 2015.
So having said that, we’re obviously going to be following not just the elections, but the post-election period. The preliminary results are supposed to come out on Tuesday. Very important to press for non-violence for the government following the – as positive a democratic process as possible. And then, as invariably happens with many elections, that if there are contestations of the results, they should follow whatever the prescribed process is for that.
And one other hope I have is that going forward, once there is a government that emerges from the elections, we hope that we can look again to see if we can resume a more normal relations, bilateral relations between our two countries. In the past, we’ve had cordial relations with Burundi and there’s no reason not to get back to that. Those people who I know who have had postings in Burundi all speak glowingly about the warmth of the people and just the potential that the country has.
So we would like to be optimistic. We’ll watch very carefully. Can’t say at this point yet that all will be well. We’re just very hopeful and we’ll see what happens starting Tuesday, but meanwhile, following the atmospherics of the elections very closely. Over.
MR BROWN: Jessica Donati from Wall Street Journal.
QUESTION: (No response.)
MR BROWN: Jessica, go ahead.
QUESTION: (No response.)
MR BROWN: Okay. Not hearing anything. Let’s try Barbara Usher.
OPERATOR: One moment.
QUESTION: It’s for me? This is Barbara.
OPERATOR: Barbara, your line is open.
QUESTION: Thank you. Good morning. I was wondering if the State Department has an assessment and/or a projection with regards to COVID-19 in Africa. I know that’s a big question, but broadly speaking, what I’ve been picking up is that there is far fewer cases – confirmed cases and elsewhere, but sort of dire predictions that it could all explode. Do you have a view on that?
ASSISTANT SECRETARY NAGY: Thanks so much, Barbara. Wow, that’s another one of those really difficult questions, and here’s the situation: Of course, you guys know just how immense Sub-Saharan African is with its 51 countries and – but there are a couple of common points that I can make, and these kind of work against each other. First of all, Africa still is majority rural. I think the urbanization rate is up to now about 40 percent – some countries much more urban than others, for example, South Africa.
Point two is that Africa’s population is incredibly young. Those of us who live in places like the United States, I don’t think we can fully appreciate just how young and youthful Africa’s population is.
Point three: Just about anyone in Africa, unfortunately, chances are that they have had some kind of a serious illness in their lives, whether it was Malaria or Dysentery, or you name it. So these factors kind of play off against each other, and then you add to that the lack of really good data. Again, being such a huge continent with so many different countries, there are a few countries – for example, South Africa – that has quite good statistics and data measures, and then there’s others. We were just talking about Tanzania, which has stopped providing any data whatsoever. So when you don’t have access to the – certainly the number of test kits, the fundamental health systems, or the data, you just don’t know. So it’s anecdotal.
Our embassies around the continent – I get literally daily reports from all of the embassies as to what’s happening in their back yard, and even there some of the numbers seem to be extraordinarily low. And you say to yourself, “That just cannot be.” But then you further complicate the matter with the issue of social distancing. I mean, in the developed world, we – yes, there’s been hassles and everything, but social distancing, for the most part, worked relatively well.
In Africa, where you have large segments of the population who literally live day-to-day, and they exist in the informal economy, and they live in cheek-to-jowl housing in urban slums, there is just no way at all that you can implement any kind of serious, especially long-term, social distancing. So very quickly, those activities will revert to what they always have to do, because if you have to choose between the possibility of getting COVID or not eating or not having fresh drinking water, that’s – unfortunately that’s not a very difficult choice to make.
So given all of those factors, I don’t think anybody can you tell you definitively what is the situation on the continent. A pretty good idea in South Africa and in a couple of other countries. For example, I think now it’s been weeks since they’ve had a new case in the Seychelles. But the Seychelles – again, a middle-income country, fairly developed, island nations that can control entrance and egress much easier than a large country that – with porous borders. I mean, just look at the Sahelian countries across the Sahel. Each and every one of them is about twice the size of the state of Texas, and certainly the borders are not controlled strictly. So it’s a very difficult question. All we can go on is our anecdotal evidence, and our embassies are going to keep reporting on the best information they have locally. Over.
MR BROWN: Okay, let’s try again for Jessica Donati from Wall Street Journal. I think she may be listed as Beth Donati on your queue.
QUESTION: Can you hear me?
MR BROWN: Yep, gotcha.
QUESTION: Okay, great. Thank you. I was just wondering if you could talk about the repatriations that are still ongoing in Africa and which countries are still repatriating Americans. And do you have any issues there getting government to cooperate?
And a non-coronavirus question on Sudan, over a year has gone by and there’s still no TMC and there are no civilian governors, and we were wondering if you’re losing confidence in the military’s commitment to the transition. Thank you.
ASSISTANT SECRETARY NAGY: Okay. Very good two questions. Let’s talk about Sudan first. Actually, no, it’s not an easy transition. I mean, I’m very honest when I talk about Sudan and to even more of an extent South Sudan. I mean, the transition has been a house of cards because of where they’re coming from. We talk to everybody. We believe everybody, especially the leadership, has very positive intent. They do have their own coalitions, whether it’s the civilians with the prime minister or the military with the military leadership, with Burhan. They have their own factions to deal with and they set some fairly ambitious goals, and understandably, they’re having problems meeting some of them.
We are hyper-engaged with Sudan. We’ve had calls with the Sudanese leadership from the highest points in the State Department. Our special envoy, Ambassador Don Booth, is engaged on a continuing basis on the whole range of issues, whether it’s trying to find a peaceful resolution to the remaining internal conflicts, whether it’s trying to garner support for the civilian-led transitional government, whether it’s trying to help the civilians within themselves come up with mechanisms for forming the transitional assembly and other things. So to answer your question, I mean every day that goes by and the system works, it’s like adding another card into that house.
But the COVID has really been a punch to the gut, as it has for any number of our countries in Africa, and for our country as well. So with all the problems that they’ve had to deal with, and then to have the COVID on top of that, it’s – it is a huge, huge challenge for them. But I can say the international community I believe is being as supportive as possible.
On the repatriations across the continent, again, I have to say it’s a – like I did for the general posture of COVID across the continent, it varies greatly from country to country. We’ve had extraordinary success in being able to evacuate American citizens. I believe we are now over 14,000. There may be a couple of thousand left scattered throughout the continent. But we have now progressed from the very large flights, having several hundred people from one destination, to literally going from one place to another to another to another and picking up handfuls or dozens.
And you guys who work for – with Africa, you know, again, it’s impossible to describe just how immensely large the continent is. So if you’re doing one of those quote-unquote “milk runs” that may start in a place in East Africa, hope to the center, go the south, go back to the west, and then come to the United States, you are talking about some very, very complicated logistics. I mean, my hat’s off to our incredible embassies, who have been doing this with reduced staff, with the headquarters support here in the State Department, the Office of Management, Medical Services, our own Executive Director’s Office, and then a number of airlines. And amongst the African airlines, I do have to cite Ethiopian Airlines. They have been phenomenally, phenomenally helpful in their willingness to charter their aircraft to pick up our citizens immaterial of where they were.
So it’s been an incredible effort. I am just so pleased. In my 40-plus years of government service, I have never been involved in such an endeavor, and I have never been prouder of our employees across the board, from folks here in the State Department but folks at our embassies, especially – especially – in the small embassies that have been doing these repatriations in extremely difficult circumstances.
And hats off also to the African governments. I’ll be talking this afternoon to all the African diplomats in Washington, and the African governments have been just extraordinarily cooperative. And it’s not just a matter of saying yes, we’ll let your plane come in and pick up X number of citizens, but as I said, those planes have to travel circuitous routes, and that involves also getting overflight clearances from all the countries they’re going over. And we’re asking them to do those literally in hours, not in days. And they’re also ministries of foreign affairs which are not staffed or people are at home trying to do this.
So it’s been just an incredible effort. I am just so proud of so, so many different people to have been able to provide for our citizens. I mean, we have to remember that’s why the State Department existed in the first place. It was to take care of American citizens overseas, and that remains our first, second, third, fourth-highest priorities. Over.
MR BROWN: Okay. We have time for one more quick question, so Humeyra, go ahead.
QUESTION: Hi there. Thank you. Can you – I know that you said it’s the contours of an agreement, but can you give any details about how much will they have to pay, or at least on what basis those calculations will be made?
And my second question is: We understand there are Sudanese are sent to fight for Haftar, to Libya. They were originally deployed in Yemen by the UAE, and now it seems like they’re being shipped to Libya to help out Haftar. What is the U.S. assessment on that, please? Thank you.
ASSISTANT SECRETARY NAGY: Okay, so I can’t be very helpful to you on the first part, because obviously those kind of details which are being worked out and will be part of the overall claims agreement – we’re no – we have discussed, obviously, numbers with the parties involved, but in no way can we make those public yet. Like I said – and I’m very careful with my wording on this – that we have reached a common understanding with Sudan on the contours of a future bilateral claims agreement, and that’s the phrase I want to stick with.
On the possibility of Sudanese going to Libya to fight, we have held discussions with the Sudanese Government on that very same issue. The Sudanese Government tells us that there’s no official Sudanese in any capacity in Libya. Rest assured we continue looking into that and we continue with our discussions on that. Over.
MR BROWN: Okay. Thank you. Assistant Secretary Nagy, appreciate you briefing us all today. And for everybody who jumped on the call, as this is the end of the call, the contents or the embargo on the contents is lifted. Everybody have a good day. All right.
ASSISTANT SECRETARY NAGY: Thanks a lot, Cale.
FED. May 21, 2020. Speech. Opening Remarks. Chair Jerome H. Powell. At "A Fed Listens Event: How Is COVID-19 Affecting Your Community?," sponsored by the Board of Governors of the Federal Reserve System, Washington, D.C. (via webcast)
Good afternoon. I just want to say a few words of welcome and thank everyone for being here—albeit in much different circumstances than would otherwise be expected.
We've held many Fed Listens events over the past 16 months, and it's important to note that these conversations aren't just a nice way to talk to people from around the country, although they are that. What they provide—what you provide—is insight that we just can't get anywhere else. You add depth and definition to the flood of data that flows through the Fed each day. You give us perspective on the economic realities that don't show up on a spreadsheet. You help us see those complex sets of data that analyze the American economy through the eyes of the people, businesses, and communities that make up the American economy. And that information is very helpful to us as we make our policy decisions.
So this is a valuable exercise for us. And an enjoyable one as well, so we truly do appreciate it on a number of levels. The Reserve Banks are also continuing to host conversations in communities across the country to help capture economic realities on the ground.
We are in the midst of an economic downturn without modern precedent. It was sudden, and it is severe. It has already erased the job gains of the past decade and has inflicted acute pain across the country. And while the burden is widespread, it is not evenly spread. Those taking the brunt of the fallout are those least able to bear it.
The pain of this downturn is compounded by the upending of normal life, along with great uncertainty about the future. In the best of times, predicting the path of the economy with any certainty is difficult. John Kenneth Galbraith famously said that economic forecasting exists to make astrology look respectable. We are now experiencing a whole new level of uncertainty, as questions only the virus can answer complicate the outlook.
Policies that address the resumption of economic activity are the province of elected officials at all levels of government, in close consultation with public health and medical professionals. But all of us have our own decisions to make as well, and those decisions will depend on public confidence that it is again safe to undertake various activities. From an economic perspective, we hope to learn a lot from your experiences and from what you're hearing from your colleagues, customers, and communities: How they're coping with that uncertainty now, how they're thinking about a future that's harder to plan for, and what matters most as they navigate the path.
The feedback we get from our community and business contacts has always been crucial in how we conduct monetary policy. In extraordinary times such as these, it takes on even greater importance. I want to thank you again for providing that insight and look forward to the conversation.
Thank you.
FED. May 21, 2020. Speech. Introductory remarks for the Fed Listens panel on the COVID-19 pandemic. Governor Lael Brainard. At “A Fed Listens Event: How Is COVID-19 Affecting Your Community?,” sponsored by the Board of Governors of the Federal Reserve System, Washington, D.C., (via webcast)
This will be the 15th Fed Listens event the Federal Reserve has conducted over 16 months. We have listened to diverse voices from every type of community in every sector and every district of our country. This rich set of perspectives is helping bring alive for us the importance of the review of our monetary policy strategy, tools, and communication practices led by Vice Chair Richard Clarida.
We have heard that maximum employment is not captured in a single national average, it brings vital benefits, and it takes a very long time to arrive in many neighborhoods. We have heard that inflation matters: Households at different life stages and in different places are balancing the cost of living against their earnings, while businesses are balancing wages and other costs against their pricing power. We have heard that access to credit matters, and that it is important to use the full range of tools to support the economy.
When we embarked on this listening journey, little did we know that our nation would experience the heartache and hardship associated with the COVID-19 pandemic—an emergency unprecedented in modern times.
Last year, we heard from small businesses that were expanding their workforces and investing in their communities. Today, many of those same businesses are running low on cash reserves and struggling to make rent and payroll—especially those in consumer services, such as restaurants and retail.
Last year, national unemployment had fallen to its lowest point in over five decades. Today, unemployment has surged to levels not seen since the Great Depression.
Last year, historically challenged groups were gaining a foothold in the workforce, and employers were investing in training and loosening job eligibility requirements. Today, the fallout from the COVID pandemic has cruelly hit groups with thinner financial cushions the hardest—workers in the lowest quarter of earnings, people of color, low and moderate income communities, and women disproportionately employed in services jobs.
As we think about how the Federal Reserve's tools and presence in communities around the country could best provide stability at this trying time and strong support for the recovery to come, we are turning again to many of the same voices we heard from earlier to learn how the COVID pandemic has affected your communities and what lies ahead.
AVIATION
U.S. Department of State. 05/21/2020. On the Treaty on Open Skies. Michael R. Pompeo, Secretary of State
Tomorrow, the United States will submit notice of its decision to withdraw from the Treaty on Open Skies to the Treaty Depositaries and to all other States Parties to the Treaty. Effective six months from tomorrow, the United States will no longer be a party to the Treaty. We may, however, reconsider our withdrawal should Russia return to full compliance with the Treaty.
A cornerstone of President Trump’s National Security Strategy is to protect the American people, the American way of life, and American security interests. As the President has made clear, the United States must take a clear-eyed look at any agreement through the prism of today’s reality and assess whether such agreement remains in the U.S. interest. After careful consideration, including input from Allies and key partners, it has become abundantly clear that it is no longer in America’s interest to remain a party to the Treaty on Open Skies.
At its core, the Treaty was designed to provide all signatories an increased level of transparency and mutual understanding and cooperation, regardless of their size. Russia’s implementation and violation of Open Skies, however, has undermined this central confidence-building function of the Treaty – and has, in fact, fueled distrust and threats to our national security – making continued U.S. participation untenable.
While the United States along with our Allies and partners that are States Parties to the Treaty have lived up to our commitments and obligations under the Treaty, Russia has flagrantly and continuously violated the Treaty in various ways for years. This is not a story exclusive to just the Treaty on Open Skies, unfortunately, for Russia has been a serial violator of many of its arms control obligations and commitments. Despite the Open Skies Treaty’s aspiration to build confidence and trust by demonstrating through unrestricted overflights that no party has anything to hide, Russia has consistently acted as if it were free to turn its obligations off and on at will, unlawfully denying or restricting Open Skies observation flights whenever it desires.
Russia has refused access to observation flights within a 10-kilometer corridor along its border with the Russian-occupied Georgian regions of Abkhazia and South Ossetia, thereby attempting to advance false Russian claims that these occupied territories are independent states. Russia’s designation of an Open Skies refueling airfield in Crimea, Ukraine, is similarly an attempt to advance its claim of purported annexation of the peninsula, which the United States does not and will never accept. Russia has also illegally placed a restriction on flight distance over Kaliningrad, despite the fact that this enclave has become the location of a significant military build-up that Russian officials have suggested includes short-range nuclear-tipped missiles targeting NATO. In 2019, Russia unjustifiably denied a shared United States and Canada observation flight over a large Russian military exercise.
These problems, moreover, follow on years of different Russian violations of the Treaty at various points since the Treaty entered into force, such as Russia’s violation, up until 2017, of improperly declaring force majeure to impose airspace restrictions related to VIP ground movements. These periodic and shifting violations highlight Russia’s willingness for many years now, to restrict or deny overflights whenever it desires. This strikes at the heart of the Treaty’s confidence-building purpose.
The problems raised by Russia’s selective implementation of Open Skies, moreover, go beyond just violating the Treaty’s provisions themselves. Its approach to Treaty implementation has fatally undermined the very intent of the Treaty as a confidence- and trust-building measure, for far from allowing Open Skies to contribute – as it was intended to do – to building regional trust and goodwill, Moscow has increasingly used Open Skies as a tool to facilitate military coercion. Moscow appears to use Open Skies imagery in support of an aggressive new Russian doctrine of targeting critical infrastructure in the United States and Europe with precision-guided conventional munitions. Rather than using the Open Skies Treaty as a mechanism for improving trust and confidence through military transparency, Russia has, therefore, weaponized the Treaty by making it into a tool of intimidation and threat.
To those who suggest the United States respond with reciprocal steps of our own analogous to Russia’s own provocative actions and violations, we say: doing that would only further undermine the core purpose of the Treaty, and create further tension and distrust between the United States and Russia. We will not contribute to further weaponizing and poisoning with distrust a Treaty that was intended to build confidence. The Open Skies Treaty was meant to contribute to international security, but it has been twisted and perverted in its implementation and now serves Russian purposes inimical to that security.
We understand that many of our Allies and partners in Europe still find value in the Treaty, and we are grateful for the thoughtful feedback they have offered us during the course of our review of these questions. If not for the value they place on the OST, we would likely have exited long ago. We are not willing, however, to perpetuate the Treaty’s current problems of Russian-engendered threat and distrust simply in order to maintain an empty façade of cooperation with Moscow.
Make no mistake: Russia alone bears responsibility for these developments, and for the continued erosion of the arms control architecture. We remain committed to effective arms control that advances U.S., Ally, and partner security, that is verifiable and enforceable, and that includes partners that comply responsibly with their obligations. But we cannot remain in arms control agreements that are violated by the other side, and that are actively being used not to support but rather to undermine international peace and security. As noted, we may be willing to reconsider this decision if Russia demonstrates a return to full compliance with this confidence-building Treaty, but without such a change of course from the Kremlin, our path will lead to withdrawal in six months’ time.
HONG KONG
U.S. Department of State. 05/22/2020. PRC Proposal to Impose National Security Legislation on Hong Kong. Michael R. Pompeo, Secretary of State
The United States condemns the People’s Republic of China (PRC) National People’s Congress proposal to unilaterally and arbitrarily impose national security legislation on Hong Kong. The decision to bypass Hong Kong’s well-established legislative processes and ignore the will of the people of Hong Kong would be a death knell for the high degree of autonomy Beijing promised for Hong Kong under the Sino-British Joint Declaration, a UN-filed agreement.
Hong Kong has flourished as a bastion of liberty. The United States strongly urges Beijing to reconsider its disastrous proposal, abide by its international obligations, and respect Hong Kong’s high degree of autonomy, democratic institutions, and civil liberties, which are key to preserving its special status under U.S. law. Any decision impinging on Hong Kong’s autonomy and freedoms as guaranteed under the Sino-British Joint Declaration and the Basic Law would inevitably impact our assessment of One Country, Two Systems and the status of the territory.
We stand with the people of Hong Kong.
________________
ORGANISMS
CORONAVIRUS
IMF. 22/05/2020. COVID-19 WORSENS PRE-EXISTING FINANCIAL VULNERABILITIES
- Tobias Adrian, Financial Counsellor and Director of the IMF's Monetary and Capital Markets Department
- Fabio Natalucci, Deputy Director of the Monetary and Capital Markets Department
Much the same way COVID-19 hits people with pre-existing health conditions more strongly, so is the pandemic-triggered economic crisis exposing and worsening financial vulnerabilities that have built up during a decade of extremely low rates and volatility.
Our recently released chapters 2-4 of the Global Financial Stability Report focus on three potential weak spots: risky segments in global credit markets, emerging markets, and banks. Should the ongoing economic contraction last longer or be deeper than currently expected, the resulting tightening of financial conditions may be amplified by these vulnerabilities, causing more instability or even a financial crisis.
Risky corporate credit markets
Risky segments of credit markets have expanded rapidly since the Global Financial Crisis. Potential fragilities include borrowers’ weaker credit quality, looser underwriting standards, liquidity risks at investment funds, and increased interconnectedness
On the positive side, our analysis finds that investors’ use of borrowed funds to finance their investments in these markets is less prevalent and that banks’ are not as heavily exposed to leveraged loans and high-yield bonds as in the past. Both factors contributed to the Global Financial Crisis a decade ago. The risk of investor runs have also lessened in some segments because of a prevalence of long-term, locked-in capital in the private debt and collateralized loan obligation markets.
In a severely-adverse scenario, overall bank losses in risky corporate credit markets should be manageable, although they could be substantial at a few large banks. Losses at nonbank financial institutions, however, could be more significant. Given that nonbank lenders have taken a more prominent role in these markets, this could hurt credit provision and lead to a longer and more severe recession.

Policymakers should act decisively to contain COVID-19’s fallout and support the flow of credit to firms. In only a couple of months through late March, prices in risky credit markets dropped by about two-thirds of the declines experienced during the entire Global Financial Crisis (a portion of the losses were since reversed). At the same time, interconnectedness across risky credit markets has likely contributed to market turbulence. A broad-based demand for cash has triggered selling pressures, and mutual funds have experienced large outflows (even though they have declined or reversed more recently). Regulators should encourage asset managers to be prudent and use all available liquidity management tools to address such risks.
Once the crisis is over, a comprehensive assessment of the sources of market dislocations and underlying vulnerabilities it unmasked should be conducted. For example, policymakers should consider whether including nonbanks in the regulatory and supervisory perimeter is warranted, given their expanded role in risky credit markets. In particular, a framework for macroprudential regulation of nonbank institutions, taking into consideration the global nature of these markets, should be developed and the macroprudential toolkit should be expanded.
Managing volatile portfolio flows
Since the beginning of the pandemic, emerging markets saw capital outflows of over $100 billion, nearly twice as big (relative to GDP) as those experienced during the Global Financial Crisis. While outflows have since subsided, this dramatic swing underscores the challenges in managing volatile portfolio flows and the risks this may pose to financial stability.

The prolonged period of low interest rates encouraged both borrowers and creditors to take on more risk. The resulting surge of portfolio inflows into riskier asset markets contributed to the buildup of debt and in some cases resulted in stretched valuations in emerging and frontier markets. As a result, they have become more reliant on foreign portfolio flows since the Global Financial Crisis.
Our analysis suggests that both bond and equity flows are much more sensitive to global financial conditions during periods of extreme flows than in normal times, while domestic fundamentals (such as economic growth, external vulnerabilities, domestic financial market depth, etc.) matter incrementally more for equities and local-currency-denominated bond flows. Furthermore, greater foreign investor participation in local currency bond markets that lack adequate depth can greatly increase the volatility of bond yields.
Emerging markets should manage external pressures by allowing their exchange rate to depreciate. If exchange-rate movements become disorderly, authorities should consider intervening in foreign exchange markets. Temporary capital flow management measures may also have to be used in the face of substantial outflows. Sovereign debt managers should prepare for longer-term funding disruptions by putting contingency plans in place to deal with limited access to external financing.
Banking: low rates, low profits?
Profitability has been a persistent challenge for banks in several advanced economies since the Global Financial Crisis. While very accommodative monetary policy was crucial to sustain economic growth during this period, providing support to bank profits, extremely low interest rates have also compressed banks’ net interest margins—the difference between interest earned on assets and interest paid on liabilities. Our analysis shows that, beyond the immediate challenges associated with the COVID-19 outbreak, a persistent period of low interest rates is likely to put further pressure on bank profitability in the coming years.
Healthy banks play a key role in any dynamic economy, and are crucial for financial stability. When unable to generate profits, banks are less likely to provide loans and other financial services to households and firms, starving the economy of much needed credit. A simulation exercise conducted for a group of nine advanced economies indicates that a large fraction of their banks, by assets, may fail to generate profits above their cost of equity in 2025.

The COVID-19 outbreak is an additional test to banks’ resilience. Once immediate crisis-related challenges recede, banks could resort to fee income increases or costs cutting to mitigate pressures on profits, but it may be challenging to fully allay such pressures. Meanwhile, taking excessive risks to recoup profits may sow the seeds of future problems. It is therefore crucial that policymakers rapidly find a balance that safeguards financial stability and financial institutions’ soundness, while supporting economic activity. Various strategies to preserve and strengthen capital should be considered, including restricting dividend payouts and share buybacks.
In the coming years, authorities will need to take on some of the “structural” challenges banks face. For example, financial sector authorities should incorporate the potential impact of low interest rates in their decisions and risk assessments. Supervisory capital planning and stress testing should include “lower-for-longer” scenarios, and the strength of business models in such an environment should be evaluated. Supervisors should also remain vigilant and prevent any buildup of excessive risks that could reduce the banking sector’s resilience.
FULL DOCUMENT: https://blogs.imf.org/2020/05/22/covid-19-worsens-pre-existing-financial-vulnerabilities/?utm_medium=email&utm_source=govdelivery
IMF. May 22, 2020. IMF COUNTRY FOCUS. The IMF's Support for Uganda's Health Care, Most Vulnerable, Businesses, and Stability
The coronavirus pandemic has hit Uganda’s economy and population severely. The country faces a significant contraction in economic activity, including a drop in domestic demand, supply disruption, and a decline in foreign direct investment and remittances.
To help the country overcome its economic difficulties, the IMF has approved a loan under the Rapid Credit Facility (RCF)—totaling around $491.5 million.
IMF Country Focus recently talked to the IMF’s resident representative in Uganda, Clara Mira, who described the economic situation confronting Uganda, and how the country will use the RCF resources from the IMF.
What has been the impact of COVID-19 on Uganda?
The COVID-19 pandemic is severely impacting Uganda’s economy. The country is feeling the reverberations from the decline in external global demand and the difficulties faced by key trading partners. This is expected to lead to a 45-50 percent decline in foreign direct investment, remittances, and tourism inflows compared to pre-shock projections.
Growth is now projected at 3.3 percent in 2019-20 (the fiscal year covers July 1- June 30), close to half the pace expected pre-crisis as the impact of the pandemic was acutely felt in the last few months of the fiscal year. Furthermore, with lockdown measures posing a challenge for vulnerable households, about 780,000 to 2.6 million Ugandans could fall into poverty.
With the decline in economic activity and increasing pressure on spending, large fiscal and external financing gaps are emerging.
What are the key risks to Uganda's growth?
The level of uncertainty is greater than usual. Our current growth projections assume a recovery in Uganda and the global economy in the second half of FY2020-21. If the crisis turns out to be more protracted, this would delay the recovery and make the financing gaps larger. Locust invasion, floods, and pre-election uncertainty are additional risks.
Low oil prices are also a significant risk for Uganda. While the country benefits from low oil prices as an oil importer, the current low price of oil may delay ongoing negotiations and decisions from Uganda and its joint venture partners about the start of oil production.
What emergency assistance has the IMF provided to Uganda?
To help alleviate the impact of the COVID-19 pandemic, Uganda requested emergency assistance of $491.5 million—equivalent to 100 percent of its quota—under the IMF’s RCF. This financial assistance is a zero-interest rate loan, with a grace period of five and a half years, and a 10-year maturity. This financial support—approved by the IMF Executive Board on May 6, 2020—will provide critical support to limit the decline in international reserves, contribute to heath care spending, shield the most vulnerable, and protect businesses from the shock of the COVID-19 crisis.
How are the resources from the RCF expected to be used?
The authorities plan to use about 70 percent of the RCF resources as a shock absorber to protect the country’s reserves—essential for maintaining macroeconomic stability (including low inflation). The remainder of the resources will be used for financing their response to the COVID-19 pandemic to support health care and social protection programs for the most vulnerable.
What measures will be introduced to ensure RCF money is used for its intended purpose?
The Ugandan authorities have committed to several transparency and accountability safeguards, including:
- separate reporting of funds received to allow easier tracking of resources;
- publication of all large procurement contracts, together with the names of awarded companies and their beneficial owners; and
- an independent audit on the use of the funds in about one year and publication of its results. The audit will include an ex-post validation of delivery of the large procurement contracts.
These measures are expected to enhance the transparency and accountability of the funds received to respond to the Covid-19 response.
What will happen to Uganda’s debt situation as a result of the RCF?
In the current difficult environment, our view is that protecting lives and people’s livelihoods is the priority. In any case, even if additional borrowing is expected to temporarily worsen debt-burden indicators (including debt-to-GDP and interest payments to revenue ratios), Uganda’s debt is expected to remain sustainable and at low risk of debt distress.
Once the crisis is over, it is expected that work will continue on implementing an appropriate fiscal framework focused on:
- enhancing domestic revenue mobilization—including by implementing Uganda’s recently approved Domestic Revenue Mobilization Strategy; and
- improving public investment management and debt management.
Ultimately, it is expected that fiscal consolidation will ensue in the medium term once the large scaling up of infrastructure is concluded and oil starts flowing.
Is Uganda interested in participating in the G-20 Debt Service Suspension Initiative?
The Ugandan authorities have expressed interest in benefiting from the G-20 Debt Service Suspension Initiative, which would help them deal with the impact of the COVID-19 pandemic. In their letter of intent for the RCF, they expressed their commitment to:
- enhancing spending the freed resources on COVID-related health, social and economic relief;
- monitoring and identifying this expenditure separately in budget monitoring reports; and
- disclosing all public sector debt, and not contracting new non-concessional debt during the suspension period, other than agreements under this initiative or in compliance with limits agreed under the IMF Debt Limit Policy (DLP) or the World Bank policy on non-concessional borrowing.
Why didn’t Uganda benefit from recent IMF debt service relief?
On April 13, the IMF Executive Board approved immediate debt service relief to 25 of the institution’s member countries under the IMF’s revamped Catastrophe Containment and Relief Trust (CCRT)—a part of the Fund’s response to help address the impact of the COVID-19 pandemic. Uganda was not included in the list of beneficiary countries for this initiative because it had no outstanding debt owed to the IMF at that time.
FULL DOCUMENT: https://www.imf.org/en/News/Articles/2020/05/21/na052120-the-imfs-support-for-ugandas-health-care-the-vulnerable-businesses-and-stability?utm_medium=email&utm_source=govdelivery
THE WORLD BANK GROUP. MAY 19, 2020. World Bank Group: 100 Countries Get Support in Response to COVID-19 (Coronavirus). Unprecedented Crisis Could Push Up to 60 Million into Extreme Poverty
WASHINGTON, May 19, 2020— The World Bank Group today announced its emergency operations to fight COVID-19 (coronavirus) have reached 100 developing countries – home to 70% of the world’s population. Since March, the Bank Group has rapidly delivered record levels of support in order to help countries protect the poor and vulnerable, reinforce health systems, maintain the private sector, and bolster economic recovery. This assistance, the largest and fastest crisis response in the Bank Group’s history, marks a milestone in implementing the Bank Group’s pledge to make available $160 billion in grants and financial support over a 15-month period to help developing countries respond to the health, social and economic impacts of COVID-19 and the economic shutdown in advanced countries.
“The pandemic and shutdown of advanced economies could push as many as 60 million people into extreme poverty – erasing much of the recent progress made in poverty alleviation,” said World Bank Group President David Malpass. “The World Bank Group has moved quickly and decisively to establish emergency response operations in 100 countries, with mechanisms that allow other donors to rapidly expand the programs. To return to growth, our goal must be rapid, flexible responses to tackle the health emergency, provide cash and other expandable support to protect the poor, maintain the private sector, and strengthen economic resilience and recovery.”
Of the 100 countries, 39 are in Sub-Saharan Africa. Nearly one-third of the total projects are in fragile and conflict-affected situations, such as Afghanistan, Chad, Haiti, and Niger. The International Finance Corporation (IFC) and Multilateral Investment Guarantee Agency (MIGA) have also fast-tracked support to businesses in developing countries, including trade finance and working capital to maintain private sectors, jobs and livelihoods.
The Bank Group’s support through grants, loans and equity investments will be supplemented by the suspension of bilateral debt service, as endorsed by the Bank’s governors. IDA-eligible countries that request forbearance on their official bilateral debt payments will have more financial resources to respond to the COVID-19 pandemic and fund critical, lifesaving emergency responses.
“The bilateral debt-service suspension being offered will free up crucial resources for IDA countries to fund emergency responses to COVID-19,” said Malpass. “Nations should move quickly to substantially increase the transparency of all their governments’ financial commitments. This will increase the confidence in the investment climate and encourage more beneficial debt and investment in the future.”
The Bank Group’s operational response will strengthen health systems, support the poorest households, and create supportive conditions to maintain livelihoods and jobs for those hit hardest. Country operations will deliver help to the poorest families through cash transfers and job support; maintain food security, nutrition and continuity of essential services such as clean water and education; target the most vulnerable groups, including women and forcibly displaced communities, who are most likely to be hit hard; and engage communities to support vulnerable households and foster social cohesion. The scale and speed of the Bank Group’s response is critical in helping countries mitigate the adverse impacts of this crisis and prioritize the human capital investments that can accelerate recovery.
The Bank Group’s operations in 100 countries aim to save lives, protect livelihoods, build resilience, and boost recovery by:
Strengthening health systems, monitoring, and prevention, particularly in low-income countries and in fragile and conflict-affected situations. The Bank Group’s health response addresses emergency containment and mitigation needs for COVID-19, including strengthening countries’ health systems to treat severe cases and save lives. Establishing and supporting efforts in fragile and conflict-affected situations is a priority, given the rapidly growing number of cases in some of these countries.
- Disbursement is already underway on $20 million to Senegal and $35 million to Ghana, which includes funding to strengthen disease surveillance systems, public health laboratories, and epidemiological capacity for early detection. A $20 million IDA grant was approved for Haiti that aims to enhance testing, minimize spread through contact tracing of confirmed cases, and provide laboratory and protective equipment for health care staff.
Scaling up social protection: The Bank Group is leveraging countries’ existing social protection systems to help families and businesses restore income, preserve livelihoods, and compensate for increasing prices and unexpected medical expenses. These safety nets will need to be augmented with safe, direct food distribution, accompanied by key information on nutrition, social distancing, and hygiene.
- In Uzbekistan, a $95 million financing package includes funding for cash support to low-income families and one-off unemployment benefits, while in Tunisia $100 million is being reallocated from the existing portfolio to help finance additional social benefits and grants to small and medium-size enterprises.
Supporting businesses and preserving jobs: The International Finance Corporation (IFC) continues to implement its $8 billion fast-track financing facility, which aims to keep companies in business and preserve jobs. Close to 300 clients have requested support, and the facility may be oversubscribed. Building on this effort and market demand, IFC aims to provide $47 billion in financing to developing countries over 15 months. Cumulative COVID-19 related commitments under IFC’s Global Trade Finance Program, which supports small and medium-sized enterprises involved in global supply chains, have totaled 1,200 transactions across 33 countries for $1.4 billion, with 51% of this volume in low-income and fragile countries.
Procuring medical equipment and supplies: Many developing countries import most, and in some cases all, of the medical supplies critical for fighting COVID-19, leaving them extremely vulnerable to supply disruptions and export restrictions.
- In Pakistan, the first consignments of personal protective equipment (PPE) – including masks, gloves, protective suits, gowns, coveralls, shoe covers, goggles, and face shields – have already been delivered to doctors and paramedics. This assistance is part of a larger package that includes $25 million for emergency cash transfers to poor and vulnerable households. On April 23, the World Bank approved $100 million for the Philippines to procure materials including PPE, essential medicines, test kits, and key equipment such as mechanical ventilators, cardiac monitors, and portable x-ray machines. In Iraq, the World Bank redeployed $33.6 million to help finance the supply of essential equipment and supplies and strengthen intensive care unit (ICU) capacity at public hospitals.
The Bank Group is helping countries access critically needed supplies and equipment, for example, by identifying interested suppliers and negotiating prices and conditions.
FULL DOCUMENT: https://www.worldbank.org/en/news/press-release/2020/05/19/world-bank-group-100-countries-get-support-in-response-to-covid-19-coronavirus?cid=ECR_E_NewsletterWeekly_EN_EXT&deliveryName=DM65219
________________
ECONOMIA BRASILEIRA / BRAZIL ECONOMICS
CORONAVÍRUS
FGV. 22/05/2020. Impactos do COVID-19. O uso da inteligência artificial na mitigação da epidemia

O uso da inteligência artificial, simulações computacionais e os modelos matemáticos têm sido grandes aliados no combate à pandemia. Essas ferramentas tecnológicas são utilizadas para diminuir picos de infectados em determinado momento, que poderia comprometer os sistemas de saúde, por exemplo. Na China, o sofisticado sistema de monitoramento facial utilizado na população fez com que se identificassem quais pessoas circularam em determinados locais e com quem tiveram contato para encontrar possíveis contaminados pelo vírus. Quem explica o assunto é o pesquisador Renato Rocha Souza, da Escola de Matemática Aplicada da FGV.
VÍDEO: https://www.youtube.com/watch?v=mQ-1RcJZbCU&feature=youtu.be
FGV. IBRE. 21/05/2020. Impactos da pandemia de Covid-19 novo coronavírus nas empresas e consumidores
Viviane Seda Bittencourt
Em maio de 2020, a FGV IBRE novamente incluiu quesitos suplementares nas sondagens para continuar monitorando os impactos econômicos da pandemia no dia a dia de consumidores e empresas. Os resultados preliminares desta pesquisa foram produzidos com dados coletados entre o início do mês e o dia 13 de maio mediante consultas a 2528 empresas e 1300 consumidores.
Quesitos aplicados as empresas
No âmbito empresarial, as empresas dos setores industriais, de Serviços, Comércio e Construção, responderam a dois questionamentos: i) sobre o tempo necessário para retornarem à normalidade após o pior momento desta primeira onda da pandemia; e ii) sobre as mudanças que já ocorreram nas relações trabalhistas desde o início da crise.
Com relação ao tempo de recuperação das atividades para níveis considerados normais, as respostas foram bastante heterogêneas entre os setores. Na Indústria e do Comércio, a resposta mais frequente, mencionada por mais de 30% das empresas, foi de que a normalidade só retornaria a partir de 2021. Já nos setores de Serviços e Construção a maioria acredita que a normalidade retornará até o final do terceiro trimestre deste ano.
Gráfico 1 – Percepção das empresas sobre impacto da pandemia na atividade (proporção de respostas em %)
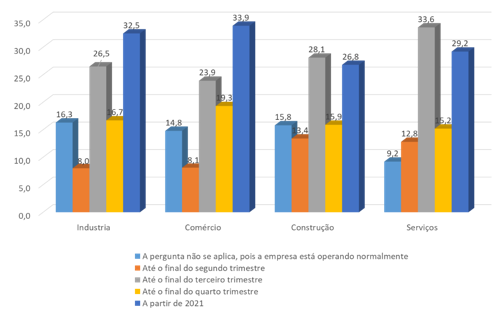
Fonte: FGV IBRE
Os resultados parecem fazer mais sentido quando analisados os segmentos de cada setor. Dentre os segmentos com predominância de empresas projetando retorno à normalidade apenas em 2021 estão: serviços de atividade imobiliária (100%), indústria produtora de petróleo e biocombustíveis (84%), serviços de alojamento (57,1%), produção de minerais não metálicos (53%), outros serviços de transporte (52%), indústria de tecidos, vestuário e calçados (52,3%), comércio de veículos, motos e peças (44,9%), móveis e eletrodomésticos (44,4%) e na construção de edificações não residenciais (41,6%). A maioria destes segmentos estava entre os que registraram os maiores percentuais de empresas percebendo um impacto muito negativo da pandemia em suas atividades em abril.
Mas existem exceções e empresas que afirmam estar operando normalmente: fabricação de produtos farmacêuticos (45,9%), comércio de hiper e supermercados (38,1%), serviços da construção relacionadas a obras de infraestrutura para engenharia elétrica e telecomunicações (35,4%), fabricação de produtos de plástico (32,5%), celulose e papel (32,3%) e fabricação de produtos alimentícios (29,2%).
Tabela 1 – Tempo para que a empresa retorne à normalidade (em %)
Setores e segmentos
|
Não se aplica, a empresa está operando normalmente
|
Até o final do segundo trimestre
|
Até o final do terceiro trimestre
|
Até o final do quarto trimestre
|
A partir de 2021
|
Serviços
|
9,2
|
12,8
|
33,6
|
15,2
|
29,2
|
Serviços prestados às famílias
|
4,4
|
26,1
|
25,5
|
13,3
|
30,7
|
Serviços de informação e comunicação
|
8,0
|
5,8
|
59,0
|
7,7
|
19,5
|
Serviços profissionais, adm. e complementares
|
7,0
|
19,1
|
28,7
|
14,0
|
31,2
|
Transportes, serviços auxiliares aos transp. e correio
|
11,4
|
11,8
|
15,4
|
25,5
|
35,9
|
Atividades imobiliárias
|
0,0
|
0,0
|
0,0
|
0,0
|
100,0
|
Serviços de manutenção e reparação
|
0,0
|
0,0
|
0,0
|
0,0
|
0,0
|
Outras atividades de serviços
|
21,7
|
10,8
|
51,2
|
0,0
|
16,3
|
Indústria de Transformação
|
16,3
|
8,0
|
26,5
|
16,7
|
32,5
|
Bens duráveis
|
4,2
|
10,3
|
45,0
|
4,3
|
36,2
|
Bens intermediários
|
16,5
|
9,5
|
29,4
|
12,1
|
32,5
|
Bens de Capital
|
1,3
|
15,4
|
17,9
|
34,9
|
30,5
|
Bens não duráveis
|
24,0
|
8,9
|
23,0
|
12,2
|
31,9
|
Comércio
|
14,8
|
8,1
|
23,9
|
19,3
|
33,9
|
Veículos, motos e peças
|
5,4
|
6,2
|
23,5
|
20,0
|
44,9
|
Material para Construção
|
4,9
|
6,7
|
28,1
|
20,3
|
40,0
|
Hiper e supermercados
|
17,6
|
8,7
|
23,3
|
19,1
|
31,3
|
Tecidos, vestuário e calçados
|
38,1
|
8,4
|
27,4
|
14,4
|
11,7
|
Móveis e eletrodomésticos
|
0,0
|
0,0
|
19,6
|
28,1
|
52,3
|
Outros produtos varejistas
|
11,6
|
13,8
|
17,5
|
12,7
|
44,4
|
Setor da Construção
|
15,8
|
13,4
|
28,1
|
15,9
|
26,8
|
Preparação do Terreno
|
10,7
|
21,8
|
19,1
|
23,2
|
25,2
|
Construção de Edifícios e Obras de Engenharia Civil
|
14,5
|
12,7
|
29,9
|
13,2
|
29,7
|
Obras de Infraestrutura para Eng. Elétrica e para Telecom.
|
35,4
|
13,9
|
29,2
|
17,6
|
3,9
|
Obras de Instalações
|
2,5
|
13,3
|
32,8
|
21,1
|
30,3
|
Obras de Acabamentos
|
13,4
|
7,7
|
31,1
|
32,5
|
15,3
|
Outros Serviços para Construção
|
22,6
|
14,9
|
13,9
|
17,5
|
31,1
|
Obras de Infraestrutura
|
23,0
|
9,5
|
30,1
|
15,6
|
21,8
|
Serviços Especializados para Construção
|
8,5
|
15,7
|
27,0
|
20,9
|
27,9
|
Fonte: FGV IBRE
Em março, o Governo lançou um Programa Emergencial de Proteção ao Emprego possibilitando às empresas nesse momento de pandemia maior flexibilidade em relação ao quadro de funcionários como: redução proporcional de salário e jornada de trabalho, suspensão temporária de contrato de trabalho entre outros. Visando entender como as empresas se adaptaram a este período em que houve necessidade de medidas restritivas e isolamento social, foi incluído um quesito sobre as medidas tomadas pelas empresas na área trabalhista desde o início da crise. As empresas podiam marcar quantas opções quisessem.
Em todos os setores, exceto no Comércio, a maioria das empresas afirmou ter adotado parcial ou integralmente o teletrabalho (ou home office) como uma das estratégias para enfrentar o período. O Home Office foi adotado por 80,4% das indústrias, 68,6% das empresas prestadoras de Serviços e 59,6% das empresas de Construção. No Comércio, apenas 26,6% das empresas passaram a se utilizar deste artifício.
Mas essa não foi a única estratégia traçada para o período pelo setor de Serviços, que vem sendo o mais afetado pela pandemia. Os dados da prévia dos quesitos especiais das sondagens de maio, mostra um cenário bastante difícil para o setor que conta com a maior proporção de empresas que realizaram antecipação de férias individuais de seus colaboradores (65%), reduziram proporcionalmente salários e jornadas de trabalho (46,4%), além de enxugarem seu quadro de pessoal (45,8%). Chama atenção também o alto percentual de empresas que afirmam terem suspendido contratos de trabalho (42,3%), a maior proporção entre os setores.
O Comércio tem o maior percentual de empresas dizendo não ter adotado nenhuma das medidas (21,9%), algo que ocorre por influência da relativa resiliência dos segmentos de hiper e supermercados (30,3%) e de outros varejistas (28,9%). A estratégia mais citada pelo setor para enfrentar a crise foi a antecipação de férias individuais (54,1%).
Tabela 2 – Medidas tomadas pelas empresas com relação ao quadro de pessoal* (em %)
Renda familiar mensal
|
Indústria
|
Comércio
|
Construção
|
Serviços
|
A empresa não adotou nenhuma medida
|
4,8
|
21,9
|
9,4
|
4,6
|
Redução do quadro de funcionários
|
24,1
|
36,7
|
44,4
|
45,8
|
Redução proporcional de salários e jornada de trabalho
|
40,5
|
23,1
|
27
|
46,4
|
Suspensão de contrato de trabalho
|
27,9
|
25,5
|
26,6
|
42,3
|
Teletrabalho (home office)
|
80,4
|
26,6
|
59,6
|
68,6
|
Antecipação de férias individuais
|
58,5
|
54,1
|
56,5
|
65,0
|
Decretação de férias coletivas
|
18,2
|
9,7
|
6,7
|
3,3
|
Banco de horas
|
28,4
|
19,8
|
21,2
|
35,1
|
Antecipação de feriados não religiosos
|
5,2
|
3,2
|
1,7
|
3,9
|
Outros
|
8,2
|
4,7
|
3,7
|
4,1
|
*As empresas podiam marcar quantas opções desejassem, por isso o resultado soma mais de 100%
Fonte: FGV IBRE
Entre as medidas tomadas pelas empresas que mais afetam os trabalhadores estão: redução de quadro funcional, redução proporcional de salários e jornada de trabalho e suspensão do contrato de trabalho.
No setor de Serviços que mais teve que reduzir o total de pessoal ocupado (medida adotada por 45,8% das empresas), os segmentos mais afetados foram os serviços de alimentação (64,7%), transporte rodoviário (57,5%) e serviços de alojamento (57,1%). Mas em outros setores, alguns segmentos reduziram seu quadro de funcionários com ainda maior frequência. Foram os casos de empresas produtoras de couros e calçados (68,3%), na indústria, e na construção de edificações não residenciais (61,9%).
A redução de salário e jornada de trabalho evita demissões mas reduz a renda disponível dos trabalhadores no momento, podendo ser adotada pelas empresas por um período de até 90 dias. Cerca de 70% das empresas produtoras de bens duráveis na indústria de transformação adotaram medidas como essa. Segmentos como vestuário (98,8%), veículos automotores (92,5%) e petróleo e biocombustíveis (85,2%) foram os que mais citaram essa medida.
A suspensão do contrato de trabalho poderá ser compensada em parte pelo Governo. O setor de Serviços também foi o que mais utilizou esse recurso para minimizar os efeitos da pandemia em suas atividades (46,4%). A medida utilizada por 100% das empresas de atividades imobiliárias pesquisadas e por 85,7% das empresas de serviços de alojamento. Na indústria, 99,2% das empresas produtoras de couros e calçados também utilizaram esse recurso.
Vale a pena lembrar que grande parte dos segmentos que foram citados acima já tinham no quesito especial do mês anterior previsto um tempo de recuperação de atividade mais longo e que suas atividades apenas voltarão à normalidade em 2021, o que já antecipa tempos difíceis para estas empresas face ao limite de tempo permitido para adoção destas medidas, de 90 dias.
Tabela 3 – Medidas tomadas pelas empresas com relação ao quadro de pessoal* (em %)
Opção de respostas com maior percentual
|
Segmentos
|
% de empresas nessa opção
|
Redução do quadro de funcionários
|
Indústria de couros e calçados
|
68,3
|
Serviços de alimentação
|
64,7
| |
Construção de edificações não-residenciais
|
61,9
| |
Serviços de transporte rodoviário
|
57,5
| |
Serviços de alojamento
|
57,1
| |
Comercio de tecidos, vestuário e calçados
|
52,3
| |
Serviços
|
45,8
| |
Redução proporcional de salários e jornada de trabalho
|
Indústria de vestuário
|
98,8
|
Veículos automotores
|
92,5
| |
Serviços de alojamento
|
85,7
| |
Petróleo e biocombustíveis
|
85,2
| |
Indústria têxtil
|
78,9
| |
Informática e eletrônicos
|
78,7
| |
Serviços de transporte rodoviário
|
74,0
| |
Serviços
|
46,4
| |
Suspensão do contrato de trabalho
|
Atividades imobiliárias
|
100,0
|
Indústria de vestuário
|
99,2
| |
Serviços de alojamento
|
85,7
| |
Serviços de alimentação
|
70,6
| |
Serviços
|
42,3
|
Fonte: FGV IBRE
A análise dos microdados da pesquisa mostra que as empresas tomando as medidas mais duras para os trabalhadores são as que estão projetando redução de demanda futura e que por isso tendem a achar que suas atividades demorarão mais tempo a voltar à normalidade.
Quesitos aplicados para os Consumidores
Entre os 1300 consumidores consultados, 53,5% das famílias impactadas de alguma forma em seus trabalhos pela pandemia. 43,9% informaram que foram impedidos de trabalhar devido ao isolamento social, 24,9% das famílias tiveram redução de seus salários proporcional a jornada de trabalho, 14,7% mencionaram que ao menos uma pessoa da família teve seu contrato de trabalho suspenso e 12,7% citaram que uma pessoa do núcleo familiar foi demitida. Os que mais sofreram neste último caso foi a faixa de renda mais baixa (20,6%).
Gráfico 2 – Impacto da pandemia no emprego das famílias (em %)
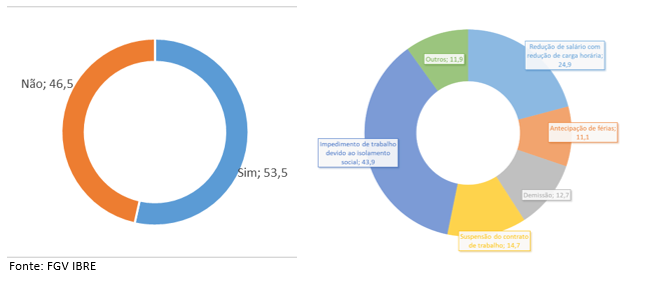
Fonte: FGV IBRE
Os resultados mostram os impactos no consumo: 78,3% dos consumidores continuam afirmando que estão comprando apenas produtos e serviços essenciais, contra 79,1% de abril. Para os que possuem renda familiar mensal até R$ 2,1 mil isso ainda fica mais evidente (89%). 21% dos com maior nível de renda ainda não se sentem afetados.
Tabela 4 – Impacto da pandemia nos gastos das famílias (em %)
Renda familiar mensal
|
Por enquanto, não foram afetados
|
Estamos postergando compras supérfluas e a prazo
|
Estamos comprando somente o essencial
|
Não sei/não quero responder
|
Geral
|
14,6
|
5,3
|
78,3
|
1,8
|
Até R$2.100,00
|
8,0
|
0,8
|
89,1
|
2,1
|
Entre R$2.100,01 e R$4.800,00
|
12,3
|
5,7
|
80,5
|
1,5
|
Entre R$4.800,01 e R$9.600,00
|
15,7
|
4,9
|
77,1
|
2,3
|
Mais de R$9.600,01
|
21,9
|
9,3
|
67,6
|
1,2
|
Fonte: FGV IBRE
Pelo lado dos consumidores, as famílias com renda mais baixa são as mais afetadas, seja pela perda de emprego por algum integrante, pela suspensão temporária do contrato de trabalho ou pela redução parcial de salários e jornada de trabalho, o que no curto prazo tende a gerar inadimplência já que elas são as que mais estão usando recursos de poupança para quitar as despesas correntes e que estão endividadas, o que vem levando ao maior nível de estresse financeiro desde 2005.
DOCUMENTO: https://blogdoibre.fgv.br/posts/impactos-da-pandemia-de-covid-19-novo-coronavirus-nas-empresas-e-consumidores
FGV. IBRE. 22/05/2020. Recuperação
O governo chinês decidiu esta semana, na sessão anual do Congresso Nacional do Povo, que não haverá uma meta para o crescimento do PIB este ano. A decisão, que parece sensata frente ao cenário de incerteza quanto à recuperação das economias globais do choque provocado pela pandemia do novo coronavírus, pode embaralhar a leitura internacional – bem como a doméstica – sobre os rumos que o país tomará este ano, avalia Livio Ribeiro, pesquisador da Economia Aplicada do FGV IBRE. “É a primeira vez em quase trinta anos que isso acontece. Os chineses poderão ter dificuldade em trabalhar sem uma referência, e o mundo poderá ter dificuldade em monitorar o que acontece no país. É um voo cego, que arrisca ser contraproducente”, avalia.
No Congresso, o governo chinês reiterou o que já estava no radar dos analistas, de que seu foco se concentrará em impulsionar investimentos e na geração de empregos. A diretriz é acelerar. Definiu-se ampliar a meta de emissão dos governos subnacionais em 50% comparado a 2019, além de engordar a indicação de déficit primário, de 2,8% para 3,6% este ano. “Este último não chega a ser um indicador relevante, pois em geral a meta não é cumprida, mas reforça a sinalização de um aumento de gastos”, diz Ribeiro. Já a meta fixada para a taxa de desemprego no final de 2020 é de 6% - próximo da taxa atual, indicando que a preocupação é frear sua evolução além disso. “Nas palavras do primeiro-ministro Li Keqiang, o governo fará tudo para estabilizar e expandir o emprego, nessa ordem”, diz Ribeiro.
No campo da política monetária, pouco se mexeu, com uma meta de inflação fixada em torno de 3,5%. Ribeiro ressalta, entretanto, a menção explícita de possibilidade do uso de novas ferramentas para estimular a economia real diretamente – o que pode representar crédito direcionado com custo mais baixo. “No caso da manutenção de uma meta relativamente alta frente ao processo de recuo da inflação, com o choque de proteína cedendo, serviços também em baixa, considero que é uma sinalização de que privilegiarão uma política monetária acomodatícia.”
O pesquisador do IBRE avalia que a estratégia do país – de voltar à fórmula da “velha China”, caracterizada por forte investimento público, especialmente em infraestrutura – pode ser positiva para o Brasil, cuja pauta exportadora ao país é forte em bens agropecuários e minério. Mas ressalta que um acirramento das relações comerciais entre Estados Unidos e China pode comprometer esse quadro, devido ao alinhamento do governo brasileiro com os norte-americanos. “Era esperado que se Trump identificar que seu projeto político está sob ameaça, os ataques à China voltariam à pauta. O governo brasileiro precisa estar atento quanto às implicações desse cenário para nossas exportações”, diz. A princípio, um dos países que mais se beneficiaria de uma retaliação da China à política externa brasileira seria a Austrália, exportadora tanto de minério quanto de carne. O país, entretanto, também já motivou o descontentamento chinês ao questionar a origem do novo coronavírus, o que fez Beijing barrar a entrada de carne de produtores australianos. "Se soubermos nos posicionar nesse cenário, só teremos a ganhar", conclui Ribeiro.
DOCUMENTO: https://prd-portalibre.fgv.br/noticias/recuperacao
FGV. IBRE. 21/05/2020. Pandemia
Incertezas quanto ao horizonte de normalização da economia, dependente da evolução do contágio por coronavírus, dificulta mensurar tanto o nível de adesão quanto o impacto fiscal das políticas de enfrentamento da pandemia, afirma Vilma Pinto, pesquisadora da Economia Aplicada do FGV IBRE.
No Boletim Macro IBRE de maio, Vilma exemplifica esse problema citando, entre outros casos, o do Benefício Emergencial de Preservação do Emprego e da Renda (BEM), lançado pelo Governo Federal por Medida Provisória (MP 936/2020), em 1 de abril. O programa prevê a suspensão do trabalho por 60 dias ou redução de jornada e salário por 90 dias, período em que o Tesouro se compromete a pagar um benefício emergencial ao trabalhador, com base de cálculo equivalente à do seguro-desemprego a que o funcionário teria direito, desde que o empregador se comprometa a mantê-lo no emprego por período similar ao da duração da ajuda. A expectativa inicial do governo era investir R$ 51,2 bilhões no programa e preservar cerca de 8,5 milhões de empregos. Posteriormente, a dotação orçamentária foi ampliada para R$ 56,64 bilhões, correspondendo a 21% dos gastos para enfrentamento do coronavírus com impacto no primário aprovados até o dia 20 de maio – o que exclui, por exemplo, o pacote de ajudas aos estados, que ainda dependia de sanção presidencial.
Até o dia 12 de maio, última data de publicação de balanço detalhado do BEM, empregadores haviam incluído 7,2 milhões de funcionários no programa, somando uma ajuda de R$ 12,7 bilhões, com valor de benefício médio mensal de R$ 720. Para Vilma, é uma adesão positiva, cuja resposta pode ser melhor que a de outras políticas, como os programas de crédito que demandam a mesma contrapartida de manutenção do emprego. Em um mês de meio, o Programa Emergencial de Suporte a Empregos (Pese), por exemplo, desembolsou apenas R$ 1,6 bilhão, de um total de R$ 40 bilhões disponíveis para financiamento de folha, preservando 1,1 milhão de empregos. “No caso do BEM, é um bom sinal para o curto prazo, mas a indefinição sobre o cenário de retomada não garante que depois desse respiro de quatro ou seis meses esses empregos continuarão mantidos”, afirma. A pesquisadora também ressalta que, mesmo sendo expressivo, esse número inicial ainda cobre uma parcela restrita do emprego formal. De acordo à PNAD Contínua, no trimestre de janeiro a março de 2020 os empregados do setor privado com carteira assinada, exclusive trabalhadores domésticos, somava 33 milhões – meio milhão a menos do que no trimestre anterior.
DOCUMENTO: https://portalibre.fgv.br/noticias/pandemia
FGV. IBRE. 20/05/2020. Voltando ao trabalho em tempos de Coronavírus
Marcio Ronci, Pesquisador associado do FGV IBRE
Quarentenas compulsórias e fechamento dos negócios para conter o coronavírus são medidas absolutamente necessárias, mas ao mesmo tempo estão causando sérios problemas sociais e arruinando a economia. Não há dúvida sobre a necessidade de medidas sanitárias drásticas, mas também é apropriado reconhecer o custo causado por essas mesmas medidas em termos de vidas e deslocamento econômico se as medidas forem indevidamente prolongadas. É bastante provável que o relaxamento das medidas sanitárias e a reabertura da economia sejam feitas de forma confusa sob condições imperfeitas e venham mais cedo do que esperado, motivadas por deslocamentos sociais causados pela quarentena.
Medidas sanitárias drásticas são essenciais no curto prazo para diminuir a propagação do vírus e permitir que as autoridades de saúde, hospitais e médicos se preparem melhor para servir a população, como corretamente apontaram Ailton Braga e Sebastião Moreira Jr. no BLOG do IBRE. Existe um consenso geral entre autoridades de saúde de que o relaxamento dessas medidas deve ser gradual e seguir pré-condições, tais como a implementação de medidas apropriadas para reduzir a velocidade de propagação do vírus, aumentar a capacidade da rede de saúde e monitorar a evolução do contágio do vírus, por meio de um planejamento cuidadoso e gerenciamento eficiente. Entretanto, essas condições são quase impossíveis de serem atendidas no curto prazo, dada a limitada capacidade de gerenciamento dos governos federal e estaduais.
A capacidade gerencial dos governos e a eficiência dos sistemas de saúde parecem ser o fator determinante para combater com sucesso a disseminação do vírus, conforme sugerido pelo desempenho muito melhor dos países do norte da Europa (Alemanha, por exemplo) em comparação com os países do sul (Espanha e Itália) no combate ao coronavírus. No caso da Alemanha, a quarentena diminuiu o ritmo da propagação de doenças, permitindo que o sistema de saúde mais eficiente tivesse capacidade de cuidar dos doentes, permitindo após um mês a gradual reabertura da economia, enquanto na Itália a capacidade de gestão limitada do governo e o sistema de saúde sistema subfinanciado causaram um resultado pior. Além disso, existem evidências de que as quarentenas para serem efetivas devem ser implementadas no início do surto de vírus, como sugere o caso da Nova Zelândia que impôs uma política agressiva de confinamento. No Brasil, adiar o Carnaval e fechar voos internacionais em fevereiro foi possivelmente uma oportunidade perdida.
Quanto mais a quarentena durar, a perda de vidas devido à recessão reduzirá parte dos benefícios decorrentes da quarentena e aumentará ainda mais a pressão sobre o Sistema Único de Saúde (SUS). Quarentena e fechamento de empresas por longos períodos resultarão em um grande número de falências, um aumento dramático no desemprego e na perda de vidas: para o Brasil, estimativas indicam que, para um aumento de 1 ponto percentual no desemprego, em média, a taxa de mortalidade aumenta e 20 pessoas por 1.000.000 habitantes por ano, de acordo a estudo publicado na Lancet Global Health. Um aumento no desemprego de 5 a 10 pontos percentuais pode causar uma perda de vidas entre 42.000 a 85.000 por um período de dois anos, que é substancial quando comparado ao total de 7.000 mortes relacionadas ao coronavírus até o momento. Ademais, com o bloqueio da atividade econômica, políticas monetárias e fiscais expansionistas terão um efeito mínimo sobre a atividade econômica pois os bens e serviços não poderão ser fornecidos à população porque empresas estão compulsoriamente fechadas.
Devemos aprender as lições do coronavírus para preparar-nos para futuras epidemias virais e permitir que economia possa operar de maneira mais normal possível. A ideia original de quarentena não foi suficiente para conter o vírus no Brasil até o momento, principalmente por causa da capacidade limitada do governo e do sistema de saúde. Estas são questões de longo prazo que não serão resolvidas da noite para o dia. Investir no SUS é essencial bem como estabelecer claros protocolos para medidas sanitárias, quarentenas e reabertura da economia. No momento, estender a quarentena causará mais danos à economia, custará vidas, e não nos protegerá contra o retorno do coronavírus no outono ou de alguma outra pandemia no próximo ano.
Dada a capacidade limitada dos governos federal e estadual e aprofundamento da recessão, é provável que o relaxamento das medidas sanitárias e a reabertura da economia sejam de forma confusa sob condições imperfeitas e venham mais cedo do que esperado, motivados por deslocamentos sociais causados pelo atual bloqueio da economia. Se o governo federal e os estados não concordarem em reabrir a economia da economia, a agitação social e empresas privadas buscando mandatos judiciais para abrir seus negócios forçarão os governos estaduais a fazê-lo — como exemplifica a situação atual dos Estados Unidos, onde 31 de 50 estados estão reabrindo suas economias, e protestos nas ruas e ações judiciais estão pressionando outros estados a fazer o mesmo.
É absolutamente necessário ter uma data clara para retornar o país às condições normais de negócios o mais rápido possível para reduzir incertezas, minimizar falências e desemprego. Ao mesmo tempo, a disseminação do coronavírus deve ser contida na medida do possível. É necessário um diálogo entre o setor privado, governos e autoridades de saúde para introduzir maneiras inovadoras de produzir e fornecer serviços aos clientes e proteger seus funcionários. As diretrizes devem ser de caráter educativo e unificadas para todos os estados. Após o término da quarentena, medidas sanitárias não devem ser compulsórias e arbitrárias, mas sim educativas e de acordo com os valores democráticos de uma sociedade aberta que confia no bom senso de seus cidadãos.
DOCUMENTO: https://portalibre.fgv.br/noticias/voltando-ao-trabalho-em-tempos-de-coronavirus
CNI. 22/05/2020. Movimentação de carga aérea cai 48% em abril na comparação com mesmo mês de 2019. Levantamento da CNI mostra que a queda em relação a março de 2020 foi de 42%. No primeiro quadrimestre do ano, redução foi de 17% na comparação com 2019
O transporte de carga nos aeroportos brasileiros totalizou 57 mil toneladas em abril de 2020, quantidade 48% inferior à verificado no mesmo mês de 2019. Os dados fazem parte de levantamento realizado pela Confederação Nacional da Indústria (CNI) com informações da Agência Nacional de Aviação Civil (ANAC).
Nos primeiros quatro meses de 2020, o total de cargas transportadas foi de 353 mil toneladas, o que representa 17% a menos que o verificado no primeiro quadrimestre de 2019. O volume diz respeito ao total de carga paga e de correio transportadas nos mercados doméstico e internacional.
A queda em 2020 se concentrou no mês de abril, quando as medidas de restrição à circulação em função da pandemia da covid-19 estavam em vigor em todo o país. Na comparação com março de 2020, a redução observada no total de cargas transportadas foi de 42%, ou 41 mil toneladas de cargas a menos. O mercado doméstico, que representou 22% do total transportado em abril de 2020, foi o que apresentou a maior queda, com índice 67% inferior na comparação com o mesmo mês de 2019.
Movimentação mensal de carga aérea por mercado (milhares de toneladas)

A queda observada em 2020 também tem relação com a desaceleração no total de cargas transportadas ao longo de 2019. Após o recorde de 1,39 milhão de toneladas movimentadas em 2018, o ano de 2019 movimentou um total de 1,28 milhão de toneladas, índice 8% inferior ao do ano anterior. O recuo ocorreu principalmente no transporte internacional de cargas, que reduziu em 10% o total de cargas transportadas, contra uma queda de 3% no mercado doméstico.
Importância estratégica para o transporte de cargas industriais de maior valor agregado
De acordo com o gerente-executivo de Infraestrutura da CNI, Wagner Cardoso, o transporte aéreo concentra mercadorias de maior valor agregado, capazes de arcar com custos de frete mais elevados que de outras modalidades de transporte, ou que demandam uma entrega rápida. “São produtos essenciais para a indústria, seja para a venda de bens finais, seja para a entrega de insumos vinculados às cadeias globais de produção”, afirma.
Segundo dados do Ministério da Economia, em 2019, o total de bens exportados e importados na modalidade aérea pelo Brasil totalizou US$ 45,6 bilhões. Dentre os principais produtos, estão máquinas, equipamentos e produtos diversos da indústria, incluindo bens de alto nível tecnológico, como aeronaves e suas partes. Além dessas mercadorias, os produtos farmacêuticos transportados pelo modal totalizaram US$ 6,4 bilhões no ano passado, o que demonstra a importância da aviação para o combate à pandemia da covid-19.
| Grupo de mercadorias | Bilhões de US$ | % |
| Máquinas, aparelhos e materiais elétricos, e suas partes; aparelhos de gravação ou de reprodução de som, aparelhos de gravação ou de reprodução de imagens e de som em televisão, e suas partes e acessórios | 11,27 | 26% |
| Reatores nucleares, caldeiras, máquinas, aparelhos e instrumentos mecânicos, e suas partes | 6,70 | 15% |
| Produtos farmacêuticos | 6,42 | 14% |
| Pérolas naturais ou cultivadas, pedras preciosas ou semipreciosas e semelhantes, metais preciosos, metais folheados ou chapeados de metais preciosos (plaquê), e suas obras; bijuterias; moedas | 4,57 | 10% |
| Aeronaves e aparelhos espaciais, e suas partes | 4,45 | 10% |
| Instrumentos e aparelhos de óptica, de fotografia, de cinematografia, de medida, de controle ou de precisão; instrumentos e aparelhos médico-cirúrgicos; suas partes e acessórios | 3,90 | 9% |
| Produtos químicos orgânicos | 1,56 | 3% |
| Produtos diversos das indústrias químicas | 0,57 | 1% |
| Plásticos e suas obras | 0,45 | 1% |
| Objetos de arte, de coleção e antiguidades | 0,41 | 1% |
| Outros | 4,66 | 10% |
| Total | 45,58 | 100% |
* Exportações + importações transportadas pela modalidade aérea.
Fonte: CNI com base nos dados do Ministério da Economia /SECEX.
Fonte: CNI com base nos dados do Ministério da Economia /SECEX.
As medidas de distanciamento social resultaram em uma drástica redução no número de voos comerciais, o que acarretou quebra na oferta de transporte e aumento no valor de frete. Os dados acumulados para os últimos 12 meses mostram que as empresas aéreas de passageiros respondem por 64% do total de cargas transportadas no mercado internacional brasileiro e por 79% no mercado doméstico.
Dessa forma, dada a sua importância estratégica para a movimentação de cargas essenciais ao consumo e garantia de renda das famílias, o transporte aéreo deve manter o máximo de regularidade e modicidade tarifária no momento da crise decorrente do novo coronavírus.
DOCUMENTO: https://noticias.portaldaindustria.com.br/noticias/infraestrutura/movimentacao-de-carga-aerea-cai-48-em-abril-na-comparacao-com-mesmo-mes-de-2019/
CONSTRUÇÃO CIVIL
CNI. 22/05/2020. Indústria da construção registra 50% de ociosidade em abril. Resultados da Sondagem da Industria da Construção, da CNI, mostram queda na atividade e no número de empregados entre março e abril. A utilização da capacidade operacional é a menor da série histórica

A indústria da construção foi duramente afetada em abril. De acordo com a Sondagem Industria da Construção, divulgada nesta sexta-feira (22) pela Confederação Nacional da Indústria (CNI), a utilização da capacidade operacional foi de 50% no mês passado, o valor mais baixo da série histórica, iniciada em 2012.
“Essa queda reflete os efeitos da crise provocada pelo coronavirus na atividade e não há dúvidas de que a alta ociosidade da indústria deve permanecer enquanto durar o isolamento social”, diz o gerente-executivo de Pesquisa e Competitividade da CNI, Renato da Fonseca.
A pesquisa mostra que os índices de evolução do nível de atividade e do número de empregados permanecem bem abaixos da linha de 50 pontos. O indicador de evolução do nível de atividade registrou 29,4 pontos e o índice de evolução do número de empregados recuou para 24,1 pontos. Esse dado varia entre 0 e 100 e todo valor abaixo de 50 é negativo.
Diante disso, o Indice de Confiança do Empresário Industrial da Construção (ICEI-Construção) registrou 37,6 pontos em maio, bem abaixo do ponto em que se inicia expectativas otimistas. Os componentes do ICEI-construção mostram que a avaliação das condições correntes se tornou mais negativa, embora o pessimismo com relação aos próximos seis meses tenha diminuído.
Sondagem Indústria da Construção. Indústria da construção registra queda na atividade e no emprego
Os resultados da Sondagem Industria da Construção mostram que o setor continua sofrendo os efeitos nocivos da pandemia do novo coronavirus em abril, embora sugiram também que a queda mais brusca tenha ocorrido em março.

DOCUMENTO: https://bucket-gw-cni-static-cms-si.s3.amazonaws.com/media/filer_public/b7/9d/b79dab8c-2b62-4e9b-be65-6701ab3623c8/sondagemindustriadaconstrucao_abril2020.pdf
ARRECADAÇÃO
MEconomia. RFB. 21/05/2020. ARRECADAÇÃO. Receita Federal arrecadou R$ 101,1 bilhões no mês de abril. Valor representa decréscimo real de 28,95% em relação a abril do ano passado, devido à postergação de impostos em decorrência da pandemia
Aarrecadação total dos impostos federais atingiu, em abril de 2020, o valor de R$ 101,1 bilhões, registrando decréscimo real (pelo IPCA) de 28,95% em relação a abril de 2019. No período acumulado de janeiro a abril de 2020, a arrecadação alcançou o valor de R$ 502,2 bilhões, representando um decréscimo pelo IPCA de 7,45%.
As informações foram divulgadas na manhã desta quinta-feira (21/5) pela Receita Federal, em entrevista coletiva virtual do chefe do Centro de Estudos Tributários e Aduaneiros da Receita Federal, auditor-fiscal Claudemir Malaquias.
Quanto às Receitas Administradas pela pela Receita Federal do Brasil, o valor arrecadado em abril de 2020, foi de R$ 93,332 bilhões, representando um decréscimo real (IPCA) de 28,79%, enquanto que no período acumulado de janeiro a abril de 2020, a arrecadação alcançou R$ 476,811 bilhões, registrando decréscimo real (IPCA) de 7,71%.
Segundo, Claudemir Malaquias, o resultado tanto do mês quanto do período acumulado foi bastante influenciado pelos diversos diferimentos (adiamento ou postergação de impostos) decorrentes da pandemia do coronavírus.
Os diferimentos somaram, aproximadamente, R$ 35 bilhões. As compensações apresentaram crescimento de 25,19% no mês de abril de 2020 e de 46,91% no período acumulado. Destaca-se, ainda, que no período observaram-se receitas extraordinárias de Imposto de Renda da Pessoa Jurídica e Contribuição Social sobre Lucro Líquido (IRPJ/CSLL) que contribuíram para o resultado.
Relatórios do resultado da arrecadação: http://receita.economia.gov.br/dados/receitadata/arrecadacao/relatorios-do-resultado-da-arrecadacao/arrecadacao-2020/abril2020/analisemensal-abr-2020.pdf
COMÉRCIO EXTERIOR BRASILEIRO
MEconomia. 20/05/2020. COMÉRCIO EXTERIOR. Brasil e Estados Unidos aprofundam Diálogo Comercial. Países discutiram, em videoconferência, o comércio de bens e serviços e reafirmaram a importância de remover barreiras não-tarifárias para o intercâmbio bilateral
Videoconferência realizada na quinta-feira passada (14/5) reuniu representantes brasileiros e norte-americanos para a sessão plenária da 18ª edição do Diálogo Comercial Brasil - Estados Unidos. As delegações dos dois países abordaram questões que afetam o comércio de bens e serviços e reafirmaram a importância de remover barreiras não-tarifárias para o crescimento do intercâmbio bilateral.
A delegação brasileira foi chefiada pelo secretário de Comércio Exterior do Ministério da Economia, Lucas Ferraz, que conduziu os trabalhos com o subsecretário de Comércio Internacional do Departamento de Comércio (DoC) dos Estados Unidos, Joseph Semsar. A reunião contou, também, com a participação dos embaixadores do Brasil em Washington, Nestor Forster, e dos Estados Unidos no Brasil, Todd Chapman.
As discussões no Diálogo Comercial ocorreram organizadas em seis grupos temáticos: Facilitação de Comércio, Boas Práticas Regulatórias, Regulamentos Técnicos, Análise da Conformidade, Propriedade Intelectual e Economia Digital.
Facilitação de Comércio
No grupo temático de Facilitação de Comércio, o Brasil anunciou a integração de seus sistemas à plataforma internacional que viabiliza o intercâmbio de certificados fitossanitários eletrônicos (e-Phyto). A implementação completa da solução, quando concluída, reduzirá prazos e custos no comércio bilateral de produtos de origem vegetal.
Os dois países também reafirmaram a importância e o interesse no Acordo de Reconhecimento Mútuo entre os programas de Operador Econômico Autorizado. Apesar da necessidade de postergação das visitas in loco da Fase 2 do acordo, devido às restrições a viagens internacionais durante a pandemia da Covid-19, as autoridades aduaneiras de ambas as partes seguem em contato próximo para elaboração dos termos da Fase 3.
Regulamentos Técnicos
Na esfera de Regulamentos Técnicos e Boas Práticas Regulatórias, destaca-se a realização da primeira fase do Workshop de Avaliação da Conformidade, em que agências regulatórias brasileiras e norte-americanas intercambiaram práticas com relação a padrões, análise da conformidade e sistema regulatório.
Os resultados dessa atividade serão compartilhados com o setor privado na segunda fase do Workshop, que deverá ocorrer em setembro próximo.
Economia Digital
No grupo de Economia Digital, Brasil e EUA acordaram agenda com o objetivo de promover a inovação no ambiente digital e evitar barreiras no setor. A iniciativa conta com discussões em tecnologias emergentes como Inteligência Artificial e Internet das Coisas, fluxo de dados e determinados aspectos do comércio eletrônico.
Outra discussão envolveu áreas de cooperação entre o Instituto Nacional de Metrologia, Qualidade e Tecnologia (Inmetro) e a sua contraparte americana, o U.S. National Institute of Standards & Technology (NIST), explorando maneiras de avançar na cooperação entre o Instituto Nacional da Propriedade Industrial (INPI) e a sua contraparte americana, United States Patent and Trademark Office (USPTO).
Prioridades
A plenária de 2020 ocorreu em um momento de grande intensidade na relação comercial entre Brasil e Estados Unidos. A partir da reunião que os presidentes Jair Bolsonaro e Donald Trump mantiveram em Mar-A-Lago, nos Estados Unidos, no dia 7 de março, o Ministério da Economia tem se engajado no mandato de perseguir uma agenda comercial ambiciosa com os EUA.
No dia 9 de abril, um grupo de altos funcionários do Representante Comercial dos Estados Unidos (USTR) e dos ministérios brasileiros da Agricultura, da Economia e das Relações Exteriores tratou da implementação de uma ambiciosa agenda de regras comerciais entre Brasil e Estados Unidos.
A plenária da última quinta-feira, que seria realizada em Washington (DC), ocorreu de maneira virtual, devido à pandemia da Covid-19. Um Comunicado Conjunto com mais informações dos temas discutidos será divulgado em breve pelos dois governos.
Diálogo Comercial
Criado em 2006, o Diálogo Comercial entre Brasil e Estados Unidos tem por objetivo incentivar o comércio e o investimento mútuos. Nos últimos anos, a agenda se ampliou muito além do Ministério da Economia e do DoC.
Nesta edição, pelo lado brasileiro, também participaram representantes do Inmetro, do INPI, da Anvisa, da Anatel, do Ministério da Agricultura, Pecuária e Abastecimento (Mapa), e do Ministério da Infraestrutura, entre outros ministérios e agências. A reunião anterior havia sido realizada em Brasília, em setembro de 2019.
CONTAS PÚBLICAS
MEconomia. REUTERS. 22 DE MAIO DE 2020. Governo vê déficit primário recorde de R$540,5 bi em 2020
BRASÍLIA (Reuters) - O Ministério da Economia atualizou nesta sexta-feira sua estimativa para o déficit primário do governo central (Tesouro, Banco Central e Previdência) a 540,534 bilhões de reais em 2020, rombo recorde para o país, em meio aos impactos do coronavírus na economia.
Por conta do estado de calamidade pública, o governo não precisará cumprir neste ano a meta de déficit primário, de 124,1 bilhões de reais.
Na divulgação do seu relatório de receitas e despesas referente ao segundo bimestre, o governo elevou as despesas primárias calculadas para o ano em 267,663 bilhões de reais, a 1,753 trilhão de reais.
Agora, a conta é de 220,893 bilhões de reais em créditos extraordinários para 2020, ante apenas 7,672 bilhões de reais no relatório do primeiro bimestre.
A equipe do ministro Paulo Guedes também elevou em 34,860 bilhões de reais a conta de subsídios, subvenções e Proagro em 2020, a 49,207 bilhões de reais, fundamentalmente pela transferência de 34 bilhões de reais do Tesouro para o programa de financiamento à folha de pagamento das empresas.
Para a receita líquida, a conta foi diminuída em 111,247 bilhões de reais, a 1,213 trilhão de reais no ano.
Segundo o ministério, a redução nas expectativas de crescimento para a economia representou uma perda de mais de 63 bilhões de reais para a receita. Também pesou nessa conta o menor recolhimento de tributos, por conta do aumento de compensações tributárias e por desonerações associadas a políticas implementadas para o enfrentamento à pandemia de coronavírus.
Os cálculos levaram em conta uma contração do Produto Interno Bruto (PIB) de 4,7% este ano, que já havia sido divulgada mais cedo neste mês pela Secretaria de Política Econômica.
No relatório do primeiro bimestre, o cálculo ainda era de um déficit primário de 161,624 bilhões de reais para o governo central este ano, com crescimento do PIB de 2,1%.
Em 1º de maio, contudo, a equipe econômica divulgou uma estimativa de déficit primário pior, de 566,6 bilhões de reais para o governo central, embora tenha considerado uma queda menos drástica do PIB, de 3,34%, que era então calculada por economistas na pesquisa Focus.
TETO DE GASTOS
Na apresentação do relatório, o Ministério da Economia destacou que as estimativas das despesas primárias atualmente “apontam ligeira pressão para cumprimento do teto dos gastos”, regra que limita o crescimento das despesas no ano à variação da inflação no período anterior.
Essa pressão, segundo o ministério, decorre principalmente do aumento das despesas projetadas com o programa de seguro-desemprego.
“Ao longo do ano serão acompanhados os comportamentos de todas as despesas obrigatórias para, na medida em que sejam necessárias as adequações orçamentárias, todos os ajustes sejam feitos para cumprimento do teto constitucional”, destacou o ministério na apresentação.
Por Marcela Ayres
________________
LGCJ.: