US ECONOMICS
DoL. BLS. October 6, 2017. THE EMPLOYMENT SITUATION -- SEPTEMBER 2017
The unemployment rate declined to 4.2 percent in September, and total nonfarm payroll employment
changed little (-33,000), the U.S. Bureau of Labor Statistics reported today. A sharp employment
decline in food services and drinking places and below-trend growth in some other industries
likely reflected the impact of Hurricanes Irma and Harvey.
    ______________________________________________________________________________________________
   |                                                                                              |
   |                              Hurricanes Irma and Harvey                                      |
   |                                                                                              |
   | Hurricane Irma made landfall in Florida on September 10--during the reference period for both|
   | the establishment and household surveys--causing severe damage in Florida and other parts of |
   | the Southeast. Hurricane Harvey made landfall in Texas on August 25--prior to the September  |
   | reference periods--resulting in severe damage in Texas and other areas of the Gulf Coast.    |
   |                                                                                              |
   | Our analysis suggests that the net effect of these hurricanes was to reduce the estimate     |
   | of total nonfarm payroll employment for September. There was no discernible effect on the    |
   | national unemployment rate. No changes were made to either the establishment or household    |
   | survey estimation procedures for the September figures. For both surveys, collection rates   |
   | generally were within normal ranges, both nationally and in the affected states. In the      |
   | establishment survey, employees who are not paid for the pay period that includes the        |
   | 12th of the month are not counted as employed. In the household survey, persons with a job   |
   | are counted as employed even if they miss work for the entire survey reference week (the     |
   | week including the 12th of the month), regardless of whether or not they are paid. For both  |
   | surveys, national estimates do not include Puerto Rico or the U.S. Virgin Islands.           |
   |                                                                                              |
   | Further discussion of the impact of the recent hurricanes on the September estimates         |
   | can be found in the Commissioner's Statement on the Employment Situation, at                 |
   | www.bls.gov/news.release/jec.nr0.htm. For additional information on how severe weather       |
   | affects employment data, see Question 8 in the Frequently Asked Questions section of this    |
   | news release.                                                                                |
   |                                                                                              |
   | BLS will release the state estimates of employment and unemployment on October 20, 2017, at  |
   | 10:00 a.m. (EDT).                                                                            |
   |______________________________________________________________________________________________|
Household Survey Data
The unemployment rate decreased by 0.2 percentage point to 4.2 percent in September, and the number
of unemployed persons declined by 331,000 to 6.8 million. Both measures were down over the year.
(See table A-1.)
Among the major worker groups, the unemployment rates for adult men (3.9 percent) and Blacks
(7.0 percent) declined in September. The jobless rates for adult women (3.9 percent), teenagers
(12.9 percent), Whites (3.7 percent), Asians (3.7 percent), and Hispanics (5.1 percent) showed
little change. (See tables A-1, A-2, and A-3.)
The number of long-term unemployed (those jobless for 27 weeks or more) was essentially unchanged
in September at 1.7 million and accounted for 25.5 percent of the unemployed. (See table A-12.)
The employment-population ratio increased by 0.3 percentage point to 60.4 percent in September and
has increased by 0.6 percentage point over the past 12 months. The labor force participation rate,
at 63.1 percent, changed little over the month and has shown little movement over the year.
(See table A-1.)
The number of persons employed part time for economic reasons (sometimes referred to as involuntary
part-time workers) was little changed at 5.1 million in September. These individuals, who would have
preferred full-time employment, were working part time because their hours had been cut back or
because they were unable to find full-time jobs. (See table A-8.)
In September, 1.6 million persons were marginally attached to the labor force, down by 275,000 from
a year earlier. (These data are not seasonally adjusted.) These individuals were not in the labor
force, wanted and were available for work, and had looked for a job sometime in the prior 12 months.
They were not counted as unemployed because they had not searched for work in the 4 weeks preceding
the survey. (See table A-16.)
Among the marginally attached, there were 421,000 discouraged workers in September, down by 132,000
from a year earlier. Discouraged workers are persons not currently looking for work because they
believe no jobs are available for them. The remaining 1.1 million persons marginally attached to the
labor force in September had not searched for work for reasons such as school attendance or family
responsibilities. (See table A-16.)
Establishment Survey Data
Total nonfarm payroll employment was little changed in September (-33,000), after adding an average
of 172,000 jobs per month over the prior 12 months. In September, a steep employment decline in food
services and drinking places and below-trend growth in some other industries likely reflected the
impact of Hurricanes Irma and Harvey. Employment rose in health care and in transportation and
warehousing. (See table B-1.)
Employment in food services and drinking places dropped sharply in September (-105,000), as many
workers were off payrolls due to the recent hurricanes. Over the prior 12 months, food services
and drinking places had added an average of 24,000 jobs per month.
In September, health care added 23,000 jobs, in line with its average monthly gain over the prior
12 months (+27,000). The employment increase in ambulatory health care services (+25,000) was partially
offset by a decline in nursing care facilities (-9,000).
Employment in transportation and warehousing increased by 22,000 in September. Job gains occurred in
warehousing and storage (+5,000), couriers and messengers (+4,000), and air transportation (+3,000).
Employment in financial activities changed little in September (+10,000). A job gain in insurance
carriers and related activities (+11,000) largely reflected hurricane-recovery efforts. The gain was
partly offset by losses in activities related to credit intermediation (-4,000) and in commercial
banking (-3,000). Over the year, financial activities has added 149,000 jobs.
In September, employment in professional and business services was little changed (+13,000). Over
the prior 12 months, job growth in the industry had averaged 50,000 per month.
Manufacturing employment was essentially unchanged in September (-1,000). From a recent employment
trough in November 2016 through August of this year, the industry had added an average of 14,000
jobs per month.
Employment in other major industries, including mining, construction, wholesale trade, retail trade,
information, and government, showed little change over the month.
The average workweek for all employees on private nonfarm payrolls was unchanged at 34.4 hours in
September. In manufacturing, the workweek also was unchanged at 40.7 hours, and overtime held steady
at 3.3 hours. The average workweek for production and nonsupervisory employees on private nonfarm
payrolls was unchanged at 33.6 hours. (See tables B-2 and B-7.)
In September, average hourly earnings for all employees on private nonfarm payrolls rose by 12 cents
to $26.55. Over the past 12 months, average hourly earnings have increased by 74 cents, or 2.9 percent.
In September, average hourly earnings of private-sector production and nonsupervisory employees
increased by 9 cents to $22.23. (See tables B-3 and B-8.)
The change in total nonfarm payroll employment for July was revised down from +189,000 to +138,000,
and the change for August was revised up from +156,000 to +169,000. With these revisions, employment
gains in July and August combined were 38,000 less than previously reported. (Monthly revisions result
from additional reports received from businesses and government agencies since the last published
estimates and from the recalculation of seasonal factors.) After revisions, job gains have averaged
91,000 over the past 3 months.
FULL DOCUMENT: https://www.bls.gov/news.release/pdf/empsit.pdf
DoC. USITC. 10/05/2017. U.S. Department of Commerce Issues Affirmative Preliminary Antidumping Duty Determinations of Silicon Metal from Australia, Brazil and Norway
Today, U.S. Secretary of Commerce Wilbur Ross announced affirmative preliminary determinations in the antidumping duty (AD) investigations on silicon metal, finding that exporters from Australia, Brazil, and Norway have sold this merchandise in the United States at rates ranging from 20.79 percent, 56.78 percent to 134.92 percent, and 3.74 percent, respectively at less than fair value.
The Commerce Department will instruct U.S. Customs and Border Protection to collect cash deposits from importers of silicon metal from Australia, Brazil, and Norway based on these preliminary rates.
“The U.S. values its relationships with these nations, but even friendly countries must play by the rules,” said Secretary Ross. “We will continue to review all information related to this preliminary determination while standing up to the American worker and business.”
In 2016, imports of silicon metal from Australia, Brazil, and Norway were valued at an estimated $33.9 million, $60.0 million, and $21.6 million, respectively.
The petitioner is Globe Specialty Metals, Inc. Its production facilities are located in Alabama, New York, Ohio, and West Virginia.
Enforcement of U.S. trade law is a prime focus of the Trump administration. From January 20, 2017, through October 5, 2017, Commerce has initiated 65 antidumping and countervailing duty investigations – a 48 percent increase from the previous year, and a 16-year peak in the number of investigations initiated in a single fiscal year. For the same time period in 2016, The Commerce Department had initiated 44 antidumping and countervailing duty investigations.
Commerce currently maintains 411 antidumping and countervailing duty orders which provide relief to American companies and industries impacted by unfair trade. Antidumping laws provide U.S. businesses and workers with an internationally accepted mechanism to seek relief from the harmful effects of dumping unfairly priced products into the United States.
Commerce is currently scheduled to announce its final AD determinations on February 16.
If Commerce makes affirmative final determinations of dumping and the U.S. International Trade Commission (ITC) makes affirmative final injury determinations, Commerce will issue AD orders. If Commerce makes negative final determinations of dumping or the ITC makes negative final determinations of injury, the investigations will be terminated and no orders will be issued.
The U.S. Department of Commerce’s Enforcement and Compliance unit within the International Trade Administration is responsible for vigorously enforcing U.S. trade laws and does so through an impartial, transparent process that abides by international law and is based solely on factual evidence.
Foreign companies that price their products in the U.S. market below the cost of production or below prices in their home markets are subject to antidumping duties.
In fiscal year 2016, the United States collected $1.5 billion in duties on $14 billion of imported goods found to be underpriced or subsidized by foreign governments.
Fact sheet: http://enforcement.trade.gov/download/factsheets/factsheet-multiple-silicon-metal-ad-prelim-100517.pdf
DoC. USITC. 10/06/2017. U.S. Department of Commerce Issues Affirmative Preliminary Antidumping Duty Determination on Imports of 100- to 150-Seat Large Civil Aircraft From Canada
Today, U.S. Secretary of Commerce Wilbur Ross announced the affirmative preliminary determination in the antidumping duty (AD) investigation of 100- to 150-seat large civil aircraft from Canada. As AFA, Commerce applied the sole dumping margin calculated in the petition for Canadian exports of aircraft, which is 79.82 percent. This rate will apply to all other producers/exporters as well.
The Commerce Department will instruct U.S. Customs and Border Protection to collect cash deposits from importers of 100- to 150-seat large civil aircraft based on this preliminary rate.
“The United States is committed to free, fair and reciprocal trade with Canada, but this is not our idea of a properly functioning trading relationship,” said Secretary Ross. “We will continue to verify the accuracy of this decision, while do everything in our power to stand up for American companies and their workers.”
Although Canadian civil aircraft subject to this investigation have not yet been imported, an April 2016 press release announcing the sale of Canadian civil aircraft to a U.S. airline valued the order to be in excess of $5 billion.
The petitioner is The Boeing Company (IL).
Enforcement of U.S. trade law is a prime focus of the Trump administration. From January 20 through October 5, 2017, the Commerce Department has initiated 65 AD and countervailing duty (CVD) investigations – a 48 percent increase from the previous year, and a 16-year peak in the number of investigations initiated in a single fiscal year. The Commerce Department currently maintains 411 AD and CVD duty orders which provide relief to American companies and industries impacted by unfair trade. Antidumping laws provide U.S. businesses and workers with an internationally accepted mechanism to seek relief from the harmful effects of dumping unfairly priced products into the United States.
Commerce is currently scheduled to announce its final AD determination in this investigation on December 19, 2017.
If the Commerce Department makes an affirmative final determination of dumping and the U.S. International Trade Commission (ITC) makes an affirmative final injury determination, Commerce will issue an AD order. If the Commerce Department makes a negative final determination of dumping or the ITC makes a negative final determination of injury, the investigation will be terminated and no order will be issued.
The U.S. Department of Commerce’s Enforcement and Compliance unit within the International Trade Administration is responsible for vigorously enforcing U.S. trade laws and does so through an impartial, transparent process that abides by international rules and is based solely on factual evidence.
Foreign companies that price their products in the U.S. market below the cost of production or below prices in their home markets are subject to antidumping duties.
In fiscal year 2016, the United States collected $1.5 billion in duties on $14 billion of imported goods found to be underpriced, or subsidized by foreign governments.
Fact sheet: http://enforcement.trade.gov/download/factsheets/factsheet-canada-large-civil-aircraft-ad-prelim-100617.pdf
Global Affairs Canada. October 6, 2017. Statement by Minister of Foreign Affairs on U.S. Department of Commerce preliminary anti-dumping determination on large civil aircraft from Canada
Ottawa, Ontario - The Honourable Chrystia Freeland, Minister of Foreign Affairs, today issued the following statement:
“The deeply integrated aerospace industries of Canada and the United States support well-paying, middle-class jobs in both countries and help strengthen the global competitiveness of the North American aerospace sector.
“We are extremely disappointed by and in complete disagreement with the U.S. Department of Commerce’s preliminary determination in the anti-dumping investigation of exports of large aircraft from Canada.
“Given the baseless and absurdly high preliminary countervailing duties announced on September 26, today’s news comes as no surprise. This is the second step in the U.S. Department of Commerce’s multi-step process.
“These anti-dumping duties on Bombardier’s C Series aircraft unfairly target Canada’s highly innovative aerospace sector and its more than 200,000 workers—and put at risk the almost 23,000 U.S. jobs that depend on Bombardier and its suppliers.
“Boeing is manipulating the U.S. trade remedy system to prevent Bombardier’s new aircraft, the C Series, from entering the U.S. market, despite Boeing’s admission that it does not compete with the C Series.
“Our government will continue to vigorously defend the interests of the Canadian aerospace industry and our aerospace workers against irresponsible and protectionist trade measures. We will continue to raise this issue with Boeing and with the U.S. government at the highest levels.”
BOMBARDIER. October 6, 2017. Commercial Aircraft, Bombardier Inc. Statement on Commerce Department Antidumping Duties Preliminary Decision
Montréal - “We strongly disagree with the Commerce Department’s preliminary decision. It represents an egregious overreach and misapplication of the U.S. trade laws in an apparent attempt to block the C Series aircraft from entering the U.S. market, irrespective of the negative impacts to the U.S. aerospace industry, U.S. jobs, U.S. airlines, and the U.S. flying public.
The Commerce Department’s approach throughout this investigation has completely ignored aerospace industry realities. Boeing’s own program cost accounting practices – selling aircraft below production costs for years after launching a program – would fail under Commerce’s approach. This hypocrisy is appalling, and it should be deeply troubling to any importer of large, complex, and highly engineered products.
Commercial aircraft programs require billions in initial investment and years to provide a return on that investment. By limiting its antidumping investigation to a short 12-month period at the very beginning of the C Series program, Commerce has taken a path that inevitably would result in a deeply distorted finding.
We remain confident that, at the end of the processes, the U.S. International Trade Commission will reach the right conclusion, which is that the C Series benefits the U.S. aerospace industry and Boeing suffered no injury. There is wide consensus within the industry on this matter, and a growing chorus of voices, including airlines, consumer groups, trade experts, and many others that have come forward to express grave concerns with Boeing’s attempt to force U.S. airlines to buy less efficient planes with configurations they do not want and economics that do not deliver value.
The U.S. government should reject Boeing’s attempt to tilt the playing field unfairly in its favor and to impose an indirect tax on the flying public through unjustified import tariffs.
Commerce’s statement that Bombardier is not cooperating with the investigation is a disingenuous attempt to distract from the agency’s misguided focus on hypothetical production costs and sales prices for aircraft that will be imported into the United States far in the future.
As we have explained repeatedly to the Department, Bombardier cannot provide the production costs for the Delta aircraft for a very simple reason; they have not yet been produced. Commerce’s attempt to create future costs and sales prices by looking at aircraft not imported into the United States is inappropriate and inconsistent with the agency’s past practices. This departure from past precedent and disregard of well-known industry practices is an apparent attempt to deprive U.S. airlines from enjoying the benefits of the C Series, even though Boeing abandoned the segment of the market served by the C Series more than a decade ago.
This action also puts thousands of high-technology U.S. jobs at risk given the C Series’ significant U.S. content. More than half of each aircraft’s content, including its engines and major systems, is sourced from U.S. suppliers. Going forward, the C Series program will generate more than $30 billion in business for U.S. suppliers and support more than 22,700 jobs in the United States.”
BOEING. Oct. 5, 2017. Boeing Reports Third-Quarter Deliveries
CHICAGO - The Boeing Company [NYSE: BA] announced today deliveries across its commercial and defense operations for the third quarter of 2017.
Major program deliveries during the third quarter and year-to-date, including deliveries under operating lease (which are identified by parentheses), were as follows:
Major Programs
|
3rd Quarter
2017 |
Year-to-Date
2017 | ||||||
Commercial Airplanes Programs
| ||||||||
737
|
145
|
381
| ||||||
747
|
4
|
8
|
(1)
| |||||
767
|
2
|
7
| ||||||
777
|
16
|
58
| ||||||
787
|
35
|
100
| ||||||
Total
|
202
|
554
| ||||||
Defense, Space & Security Programs
| ||||||||
AH-64 Apache (New)
|
3
|
8
| ||||||
AH-64 Apache (Remanufactured)
|
15
|
43
| ||||||
C-17 Globemaster III
|
—
|
—
| ||||||
CH-47 Chinook (New)
|
2
|
6
| ||||||
CH-47 Chinook (Renewed)
|
9
|
28
| ||||||
F-15 Models
|
4
|
11
| ||||||
F/A-18 Models
|
6
|
18
| ||||||
P-8 Models
|
5
|
14
| ||||||
Commercial and Civil Satellites
|
—
|
3
| ||||||
Military Satellites
|
—
|
—
| ||||||
Contact:
|
Maurita Sutedja (312) 544-2140 (Investor Relations)
|
Ben Hackman (312) 544-2140 (Investor Relations)
| |
Bernard Choi (312) 544-2002 (Communications)
| |
Chaz Bickers (312) 544-2002 (Communications)
|
SOURCE Boeing
COMPUTERWORLD. 06 de Outubro de 2017. Tecnologias Emergentes. Boeing adquire empresa que desenvolve tecnologia autônoma para aeronaves

Aurora Flight Sciences já realizou mais de 30 voos autônomos. Boeing diz que aquisição é essencial para promover o desenvolvimento da próxima geração de aeronaves
A Boeing anunciou a compra a Aurora Flight Sciences, empresa de aviação que tem desenvolvido tecnologia autônoma para equipar aeronaves. "A força e a inovação combinadas de nossas equipes promoverão o desenvolvimento da autonomia para nossos sistemas comerciais e militares", disse Greg Hyslop, diretor de tecnologia e vice-presidente da Boeing Engineering, Test and Technology, em comunicado.
Fundada em 1989, a empresa baseada no estado da Virgínia (EUA) já realizou mais de 30 voos autônomos de teste. No ano passado, recebeu um contrato de US$ 89 milhões do Departamento de Defesa dos Estados Unidos para desenvolver uma aeronave autônoma que levanta e pousa na vertical e que chamou de LightningStrike, uma referência à sua propulsão elétrica.
Vale lembrar que a Aurora é uma das poucas empresas que se associaram a Uber na tentativa de desenvolver uma rede de "táxis voadores".
Entretanto, nem a Boeing e nem a Aurora mencionaram o projeto com o Uber em suas declarações. Ao Business Insider, um representante da Aurora informou que a empresa continuaria a trabalhar com seus parceiros e fornecedores existentes após a aquisição.
A Boeing também não é a única grande empresa da indústria aeroespacial que tem feito grandes apostas em veículos de pouso vertical. Nesta semana, a Airbus revelou que está no caminho para começar a testar seus primeiros veículos elétricos a partir do próximo ano.
FED. October 6, 2017. Consumer Credit August 2017
In August, consumer credit increased at a seasonally adjusted annual rate of 4-1/4 percent. Revolving credit increased at an annual rate of 7 percent, while nonrevolving credit increased at an annual rate of 3-1/4 percent.
FULL DOCUMENT: https://www.federalreserve.gov/releases/g19/current/default.htm
________________
ORGANISMS
IMF. October 5, 2017. A Time to Repair the Roof. A Speech by IMF Managing Director Christine Lagarde. Harvard University
Introduction
Larry, thank you for that generous introduction. Dean Elmendorf, Nick, thank you for welcoming me back to Harvard.
More importantly, I want to thank all three of you for inviting me to speak in October… instead of January. Coming to Cambridge in the fall during the change of seasons is a true pleasure.
Walking around this beautiful campus I was thinking about cycles.
Of course, there are seasonal cycles — like the one we are enjoying right now. Then there are economic cycles. A key challenge in economic cycles is trying to gain perspective on what comes next while you are in the midst of it. If we take a step back, what might we see?
Well, we would see that the long-awaited global recovery is taking root. In July, the IMF projected 3.5 percent global growth for 2017 and 3.6 percent for 2018. Next week we will release an updated forecast ahead of our Annual Meetings — and it will likely be even more optimistic.
Measured by GDP, nearly 75 percent of the world is experiencing an upswing; the broadest-based acceleration since the start of the decade. This means more jobs and improving standards of living in many places all over the world.
But the recovery is not complete.
Some countries are growing too slowly, and last year 47 countries experienced negative GDP growth per capita. And far too many people — across all types of economies — are still not feeling the benefits of the recovery.
Persistent low-growth in the decade since the global financial crisis has put a spotlight on the problem of inequality. It has also exposed long-running weaknesses in our ability to adapt to technological change and global integration. As a result, our social fabric is fraying, and many countries are experiencing increased political polarization.
So, here is the question:
Can the world seize the opportunity of the upswing to secure the recovery and create a more inclusive economy that works for all?
Fortunately, I came to the Kennedy School — and have found some inspiration from your namesake. Addressing Congress in 1962, about a year after the United States emerged from a recession, President Kennedy said:
“Pleasant as it may be to bask in the warmth of recovery… the time to repair the roof is when the sun is shining.”
Let us explore that idea.
1. Is the Sun Starting to Break Through?
We can start by checking whether the sun is breaking through.
A cyclical pickup in investment and trade in the advanced economies — especially in Europe and Japan — has led to better-than-expected growth.
US forecasts have been fluid in light of the economy’s actual performance and changing prospects for tax reform, but the likelihood for this year and the next is that growth will be above trend.
Meanwhile Asian emerging markets — led by China and India — have remained strong.
In other emerging and developing economies, the outlook has become a bit brighter, including among commodity exporters in Sub-Saharan Africa and Latin America.
Globally, financial stability is improving, thanks to a more stable banking system and increased market confidence. Financial conditions across economies have given borrowers new opportunities to fund investments and repair balance sheets.
But there are threats on the horizon: from high levels of debt in many countries, to rapid credit expansion in China, to excessive risk-taking in financial markets.
All of this comes against a backdrop of heightened non-economic challenges, from weather-related disasters in the Caribbean, the US, and Asia to heightened geopolitical tensions on the Korean peninsula.
So, yes, we are seeing some sun break through — but it is not a clear sky. There are two ways to approach a moment like this.
The first is to sit back, enjoy the progress, and wait for the next crisis before making big changes.
As a former finance minister, I understand the appeal of this path. Championing change just when things are getting back on track is not easy — especially when the benefits come further down the road and policymakers already feel reform fatigue.
But just because something is politically difficult, does not mean we can shy away from it.
Think of what President Kennedy said during the space race: “ We choose to go to the moon in this decade and do the other things, not because they are easy, but because they are hard .”
The better path is to approach this moment as an opportunity to make changes that will enable prosperity over the long-term.
Not only is this the right thing to do, now is the right time to do it.
IMF research has shown that reforms are more potent and easier to implement when economies are healthier. [1] Intuitively, this makes sense — it is less complicated to change a tax code when incomes are rising; or to update labor laws when an economy is near full employment.
So we should not let a good recovery go to waste.
We know what can happen if we let the moment pass. Growth will be too weak, and jobs too few. Safety nets will be unable to handle aging populations. Our financial system will be unprepared for future shocks.
We only need to think back to the period before the financial crisis to see the peril of missing an opportunity to guard against risks. In the past, we saw countries undertake reforms, through the ups and downs of economic cycles, while others relaxed during periods of growth. In 10 years, we will be able to look back and see which countries made use of this moment. Or, to put it in Kennedy’s terms: when the sun is shining, we must repair the roof.
How can we get the job done?
2. The Tools We Need to Repair the Roof
We can start with fundamentals.
Inflation is still low and remarkably subdued despite near-full employment in many advanced economies. So monetary policy should continue to support the recovery. At the same time, easy financial conditions can create complacency in markets and a buildup in vulnerabilities, including private sector debt.
So central banks should communicate their plans clearly and execute monetary policy normalization smoothly, as appropriate in each country. This will help avoid market turbulence and a sudden tightening of financial conditions that could derail the recovery. Of course, monetary policy is most effective when complemented with sound fiscal policies that promote long-term, sustainable growth.
Countries with healthier public finances such as Germany and South Korea can use this moment to invest more in their own economies. In places where public debt is too high, governments should use the opportunity of growth to reduce debt relative to GDP and strengthen their resilience.
Containing public debt is also an imperative in many lower income countries, where debt levels have risen markedly in recent years.
Reducing excessive global imbalances — which includes investing more where fiscal positions are healthy and lowering deficits elsewhere — can support growth and avoid financial and exchange rate instability.
At the same time, we know that monetary and fiscal tools can only take us so far. We need the whole toolkit, including structural reforms, to fully repair the roof.
I want to focus on two areas in particular.
First, lifting incomes and creating jobs. Second, investing in people’s futures and fostering inclusive growth.
Lifting Incomes & Creating Jobs
In the largest economies, overall productivity growth — a measure of how efficient we are — has dropped to 0.3 percent, down from a pre-crisis average of about 1 percent. This means that, despite technological advances, wages in many places are only inching up.
Boosting productivity, a factor in lifting wages, requires, among other things, cutting red tape, increasing spending on research and development, and investing in infrastructure.
In some countries, wages are being limited by weak demand, reflected in still too-high unemployment or involuntary part-time employment. So increasing demand can help lead to higher wages. [2]
We also need to look at ways to create new jobs — and this is where labor market reforms come in.
What policies have worked?
In Spain, both employers and employees have been given more workplace flexibility.
In Mexico, revised rules allow young people to more easily enter the formal job market and gain access to health care and other benefits.
In Japan, childcare leave benefits were expanded from 50 percent to 67 percent of salary — as part of larger efforts to get over 1 million women into the workforce.
Empowering women is an economic no-brainer. If women participated in the labor force in the same numbers as men, GDP could increase by as much as 5 percent in the US, 27 percent in India, and 34 percent in Egypt, to name just three examples. [3]
Of course, each country will tailor policies for its needs, but we know that taking advantage of the current momentum can make these types of reforms more affordable and more effective.
Every finance minister and every treasury secretary eventually realizes that all policy changes are made a little easier with growth. And this brings me to my second area of focus — investing in people’s futures.
Investing in People’s Futures and Fostering Inclusive Growth
Over the past three decades economic inequality between countries has declined sharply, led by the rise of emerging markets such as China and India.
However, if we look at inequality within specific countries, especially some advanced economies, we see widening gaps and an increased concentration of wealth among the top earners. [4]
IMF research has shown that excessive inequality hinders growth and hollows out a country’s economic foundation. It erodes trust within society and fuels political tensions.
We know that inequality is often cemented through disparities in schools and access to health care. The good news is that many countries are working to change that narrative.
In India, health care access has been expanded with clear benefits for the poorest citizens.
In South Korea, bonuses are being offered to encourage teachers to work in underperforming schools.
In the US, more is being done to increase the number of women studying science, technology, engineering, and mathematics (STEM).
Thirteen years ago, on this campus, a young man invented a social media platform that would connect the world. But the next Mark Zuckerberg need not come from Harvard. With the right investments in education, she can come from the south side of Chicago, or Sri Lanka, or Senegal.
Giving priority to education also means supporting life-long learning, including retraining programs.
Germany’s apprenticeship program has served as a model for decades — and a recent Canadian initiative showed that on-the-job skills training can be more effective than classroom learning.
This moment also calls on us to prepare for the future of work. The rise of automation could exacerbate inequality — as owners of technology gain efficiency but lower-skilled workers lose jobs.
At the IMF, we are looking at the pros and cons of ideas that may help — from unorthodox concepts like universal basic income to mainstream policies such as more progressive taxation.
In 1981, the average top marginal tax rate in advanced economies was 62 percent. In 2015, it was 35 percent. New IMF research, which will be released next week, suggests that some advanced economies could raise their top tax rates without slowing growth. [5] These are all ideas worth exploring.
They can support our efforts to repair the roof. And yet, there is one more tool we need to make our project a success.
International cooperation.
3. The Benefits of Cooperation
Many of the challenges we face require global solutions. Think about corruption, where the IMF recently committed to do more to help our members. [6] Bribery alone costs more than 1.5 trillion dollars per year, nearly two percent of global GDP. [7] Then there is embezzlement, corporate income tax evasion, money laundering, terrorist financing — all problems with cross-border dimensions.
Or consider financial regulation. The Financial Stability Board and other institutions have made significant progress since the crisis to strengthen the safety of the global financial system, especially through higher levels of bank capital and liquidity.
While some regulations and their implementation would benefit from review, we should ensure the progress we have made is protected. Cooperating on all these challenges can help rebuild trust with skeptical citizens — especially if we prove that cooperation translates into more jobs and a brighter future. Our global economic framework should reflect the changing economy and ensure a level playing-field where everyone has an opportunity for a better life.
Look at trade, for example. Over the last thirty years, trade has raised global growth and lifted hundreds of millions of people out of poverty. But some have been negatively impacted. While protectionist policies are counter-productive, steps can certainly be taken to improve the system, increase transparency, and make trade work for all.
One final example where cooperation is critical: climate change —a threat to every economy and every citizen.
Our estimates suggest that a 1 degree Celsius increase in a country with an average annual temperature of 25 degrees — such as Bangladesh — could reduce per capita GDP by nearly 1.5 percent. [8] But Bangladesh — and similarly-situated countries — cannot meet the challenge by themselves. Only international cooperation can stem the man-made causes of global warming.
So, what is the bottom line? Policymakers should use all tools at their disposal to act now, and take advantage of this period of global growth. And to truly be successful, they should act together. Cooperation remains the best way to create a more prosperous future for every nation.
The IMF can help by serving as a platform for dialogue and a resource for countries seeking to build more resilient economies. Put it another way? The IMF is a critical part of the toolkit.
That is the message I will underscore next week when representatives from our 189 member nations convene for our Annual Meetings.
Conclusion
I started my remarks by mentioning a walk through your campus and how it sparked my thinking. I am certainly not the first French citizen to find a little wisdom in New England. In fact, I think Alexis de Tocqueville would quite enjoy the town hall forum you have created here at Harvard.
He once wrote, “What is not yet done is only what we have not yet attempted to do.” Let us draw inspiration from these words — as well as from the enduring message of President Kennedy — and use this season of transformation to repair the roof while the sun is shining.
Thank you very much.
- IMF, World Economic Outlook: Too Slow for Too Long (Washington: April 2016), Chapter 3.
- IMF, World Economic Outlook (Washington: September 2017), Chapter 2.
- IMF, “ Women, Work, and the Economy: Macroeconomic Gains from Gender Equity,” IMF Staff Discussion Note (Washington: September 2013).
- IMF, October 2017 Fiscal Monitor (Washington: Forthcoming).
- Id.
- IMF, “ The Role of the Fund in Governance Issues: Review of the Guidance Note,” IMF Policy Paper (Washington: August 2017).
- IMF, “ Corruption: Costs and Mitigating Strategies,” IMF Staff Discussion Note (Washington: May 2016).
- IMF, World Economic Outlook (Washington: September 2017), Chapter 3.
________________
ECONOMIA BRASILEIRA
IBGE. 06/10/2017. IPCA fica em 0,16% em setembro
O Índice Nacional de Preços ao Consumidor Amplo (IPCA) de setembro ficou em 0,16%, abaixo dos 0,19% de agosto. No ano, o índice acumula 1,78%, bem abaixo dos 5,51% registrados em igual período do ano passado, sendo o menor acumulado no ano registrado em um mês de setembro desde 1998 (1,42%). Considerando os últimos doze meses o índice ficou em 2,54%, resultado superior aos 2,46% registrados nos 12 meses imediatamente anteriores. Em setembro de 2016, o IPCA havia registrado variação de 0,08%. Clique aqui para acessar a publicação completa.
| Período | TAXA |
|---|---|
| Setembro de 2017 | 0,16% |
| Agosto de 2017 | 0,19% |
| Setembro de 2016 | 0,08% |
| Acumulado no ano 2017 | 1,78% |
| Acumulado nos 12 meses | 2,54% |
Em setembro, dos nove grupos de produtos e serviços pesquisados, somente Alimentação e Bebidas (-0,41%) e Habitação (-0,12%) apresentaram sinal negativo. Nos demais, destaca-se o grupo Transportes com 0,79% de variação e 0,14 ponto percentual (p.p.) de impacto no índice do mês. A tabela a seguir apresenta os resultados apurados por cada grupo de produtos e serviços pesquisados.
| IPCA - Variação e Impacto por Grupos - Mensal | ||||
|---|---|---|---|---|
| Grupo | Variação (%) | Impacto (p.p.) | ||
| Agosto | Setembro | Agosto | Setembro | |
| Índice Geral | 0,19 | 0,16 | 0,19 | 0,16 |
| Alimentação e Bebidas | -1,07 | -0,41 | -0,27 | -0,10 |
| Habitação | 0,57 | -0,12 | 0,09 | -0,02 |
| Artigos de Residência | 0,20 | 0,13 | 0,01 | 0,00 |
| Vestuário | 0,29 | 0,28 | 0,02 | 0,02 |
| Transportes | 1,53 | 0,79 | 0,27 | 0,14 |
| Saúde e Cuidados Pessoais | 0,41 | 0,32 | 0,05 | 0,04 |
| Despesas Pessoais | 0,29 | 0,56 | 0,03 | 0,06 |
| Educação | 0,24 | 0,04 | 0,01 | 0,00 |
| Comunicação | -0,56 | 0,50 | -0,02 | 0,02 |
| Fonte: IBGE, Diretoria de Pesquisas, Coordenação de Índices de Preços | ||||
Pelo quinto mês consecutivo o grupo dos alimentos apresentou queda (-0,41%), sendo essa menos intensa que a registrada em agosto (-1,07%). Os alimentos para consumo em casa passaram de -1,84% em agosto para -0,74% em setembro, sob influência de itens importantes no consumo das famílias como as carnes (que passaram de -1,75% em agosto para 1,25% em setembro) e as frutas (de -2,57% em agosto para 1,74% em setembro). Por outro lado, vieram em queda: o tomate (-11,01%), o alho (-10,42%), o feijão-carioca (-9,43%), a batata-inglesa (-8,06%) e o leite longa vida (-3,00%). Todas as regiões pesquisadas vieram em queda em setembro, indo dos -1,70% registrados na região metropolitana de Recife até -0,08% em Goiânia.
Já a alimentação fora teve alta de 0,18%. As regiões pesquisadas variaram dos -2,71% em Brasília até 0,96% no Rio de Janeiro. A tabela a seguir mostra os resultados.
| IPCA - Alimentação em casa e fora - Variação Mensal | ||
|---|---|---|
| Região | Variação mensal (%) | |
| Alimentação em casa | Alimentação fora | |
| Recife | -1,70 | 0,51 |
| Salvador | -1,41 | -0,37 |
| Fortaleza | -1,04 | 0,75 |
| Porto Alegre | -0,80 | -0,15 |
| Belo Horizonte | -0,79 | 0,02 |
| Curitiba | -0,76 | -0,38 |
| Vitória | -0,60 | 0,88 |
| São Paulo | -0,59 | 0,37 |
| Brasília | -0,52 | -2,71 |
| Rio de Janeiro | -0,42 | 0,96 |
| Belém | -0,29 | -0,10 |
| Campo Grande | -0,13 | 0,45 |
| Goiânia | -0,08 | 0,38 |
| Brasil | -0,74 | 0,18 |
| Fonte: IBGE, Diretoria de Pesquisas, Coordenação de Índices de Preços | ||
No grupo Habitação (-0,12%), a queda ficou na conta da energia elétrica, em média 2,48% mais barata, em razão, principalmente, da entrada em vigor da bandeira tarifária amarela a partir de 1º de setembro, representando uma cobrança adicional de R$ 0,02 a cada Kwh consumido. Em agosto, a bandeira tarifária vigente era a vermelha, incidindo um adicional de R$ 0,03 a cada Kwh consumido.
Ainda no grupo Habitação, cabe destacar as variações no gás de botijão (4,81%) e na taxa de água e esgoto (0,28%). No primeiro, há o reflexo do reajuste de 12,20%, em média, no preço do gás de cozinha vendido em botijões de 13kg, em vigor desde 06 de setembro.
Já na taxa de água e esgoto ocorreu a apropriação da variação de 17,17%, em Belém, que reproduz o reajuste médio de 17,50% em vigor desde junho de 2017 e ainda não apropriado nos índices de preços. Além disso, a variação de 0,78% em Fortaleza reflete o reajuste médio de 4,33%, a partir de 23 de setembro, em complemento ao já aplicado em junho de 2017. Em Vitória, o aumento de 2,99% é devido ao reajuste de 4,10% em vigor desde de 22 de agosto.
No grupo Transportes (0,79%), os combustíveis, com variação de 1,91%, foram o maior impacto individual no índice do mês, 0,10 p.p. O litro da gasolina ficou, em média, 2,22% mais caro de agosto para setembro. As passagens aéreas, com 0,07p.p. de impacto no índice, apresentaram variação de 21,90%.
Na ótica dos índices regionais, os resultados ficaram entre o -0,26% registrado na região metropolitana de Recife e o 0,54% da região metropolitana de Vitória. Nesta, o aumento foi impulsionado pela passagem aérea (37,51%) e pelos combustíveis (2,32%), com destaque para o preço da gasolina, em média 2,39% mais cara. Em Recife, o feijão-mulatinho apresentou queda de 20,39%, e a gasolina registrou redução de 2,29%.
A tabela a seguir apresenta os resultados por região pesquisada.
| IPCA - Variação por Regiões - Mensal, Acumulado no ano e 12 meses | |||||
|---|---|---|---|---|---|
| Região | Peso Regional (%) | Variação (%) | Variação Acumulada (%) | ||
| Agosto | Setembro | Ano | 12 meses | ||
| Vitória | 1,78 | 0,38 | 0,54 | 2,27 | 3,05 |
| Belém | 4,65 | -0,22 | 0,33 | 0,94 | 1,52 |
| Campo Grande | 1,51 | 0,21 | 0,33 | 1,13 | 2,81 |
| Salvador | 7,35 | -0,06 | 0,24 | 1,84 | 2,62 |
| Belo Horizonte | 10,86 | 0,30 | 0,24 | 1,43 | 2,18 |
| Brasília | 2,80 | 0,45 | 0,22 | 2,19 | 3,99 |
| São Paulo | 30,67 | 0,29 | 0,19 | 1,90 | 2,75 |
| Fortaleza | 3,49 | -0,19 | 0,16 | 1,47 | 2,62 |
| Curitiba | 7,79 | 0,35 | 0,14 | 2,26 | 2,55 |
| Rio de Janeiro | 12,06 | 0,02 | 0,13 | 2,11 | 2,56 |
| Porto Alegre | 8,40 | 0,33 | 0,07 | 1,35 | 1,94 |
| Goiânia | 3,59 | -0,03 | 0,04 | 0,74 | 0,85 |
| Recife | 5,05 | 0,18 | -0,26 | 2,47 | 3,85 |
| Brasil | 100,00 | 0,19 | 0,16 | 1,78 | 2,54 |
| Fonte: IBGE, Diretoria de Pesquisas, Coordenação de Índices de Preços | |||||
O IPCA é calculado pelo IBGE desde 1980, se refere às famílias com rendimento monetário de um a 40 salários mínimos, qualquer que seja a fonte, e abrange dez regiões metropolitanas do país, além dos municípios de Goiânia, Campo Grande e de Brasília.
Para cálculo do índice do mês foram comparados os preços coletados no período de 30 de agosto a 27 de setembro (referência) com os preços vigentes no período de 1º de agosto a 29 de agosto de 2017 (base).
INPC varia -0,02% em setembro
O Índice Nacional de Preços ao Consumidor - INPC apresentou variação de -0,02% em setembro. Esta é a menor variação para o mês de setembro desde 1998, quando foi registrado -0,31%. No ano, o acumulado foi de 1,24%, bem abaixo dos 6,18% registrados em igual período do ano passado. Considerando-se os últimos doze meses, o índice desceu para 1,63%, ficando abaixo do 1,73% registrado nos 12 meses imediatamente anteriores. As variações acumuladas no ano e em 12 meses são as menores para um mês de setembro desde a implantação do Plano Real. Em setembro de 2016, o INPC registrou 0,08%.
Os produtos alimentícios tiveram queda de 0,57% em setembro. Em agosto, o resultado havia sido de -1,18%. O agrupamento dos não alimentícios ficou com variação de 0,22%, abaixo da taxa de 0,48% de agosto.
Quanto aos índices regionais, as variações ficaram entre -0,48% registrado na região metropolitana do Rio de Janeiro e 0,32% na região metropolitana de Belém. Em Belém, as carnes registraram alta de 3,47% e o gás de botijão ficou, em média, 7,59% mais caro. No Rio de Janeiro, a queda foi impulsionada pelo ônibus urbano (-4,74%) e pelas contas de energia elétrica (-1,81%). A tabela abaixo apresenta os resultados por região pesquisada.
| INPC - Variação por Regiões - Mensal, Acumulado no ano e 12 meses | |||||
|---|---|---|---|---|---|
| Região | Peso Regional (%) | Variação mensal (%) | Variação Acumulada (%) | ||
| Agosto | Setembro | Ano | 12 meses | ||
| Rio de Janeiro | 9,51 | -0,14 | -0,48 | 0,97 | 0,88 |
| Recife | 7,17 | -0,16 | -0,28 | 2,04 | 3,31 |
| Brasília | 1,88 | 0,17 | -0,16 | 1,96 | 3,40 |
| Fortaleza | 6,61 | -0,25 | -0,04 | 1,28 | 2,44 |
| Porto Alegre | 7,38 | 0,26 | -0,02 | 1,02 | 1,33 |
| Curitiba | 7,29 | 0,35 | -0,01 | 2,26 | 2,13 |
| São Paulo | 24,24 | 0,02 | 0,02 | 1,19 | 1,45 |
| Campo Grande | 1,64 | -0,16 | 0,03 | -0,02 | 1,21 |
| Goiânia | 4,15 | -0,27 | 0,03 | 0,15 | 0,00 |
| Salvador | 10,67 | -0,20 | 0,09 | 1,75 | 2,29 |
| Belo Horizonte | 10,60 | 0,08 | 0,09 | 0,73 | 1,01 |
| Vitória | 1,83 | 0,31 | 0,24 | 1,84 | 2,18 |
| Belém | 7,03 | -0,35 | 0,32 | 0,81 | 1,11 |
| Brasil | 100,00 | -0,03 | -0,02 | 1,24 | 1,63 |
| Fonte: IBGE, Diretoria de Pesquisas, Coordenação de Índices de Preços | |||||
O INPC é calculado pelo IBGE desde 1979, se refere às famílias com rendimento monetário de um a cinco salários mínimos, sendo o chefe assalariado. Abrange dez regiões metropolitanas, além dos municípios de Goiânia, Campo Grande e de Brasília.
Para cálculo do índice do mês foram comparados os preços coletados no período de 30 de agosto a 27 de setembro (referência) com os preços vigentes no período de 1º de agosto a 29 de agosto de 2017 (base).
Combustíveis impulsionam inflação em setembro
Com alta de 1,91% em setembro, frente ao mês anterior, os combustíveis foram os itens que mais contribuíram para a variação de 0,16% do Índice Nacional de Preços ao Consumidor Amplo (IPCA), divulgado hoje pelo IBGE. O litro da gasolina ficou, em média, 2,22% mais caro em relação a agosto. Essa alta foi influenciada pela política de reajuste de preços dos combustíveis dos últimos meses. No acumulado do ano, o IPCA registrou 1,78%, e, nos últimos 12 meses, 2,54%.
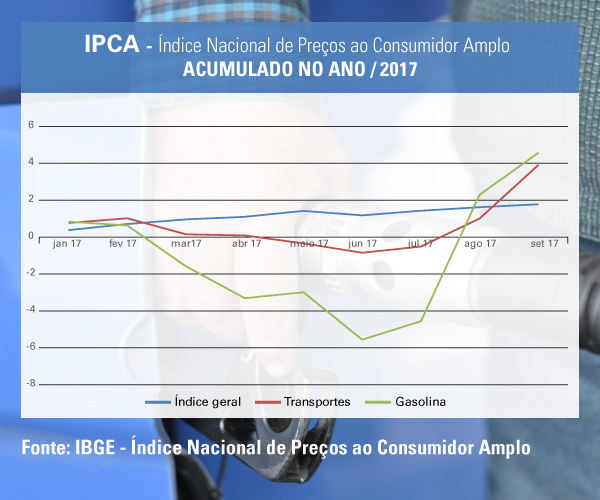
Dos nove grupos de produtos contemplados pelo IPCA, apenas Alimentação e bebidas (-0,41) e Habitação (-0,02) apresentaram quedas nos preços. O gerente da pesquisa, Fernando Gonçalves, explica o que levou a esses resultados: “A safra do primeiro semestre foi o aspecto determinante para a diminuição no valor dos alimentos. Já em relação à habitação, a retração pode ser atribuída, principalmente, à mudança da bandeira tarifária de energia elétrica em setembro, que reduziu a cobrança do quilowatt-hora dos domicílios em um centavo”.
INPC tem sua menor taxa desde 1998
O Índice Nacional de Preços ao Consumidor (INPC), também divulgado hoje, registrou -0,02%, menor variação para o mês de setembro desde 1998, quando registrou -0,31%. Também as variações acumuladas no ano e em 12 meses tiveram baixas recordes: são as menores para um mês de setembro desde a implantação do Plano Real. O INPC reflete os produtos com mais peso no orçamento das famílias que ganham de um a cinco salários mínimos, enquanto o IPCA refere-se às família de um a 40 salários mínimos.
O INPC e o IPCA são calculados pelo IBGE desde, respectivamente 1979 e 1980. Para cálculo do índice do mês foram comparados os preços coletados no período de 30 de agosto a 27 de setembro (referência) com os preços vigentes no período de 1º de agosto a 29 de agosto de 2017 (base).
Ambas as pesquisas são feitas nas regiões metropolitanas de Belém, Fortaleza, Recife, Salvador, Belo Horizonte, Rio de Janeiro, São Paulo, Curitiba, Vitória e Porto Alegre, Brasília e municípios de Goiânia e Campo Grande.
Texto: João Neto e Pedro Renaux
Imagem: Pixabay
Gráfico: Marcelo Barroso
DOCUMENTO: ftp://ftp.ibge.gov.br/Precos_Indices_de_Precos_ao_Consumidor/IPCA/Fasciculo_Indicadores_IBGE/ipca-inpc_201709caderno.pdf
FGV. IBRE. 05-Out-2017. Índices Gerais de Preços. IPC-C1. Inflação para famílias com renda entre 1 e 2,5 salários mínimos recua em setembro
O Índice de Preços ao Consumidor - Classe 1 (IPC-C1) do mês de setembro apresentou variação de -0,25%, taxa 0,12 ponto percentual (p.p.) abaixo da apurada em agosto, quando o índice registrou variação de -0,13%. Com este resultado, o indicador acumula alta de 1,46%, no ano e, 1,89%, nos últimos 12 meses.
Em setembro, o IPC-BR registrou variação de -0,02%. A taxa do indicador nos últimos 12 meses ficou em 3,17%, nível acima do registrado pelo IPC-C1.
Três das oito classes de despesa componentes do índice apresentaram decréscimo em suas taxas de variação: Habitação (0,24% para -0,33%), Transportes (1,06% para 0,18%) e Comunicação (-0,04% para -0,05%). Nestes grupos, os destaques partiram dos itens: tarifa de eletricidade residencial (0,54% para -2,72%), tarifa de ônibus urbano (0,47% para -0,43%) e tarifa de telefone móvel (0,07% para -0,14%), respectivamente.
Em contrapartida, os grupos: Alimentação (-1,04% para -0,77%), Vestuário (0,22% para 0,63%), Saúde e Cuidados Pessoais (-0,07% para 0,03%), Educação, Leitura e Recreação (0,05% para 0,37%) e Despesas Diversas (0,15% para 0,27%) apresentaram acréscimo em suas taxas de variação. Nestas classes de despesa, destacam-se os itens: carnes bovinas (-1,62% para 0,39%), roupas (0,00% para 0,95%), medicamentos em geral (-0,13% para 0,01%), passagem aérea (-3,35% para 12,51%) e cigarros (0,00% para 0,56%), respectivamente.
IBGE. 06/10/2017. Índice Nacional da Construção Civil varia 0,27% em setembro
O Índice Nacional da Construção Civil (Sinapi), calculado pelo IBGE, apresentou variação de 0,27% em setembro, ficando 0,04 ponto percentual acima da taxa do mês anterior (0,23%). O indicador acumulado no ano foi de 2,98%. Já o acumulado nos últimos doze meses ficou em 4,25%, apenas 0,01 ponto percentual maior que os 4,24% registrados nos doze meses imediatamente anteriores. Em setembro de 2016, o índice foi 0,26%.
O custo nacional da construção, por metro quadrado, que em agosto fechou em R$ 1.055,18, em setembro subiu para R$ 1.057,99, sendo R$ 539,52 relativos aos materiais e R$ 518,47 à mão de obra.
A parcela dos materiais teve aumento de 0,45% no mês de setembro, taxa inferior a registrada em de setembro de 2016 (0,59%). Já em relação a agosto de 2017 (-0,12%), a parcela dos materiais mostrou elevação significativa: 0,57 ponto percentual.
A variação da parcela da mão de obra foi de 0,08%, inferior à de agosto (0,60%) e a menor taxa dos últimos seis meses. De janeiro a setembro de 2017 os acumulados foram 1,58% (materiais) e 4,52% (mão de obra), e os acumulados dos últimos doze meses ficaram em 1,63% (materiais) e 7,18% (mão de obra).
A maior variação mensal foi da região Norte
Com alta na parcela dos materiais em 4 estados, e com a variação captada na mão de obra no estado do Pará, consequência de reajuste salarial de acordo coletivo, a Região Norte apresentou a maior variação regional em setembro, 0,66%.
Este mês todos as regiões apresentaram taxas positivas, conforme a seguir: 0,39% (Nordeste), 0,10% (Sudeste), 0,19% (Sul) e 0,34% (Centro-Oeste).
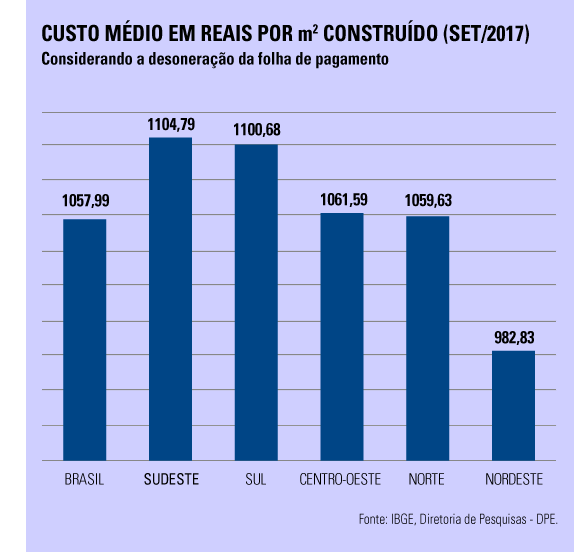
Os custos regionais, por metro quadrado, foram para: R$ 1.059,63 (Norte); R$ 982,83 (Nordeste); R$ 1.104,79 (Sudeste); R$ 1.100,68 (Sul) e R$ 1.061,59 (Centro-Oeste).
Pará teve a maior alta
Decorrente de pressão exercida pelo reajuste salarial do acordo coletivo, o Pará, com 1,47%, foi o estado com a mais elevada variação mensal.
SISTEMA NACIONAL DE PESQUISA DE CUSTOS E ÍNDICES DA CONSTRUÇÃO CIVIL
Setembro/2017 considerando a desoneração da folha de pagamento de empresas do setor da construção civil
ÁREAS GEOGRÁFICAS | CUSTOS MÉDIOS | NÚMEROS ÍNDICES | VARIAÇÕES PERCENTUAIS | ||
|---|---|---|---|---|---|
| R$/m2 | JUN/94=100 | MENSAL | NO ANO | 12 MESES | |
| BRASIL | 1057,99 | 529,61 | 0,27 | 2,98 | 4,25 |
| REGIÃO NORTE | 1059,63 | 527,99 | 0,66 | 2,00 | 3,76 |
| Rondonia | 1097,44 | 611,85 | 0,40 | 2,98 | 2,59 |
| Acre | 1164,40 | 618,10 | 0,47 | 3,30 | 4,29 |
| Amazonas | 1026,56 | 502,58 | -0,03 | 4,26 | 3,84 |
| Roraima | 1095,16 | 454,84 | 0,11 | 0,81 | 0,88 |
| Para | 1043,25 | 500,04 | 1,47 | 0,13 | 3,62 |
| Amapa | 1048,57 | 509,30 | -0,07 | 3,19 | 3,53 |
| Tocantins | 1117,91 | 587,81 | -0,30 | 3,42 | 6,70 |
| REGIÃO NORDESTE | 982,83 | 530,93 | 0,39 | 3,60 | 4,64 |
| Maranhão | 1015,56 | 535,00 | 0,32 | 4,67 | 5,61 |
| Piaui | 1009,14 | 670,61 | -0,07 | 2,12 | 5,63 |
| Ceara | 988,45 | 570,84 | 0,60 | 3,58 | 4,01 |
| Rio Grande do Norte | 939,36 | 473,50 | -0,05 | 3,34 | 6,90 |
| Paraiba | 1027,92 | 568,40 | 0,37 | 3,35 | 4,07 |
| Pernambuco | 957,34 | 511,83 | 0,24 | 2,35 | 5,46 |
| Alagoas | 976,21 | 487,83 | 0,64 | 3,43 | 3,50 |
| Sergipe | 927,95 | 493,22 | -0,06 | 2,64 | 2,39 |
| Bahia | 978,00 | 517,64 | 0,58 | 4,36 | 4,06 |
| REGIÃO SUDESTE | 1104,79 | 528,79 | 0,10 | 2,90 | 3,77 |
| Minas Gerais | 999,92 | 550,31 | -0,06 | 4,28 | 4,24 |
| Espirito Santo | 967,13 | 536,38 | 0,31 | 2,28 | 4,78 |
| Rio de Janeiro | 1190,10 | 542,40 | 0,05 | 3,67 | 3,79 |
| São Paulo | 1144,77 | 517,16 | 0,19 | 1,94 | 3,45 |
| REGIÃO SUL | 1100,68 | 526,37 | 0,19 | 3,08 | 6,18 |
| Parana | 1075,02 | 514,16 | 0,03 | 1,72 | 6,05 |
| Santa Catarina | 1192,80 | 646,17 | 0,36 | 5,25 | 6,91 |
| Rio Grande do Sul | 1054,97 | 478,93 | 0,27 | 3,16 | 5,62 |
| REGIÃO CENTRO-OESTE | 1061,59 | 542,00 | 0,34 | 2,30 | 3,07 |
| Mato Grosso do Sul | 1055,09 | 496,06 | 0,43 | 3,73 | 3,81 |
| Mato Grosso | 1054,72 | 601,76 | 0,05 | 0,88 | 1,14 |
| Goias | 1036,77 | 547,61 | 0,36 | 1,93 | 2,33 |
| Distrito Federal | 1109,90 | 490,12 | 0,60 | 3,62 | 6,00 |
FONTE: IBGE, Diretoria de Pesquisas, Coordenação de Índices de Preços.
NOTA: estes resultados são calculados mensalmente pelo IBGE através de convênio com a CAIXA – Caixa Econômica Federal.
NOTA: estes resultados são calculados mensalmente pelo IBGE através de convênio com a CAIXA – Caixa Econômica Federal.
SISTEMA NACIONAL DE PESQUISA DE CUSTOS E ÍNDICES DA CONSTRUÇÃO CIVIL
Setembro/2017 não considerando a desoneração da folha de pagamento de empresas do setor da construção civil
ÁREAS GEOGRÁFICAS | CUSTOS MÉDIOS | NÚMEROS ÍNDICES | VARIAÇÕES PERCENTUAIS | ||
| R$/m2 | JUN/94=100 | MENSAL | NO ANO | 12 MESES | |
| BRASIL | 1137,76 | 569,28 | 0,26 | 3,08 | 4,45 |
| REGIÃO NORTE | 1134,35 | 565,18 | 0,70 | 2,21 | 4,15 |
| Rondonia | 1173,77 | 654,41 | 0,37 | 3,05 | 2,71 |
| Acre | 1245,87 | 661,19 | 0,44 | 3,41 | 4,30 |
| Amazonas | 1098,27 | 537,94 | -0,03 | 4,54 | 4,17 |
| Roraima | 1178,24 | 489,30 | 0,10 | 0,84 | 0,89 |
| Para | 1117,26 | 535,30 | 1,57 | 0,29 | 4,16 |
| Amapa | 1120,61 | 544,20 | -0,06 | 3,52 | 3,84 |
| Tocantins | 1196,23 | 628,85 | -0,28 | 3,68 | 7,15 |
| REGIÃO NORDESTE | 1052,69 | 568,54 | 0,37 | 3,67 | 4,76 |
| Maranhão | 1086,02 | 572,31 | 0,28 | 4,79 | 5,71 |
| Piaui | 1077,00 | 715,60 | -0,05 | 2,00 | 5,81 |
| Ceara | 1055,78 | 609,46 | 0,56 | 3,52 | 3,90 |
| Rio Grande do Norte | 1003,18 | 505,53 | -0,04 | 3,13 | 6,97 |
| Paraiba | 1099,76 | 608,27 | 0,35 | 3,56 | 4,22 |
| Pernambuco | 1026,05 | 548,34 | 0,23 | 2,45 | 5,68 |
| Alagoas | 1044,35 | 521,83 | 0,62 | 3,53 | 3,59 |
| Sergipe | 993,68 | 528,18 | -0,06 | 2,79 | 2,55 |
| Bahia | 1051,51 | 556,26 | 0,54 | 4,51 | 4,22 |
| REGIÃO SUDESTE | 1192,81 | 570,75 | 0,09 | 3,02 | 3,95 |
| Minas Gerais | 1073,67 | 590,78 | -0,06 | 4,48 | 4,47 |
| Espirito Santo | 1040,82 | 577,40 | 0,29 | 2,40 | 5,03 |
| Rio de Janeiro | 1288,00 | 587,22 | 0,05 | 3,71 | 3,82 |
| São Paulo | 1238,55 | 559,45 | 0,17 | 2,05 | 3,68 |
| REGIÃO SUL | 1188,06 | 568,07 | 0,17 | 3,19 | 6,54 |
| Parana | 1163,67 | 556,43 | 0,03 | 1,85 | 6,58 |
| Santa Catarina | 1291,05 | 699,17 | 0,33 | 5,40 | 7,16 |
| Rio Grande do Sul | 1129,73 | 512,96 | 0,26 | 3,26 | 5,90 |
| REGIÃO CENTRO-OESTE | 1135,69 | 579,72 | 0,35 | 2,32 | 3,11 |
| Mato Grosso do Sul | 1127,91 | 529,95 | 0,42 | 3,86 | 3,92 |
| Mato Grosso | 1129,36 | 644,30 | 0,05 | 0,81 | 1,06 |
| Goias | 1108,45 | 585,12 | 0,43 | 1,99 | 2,37 |
| Distrito Federal | 1187,53 | 524,60 | 0,56 | 3,72 | 6,29 |
FONTE: IBGE, Diretoria de Pesquisas, Coordenação de Índices de Preços.
NOTA: estes resultados são calculados mensalmente pelo IBGE através de convênio com a CAIXA – Caixa Econômica Federal.
NOTA: estes resultados são calculados mensalmente pelo IBGE através de convênio com a CAIXA – Caixa Econômica Federal.
Região Norte lidera alta no custo da construção civil em setembro
A Região Norte liderou a variação do custo do metro quadrado na construção civil registrado pelo Índice Nacional da Construção Civil (SINAPI) em setembro, divulgado hoje pelo IBGE. A localidade apresentou variação de 0,66%, mais que o dobro do índice nacional, de 0,27% no mesmo período. No ano, o indicador acumula 2,98% de alta no país, com elevação de 4,25% nos últimos 12 meses.
No Brasil, o custo médio do metro quadrado construído em setembro foi de 1.057,99, sendo 539,52 relativos aos materiais utilizados e 518,47 provenientes do gasto com mão de obra.
Pesou na elevação do custo na região Norte o dissídio coletivo do setor no Pará, o que aumentou as despesas com mão de obra no estado. Este foi um dos fatores que levaram o local a ter a maior taxa de variação do país em setembro (1,47%).
“Na variação de mão de obra observamos aumento significativo apenas no estado do Pará, onde tivemos dissídio coletivo. É um estado que tem pouco impacto no índice nacional. Como vínhamos registrando um maior número de dissídios nos outros meses, essa foi a taxa mais baixa dos últimos seis meses”, ressalta Augusto Oliveira, pesquisador do IBGE.
No índice nacional, portanto, teve maior impacto a variação do custo dos materiais, o outro componente do indicador, em razão, principalmente, dos aumentos nos estados do Acre, Bahia, Distrito Federal, Ceará e Maranhão, que, em sua maioria, registraram alta nas despesas com o segmento relacionado ao cimento.
DOCUMENTO: ftp://ftp.ibge.gov.br/Precos_Custos_e_Indices_da_Construcao_Civil/Fasciculo_Indicadores_IBGE/sinapi_201709caderno.pdf
REUTERS. 6 DE OUTUBRO DE 2017. UE decide sobretaxar aço laminado a quente de Brasil por dumping
BRUXELAS (Reuters) - A União Europeia (UE) decidiu sobretaxar o aço laminado a quente do Brasil, Irã, Rússia e Ucrânia, após queixa de siderúrgicas europeias de que o produto usado para construção e maquinários estava sendo vendido a preços excessivamente baixos.
A UE cobrará uma tarifa antidumping de 17,6 a 96,5 euros (20,6 a 112,8 dólares) por tonelada a partir de sábado, informou o diário oficial do bloco na sexta-feira.
A Comissão Europeia inicialmente havia proposto estabelecer um preço mínimo - de 472,27 euros por tonelada -, mas revisou a proposta depois de não receber o apoio de países membros da UE.
Entre as empresas sujeitas à sobretaxa estão as unidades brasileiras de ArcelorMittal e Aperam, que também produzem na Europa, a Companhia Siderúrgica Nacional, Usiminas e Gerdau - com taxas entre 53,4 e 63 euros por tonelada.
O aço iraniano estará sujeito a uma taxa de 57,5 euros por tonelada e a ucraniana Metinvest Group à cobrança de 60,5 euros.
As taxas para os produtores russos variaram entre 17,6 euros para a PAO Severstal, 53,3 euros para a Novolipetsk Steel e 96,5 euros por tonelada para a MMK.
A Comissão também encerrou sua investigação sobre as importações de aço da Sérvia sem propor medidas.
Por Philip Blenkinsop
REUTERS. 6 DE OUTUBRO DE 2017. Safras eleva projeções para produção e área de soja no Brasil em 2017/18
SÃO PAULO (Reuters) - A consultoria Safras & Mercado elevou nesta sexta-feira sua projeção para a produção de soja na temporada 2017/18 para 114,70 milhões de toneladas, de 113,20 milhões de toneladas na estimativa anterior, de julho.
A projeção para a área também foi elevada, para 35,54 milhões de hectares, de 35,50 milhões de hectares na previsão anterior.
“O início dos trabalhos de plantio no Brasil começa a confirmar nosso sentimento de uma forte expansão da área brasileira de soja nesta nova temporada”, afirmou o analista da Safras & Mercado, Luiz Fernando Roque, em nota.
Na temporada passada, o Brasil plantou 33,8 milhões de hectares.
Segundo o analista, a oleaginosa volta a ganhar áreas destinadas ao milho na última safra em praticamente todos os Estados.
No Centro-Oeste e no Sudeste, os produtores confirmam a tendência de centralizar a produção da primeira safra (safra verão) na oleaginosa, enquanto a segunda safra (safrinha) é cada vez mais centralizada no cereal.
“A forte expansão da área de soja nesta nova temporada se ampara principalmente neste fator. Além disso, o fator preço também impulsiona esta transferência de áreas nesta nova safra, com a oleaginosa voltando a remunerar melhor o produtor”, completou o analista.
Por José Roberto Gomes
MAPA. PORTAL BRASIL. 05/10/2017. ECONOMIA E EMPREGO. Exportações. Singapura anuncia que irá comprar carne bovina e suína com osso do Brasil. Medidas devem ampliar vendas para o país asiático em US$ 100 milhões por ano. Apenas com cortes bovinos serão R$ 89 milhões. Medidas deve ampliar vendas para o país asiático em US$ 100 milhões por ano. Apenas com cortes bovinos serão R$ 89 milhões
O Brasil ganhou um pouco mais de espaço no mercado de exportação de carnes. Nessa quinta-feira (5), o governo de Singapura anunciou que vai comprar carne bovina e suína com osso, além de miúdos, de produtores brasileiros.
Com essa decisão, a perspectiva do Ministério da Agricultura, Pecuária e Abastecimento é de que as vendas de carnes para o país asiático aumentem em mais de US$ 100 milhões por ano. Apenas com cortes bovinos serão US$ 89 milhões.
“A decisão mostra a confiança de Singapura no serviço sanitário brasileiro”, afirmou o ministro da Agricultura, Blairo Maggi. Ele recebeu a informação na Rússia, onde chefia uma missão para ampliar o comércio bilateral entre Brasil e Rússia.
Reconhecimento
Em nota publicada no site do Ministério da Agricultura, Maggi explicou que essa decisão de Singapura é um “reconhecimento do esforço dos técnicos do ministério e do setor produtivo no aperfeiçoamento de controles sanitários”.
Singapura já comprava carne brasileira, mas apenas de Santa Catarina, que é reconhecida pela Organização Mundial de Saúde Animal (OIE) como livre de febre aftosa. Agora, produtores de todo o País poderão ser vendidos para os asiáticos.
CNI. 6 de Outubro de 2017. Medo do desemprego sobe e alcança segunda maior marca da série histórica, informa CNI. Apesar dos sinais de recuperação da economia e a queda no desemprego, instabilidade política e incerteza sobre retomada do crescimento ainda contribuem para receio de demissão no futuro próximo

A economia brasileira tem apresentado sinais de recuperação, tanto na produção quanto no mercado de trabalho. No entanto, o índice do medo de desemprego subiu para 67,7 pontos, em setembro, o segundo mais elevado da série histórica, iniciada em 1996. O indicador, divulgado nesta sexta-feira (6), pela Confederação Nacional da Indústria (CNI), apresentou alta de 1,6 ponto em relação à medição de julho e está acima da média histórica de 49,0 pontos.
O índice mostra a percepção do brasileiro e suas perspectivas em relação ao emprego. “Se uma pessoa tem receio de que ela ou alguém próximo venha a perder o emprego, isso reflete na alta do indicador”, explica Maria Carolina Marques, economista da CNI. Segundo ela, fatores como a instabilidade política e incertezas sobre a retomada do crescimento influenciam a piora no indicador. “As notícias positivas da economia vêm acompanhadas por notícias negativas e há, ainda, 12 milhões de desempregados”, observa.
SATISFAÇÃO COM A VIDA – O índice de satisfação com a vida permaneceu praticamente estável, em relação a julho: subiu de 65,9 pontos para 66,0 pontos. O patamar foi mantido por influência da região Sudeste, onde o indicador subiu 1,3 ponto, no comparativo. Na contramão, houve forte queda no Norte-Centro-Oeste, de 2,6 pontos. Na região Nordeste, o índice caiu 0,1 ponto e, no Sul, 0,7 ponto.
Esta edição da pesquisa realizou 2.000 entrevistas em 126 municípios, entre 15 e 20 de setembro de 2017.
Medo do desemprego & Satisfação com a vida. Medo do desemprego atinge segundo maior patamar da série histórica
Apesar dos sinais de recuperação da produção e do emprego, o índice de medo do desemprego atingiu o segundo maior valor da série histórica. O índice de satisfação com a vida permaneceu relativamente estável em um dos menores patamares da série.

Índices do Medo do Desemprego e Satisfação com a Vida: https://static-cms-si.s3.amazonaws.com/media/filer_public/68/ce/68ce5ad1-4196-44c9-89da-6f1b9ef98bcb/medododesemprego_e_satisfacaocomavida_setembro2017.pdf
________________
LGCJ.: